How to detect bottlenecks in AWS architectures?
When running applications on AWS, performance problems often come from unexpected places. A workload might be designed to scale, but hidden bottlenecks in compute, databases, networking, or even service limits can hold it back. Detecting these bottlenecks is not about staring at a single CPU chart; it’s about understanding the architecture as a whole and tracing where delays or capacity issues build up.
In this blog, we’ll walk through how to detect bottlenecks in AWS environments, covering the layers where they occur most often, the tools you need to spot them, and practical steps to resolve them.
Understanding bottlenecks in AWS architectures
In distributed cloud architectures, bottlenecks emerge when a component or resource constrains throughput relative to demand. Unlike monolithic environments, bottlenecks can take many forms in AWS. Below are a few examples:
- Compute limits: Instances, containers, or Lambda functions running out of CPU, memory, or concurrency.
- Storage/database limits: RDS queries waiting on locks, DynamoDB partitions throttled, or S3 key hotspots.
- Networking issues: API Gateway request throttling, NAT Gateway bandwidth limits, or high latency from cross-region traffic.
- Service quotas: Built-in AWS limits (API request caps, Lambda concurrency caps).
- Application design flaws: Synchronous service calls, no caching, or too much dependency on a single database.
What makes AWS bottlenecks tricky is that they often emerge at scale or under specific workloads, not during everyday traffic. That’s why detection depends on good observability and a structured process.
Building the foundation with observability
Before you can detect bottlenecks, your system must provide visibility. AWS gives you several layers of observability out of the box:
- AWS CloudWatch metrics & logs: Baseline visibility into service performance. Critical for CPU, memory (via CloudWatch agent), disk I/O, and network throughput.
- AWS X-Ray: Distributed tracing for service-to-service latency analysis.
- VPC flow logs: Network-level insights into traffic patterns, packet drops, and throughput constraints.
- Service-specific metrics: DynamoDB (RCU/WCU throttling), S3 (request latency), Lambda (duration and cold start counts), RDS (query execution times, buffer cache hit ratio).
Many teams also rely on external application performance monitoring (APM) tools like ManageEngine Applications Manager to correlate AWS metrics with application-level performance. Without this visibility, bottlenecks remain invisible until they cause outages.
A step-by-step process for detecting bottlenecks
The most effective way to track down bottlenecks is to follow a systematic process.
Step 1: Profile workloads
Start by measuring baseline performance under normal and peak load. This includes latency, throughput, and error rates. Having a baseline lets you distinguish between expected variation and real anomalies.
Step 2: Isolate components
Break the system into planes. Examine each layer separately before checking end-to-end flows.
A. Compute layer
- EC2: High CPU (>80%), network/EBS limits hit.
- Lambda: Hitting concurrency limits, cold starts too frequent.
- ECS/EKS: Pods throttled, evicted, or starved of CPU/memory.
B. Data layer
- RDS/Aurora: Long query times, lock waits, storage IOPS maxed.
- DynamoDB: Hot partitions, throttled reads/writes.
- S3: Latency spikes, sequential key naming hotspots.
- ElastiCache: Too many evictions, high cache miss ratio.
C. Networking layer
- API Gateway: 429 errors (throttling), high request latency.
- NAT Gateway: Bandwidth saturation, high costs.
- VPC/Network: Cross-AZ/region latency, packet drops.
Step 3: Analyze resource usage
Each service has telltale signs of trouble. Analyze them to understand the bottlenecks better:
- EC2 → High sustained CPU, throttled EBS, or network caps.
- Lambda → High memory usage, frequent cold starts, or throttling.
- Containers → Pods starved or evicted.
- RDS → High query latency, lock waits, IOPS hitting limits.
- DynamoDB → Throttled requests or uneven partition access.
- S3 → Latency spikes with sequential key naming.
- ElastiCache → Cache miss ratio or eviction spikes.
- Network → Cross-AZ traffic, NAT bottlenecks, API Gateway throttling.
Step 4: Trace latencies
Use AWS X-Ray or distributed tracing to map how requests move across services. This often reveals issues like a slow downstream dependency, retry loops, or synchronous service calls that turn one delay into a system-wide slowdown.
Common service-level bottlenecks in AWS
Although every workload is different, some bottlenecks appear repeatedly across AWS customers:
- EC2: Network bandwidth caps on smaller instance types, or EBS throughput limits that silently throttle storage-heavy workloads.
- Lambda: Account-wide concurrency caps that cause throttling, especially in burst traffic scenarios.
- RDS/Aurora: A single primary instance overloaded with both reads and writes, solved by adding replicas or switching to Aurora’s scaling model.
- DynamoDB: Poor partition key design that creates hot partitions.
- S3: Sequential or patterned key names that funnel requests to a single storage partition.
- API Gateway: Regional request caps or per-client throttling leading to 429 errors.
- NAT Gateway: Hidden bandwidth bottlenecks and rising costs when handling large outbound traffic.
Recognizing these patterns makes troubleshooting faster, since you can test likely culprits early.
Advanced diagnostic techniques
Sometimes the usual dashboards aren’t enough. In those cases, advanced techniques help uncover deeper bottlenecks:
- Chaos engineering: Intentionally inject failures or load spikes (using tools like AWS Fault Injection Simulator) to reveal hidden choke points.
- Synthetic load testing: Simulate concurrent workloads with Locust, JMeter, or Gatling against API endpoints or backend databases. You can also use synthetic monitoring techniques in monitoring solutions such as Applications Manager.
- Correlation analysis: Employ statistical methods (cross-correlation, regression) to identify lagging indicators that precede bottlenecks (e.g., rising queue length correlating with downstream latency).
- Cost signal analysis: Unexpected cost spikes often indicate hidden inefficiencies, e.g., repeated retries in S3 PUT requests or DynamoDB over-provisioning.
These techniques move detection from reactive troubleshooting to proactive discovery.
Architectural anti-patterns that cause bottlenecks
Many AWS bottlenecks trace back to architectural anti-patterns rather than random chance. Some of the most damaging are:
- Monolithic databases: Over-centralization of state into a single RDS instance.
- Synchronous chaining: Serial API calls between services instead of event-driven decoupling.
- Lack of caching strategy: Over-reliance on origin data stores without Redis/CloudFront intermediaries.
- Improper quota awareness: Designing without considering per-region AWS soft/hard limits.
- Inefficient IAM policies: Overly granular evaluation leading to excessive control-plane latency.
Avoiding these patterns is often more effective than firefighting after the fact.
Fixing and preventing bottlenecks
Once a bottleneck is identified, you can apply targeted solutions:
- Scaling adjustments: Transition from reactive Auto Scaling to predictive scaling powered by ML models (e.g., EC2 Auto Scaling with Predictive Scaling).
- Service substitution: Replace synchronous APIs with asynchronous messaging (SQS/Kinesis).
- Sharding and partitioning: Redistribute workload across DynamoDB partitions or database shards.
- Caching and CDNs: Offload repeated queries with ElastiCache, edge caching with CloudFront.
- Architectural refactoring: Adopt event-driven or microservices architectures to minimize interdependency.
To prevent recurrence, integrate continuous detection with CloudWatch anomaly detection, AWS DevOps Guru, or third-party monitoring solutions like Applications Manager. For hybrid workloads, you can also benefit from hybrid cloud monitoring.
Optimize your AWS workloads with Applications Manager
Detecting bottlenecks in AWS is less about chasing isolated metrics and more about building a holistic view of the entire architecture. With the right observability, structured analysis, and awareness of service-specific limits, performance issues can be identified before they impact end users.
While native AWS monitoring tools provide strong foundations, many teams benefit from a unified monitoring solution like ManageEngine Applications Manager, which consolidates metrics, traces, and alerts into one platform. By leveraging the use of such a solution into your workflow, you can move from reactive firefighting to proactive performance management—keeping your AWS workloads resilient, efficient, and ready to scale.


Core bottleneck detection features of ManageEngine Applications Manager include:
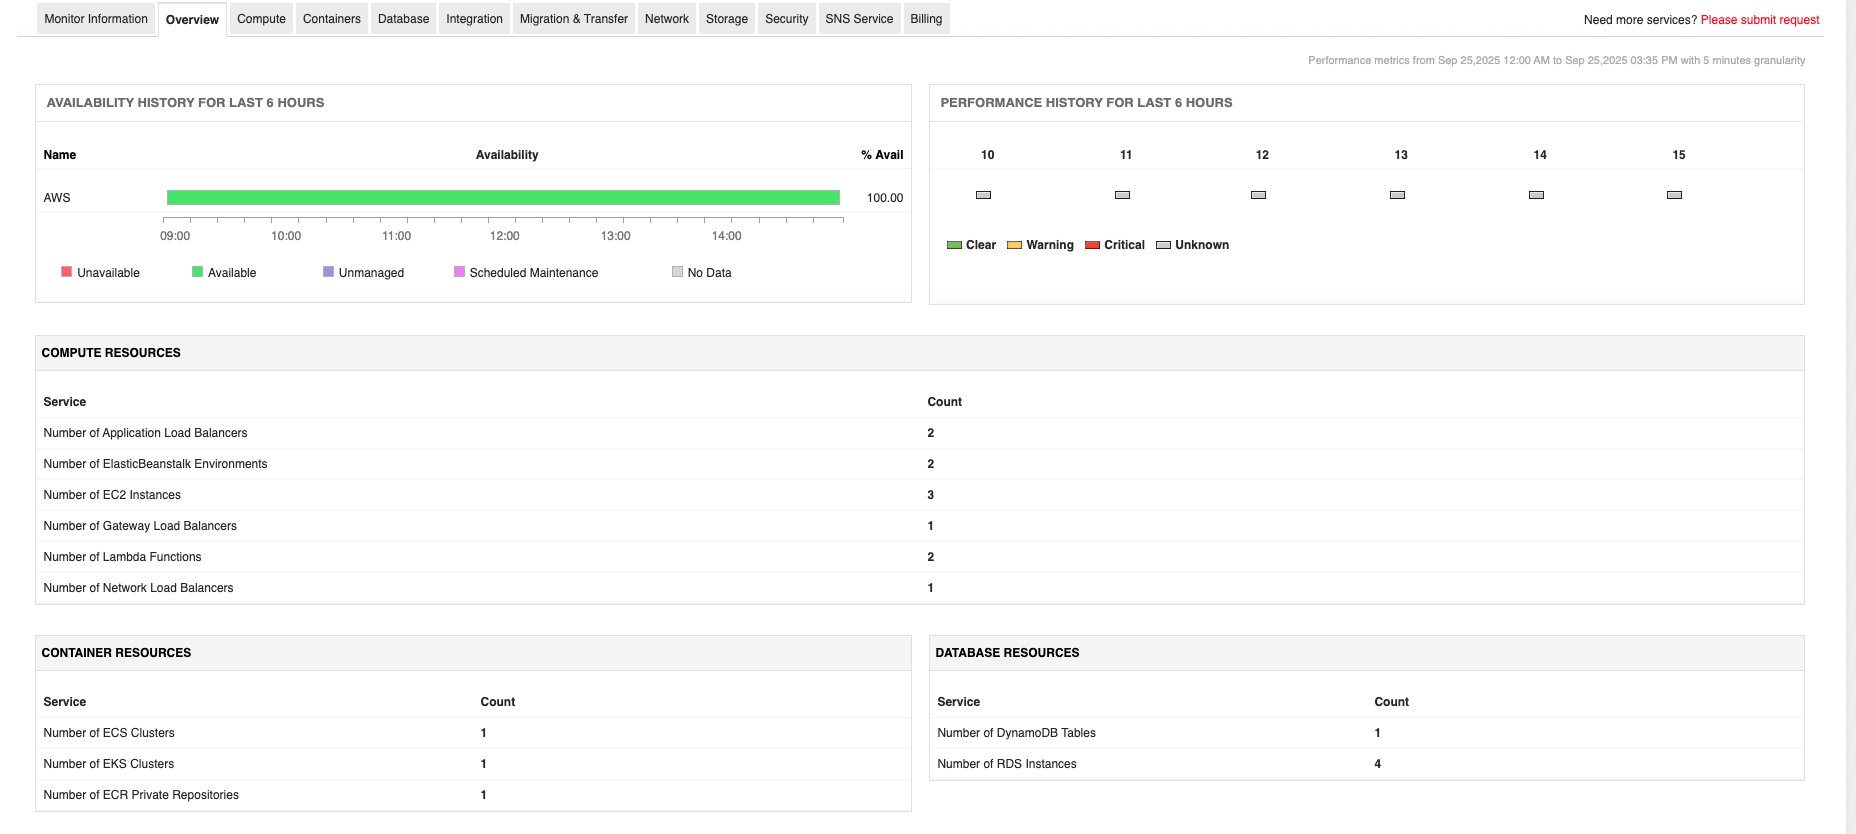
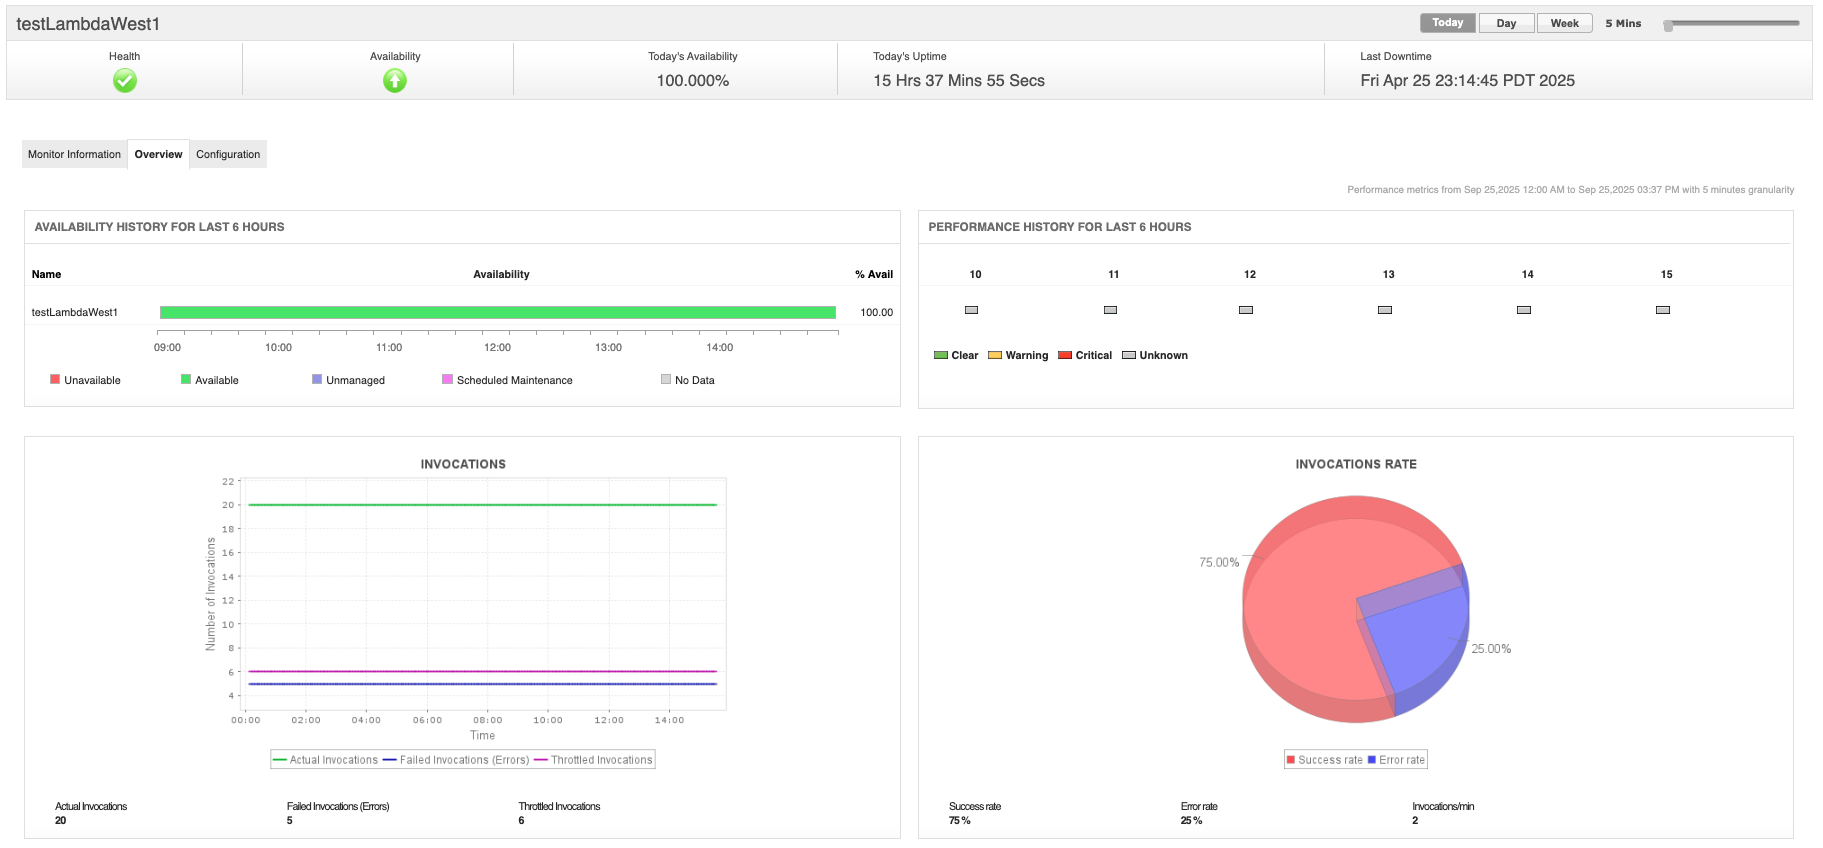
- Unified AWS monitoring: Consolidates monitoring for EC2, RDS, S3, ELB, Lambda, DynamoDB, and more, allowing the identification of bottlenecks across compute, storage, databases, serverless, and container resources from a single dashboard.
- Application performance monitoring (APM): Provides code-level diagnostics with deep +, revealing latency, slow transactions, and failed API calls by drilling down to specific functions, queries, or request flows.
- Synthetic and real user monitoring (RUM): Analyzes both simulated and actual user interactions, correlating front-end, network, and back-end delays to uncover where degradation occurs within the AWS stack.
- Application service maps and dependency mapping: Visualizes interdependencies in cloud architectures, enabling fast pinpointing of bottlenecks in multi-tier and microservices environments.
- Root cause analysis and automated remediation: Diagnoses underlying issues with dynamic dashboards and fault management systems that can trigger corrective actions to reduce mean time to resolution (MTTR).
Applications Manager integrates with AWS CloudWatch to aggregate metrics, events, and logs, supplementing native AWS insights with deeper analytics and visualization capabilities. It can monitor more than just infrastructure. It supports databases, containers (EKS, ECS, Kubernetes), and hybrid setups, helping teams detect resource contention, slow queries, and configuration errors across the entire stack.
To see how this works in practice, you can download a free 30-day trial or schedule a personalized demo of Applications Manager today.