Navigating the cloud frontier: A deep dive into cloud application monitoring tools
Cloud adoption has redefined application delivery. Workloads now span microservices, containers, serverless platforms, and multi-cloud providers, creating complexity in performance, reliability, and cost management.
This shift has made cloud application monitoring a core practice rather than a support function. Modern cloud monitoring tools go beyond tracking metrics; they combine performance data, contextual analytics, and automation to turn raw observability into actionable insight. At enterprise scale, the strength of cloud monitoring systems directly impacts customer experience, operational efficiency, and revenue.
Defining cloud application monitoring
Cloud application monitoring is about making sense of everything your apps, infrastructure, cloud services, and users generate. It is structuring data in a way that teams can see root-cause, effect, and impact across the entire cloud stack. It brings together four streams of telemetry:
- Metrics: Time-series values like CPU, memory, latency, and throughput.
- Logs: System records that capture warnings, errors, and state changes.
- Traces: Request paths that show how transactions flow across services.
- Events: Signals from services and integrations that flag changes or issues.
The goal is to gain actionable intelligence from raw telemetry. Monitoring cloud helps teams turn numbers into context, highlighting deviations in ways that map back to both infrastructure health and business outcomes.
Strategic importance of cloud application monitoring
Applications have become the face of businesses, and in the cloud, they are no longer siloed stacks but distributed, fast-moving services. From microservices and containers to APIs and serverless functions, the performance of each piece directly impacts end user experience. This makes monitoring not a support function, but a strategic driver. Its impact spans five dimensions:
- User experience and reliability: Ensuring applications stay available and responsive, even when underlying services fail or scale unpredictably; with the help of automated responsive actions.
- Performance assurance: Detecting latency, throughput, and code-level slowdowns across distributed components before they degrade the customer journey.
- DevOps acceleration: Feeding real-time feedback loops that help teams ship features faster, validate releases in production, and innovate without risking stability.
- Cost and resource efficiency: Highlighting over-provisioned or underutilized components so application delivery doesn’t balloon cloud bills.
- Governance and compliance: Generating auditable traces of application activity to prove adherence to policies, security standards, and regulations.
Without this visibility, organizations lose grip on application behavior, creating blind spots that slow innovation and erode trust. Cloud application monitoring closes that gap with contextual intelligence across every layer of the app stack.
Cloud application monitoring vs cloud infrastructure monitoring
It’s important to distinguish between monitoring at the infrastructure layer and the application layer. Cloud infrastructure monitoring tracks the fundamentals like compute, storage, databases, containers, and network health. It ensures that the building blocks of the cloud stack are available and functioning as expected.
Cloud application monitoring, on the other hand, takes a step further. It correlates infrastructure health with application performance, end-user experience, and business KPIs. It answers not just “is the system running?” but also “is the application fast, reliable, and delivering value to users?”
Both layers are complementary. Strong infrastructure underpins reliable applications, while application monitoring provides the context that makes infrastructure data meaningful. The most effective platforms unify both into a single view, enabling teams to troubleshoot faster and align technical performance with business outcomes.
Core challenges in cloud application monitoring
Monitoring the cloud isn’t the same as watching over a static data center. The dynamic architecture of cloud and evolving components open doors to new risks everyday. Cloud monitoring tools need to rise to these challenges:
- Fragmented visibility: KPI data can pile up across microservices, containers, and serverless functions. Legacy monitoring can’t stitch end-to-end monitoring together.
- Latency and degradation: Slowdowns can root from code issues, DB bottlenecks, network congestion, or throttled APIs. Only integrated telemetry can pinpoint the cause.
- Elasticity and ephemeral instances: Auto-scaling constantly spins workloads up and down. Static cloud monitoring tools fail when instances disappear or reappear under new IDs.
- Cloud costs: Elastic provisioning often leads to waste. Monitoring must tie usage directly to business outcomes to control spend.
- Operational noise: Metrics, logs, and traces generate overwhelming volumes. Without intelligent filtering, teams drown in false alarms.
- Security and compliance risks: Application-level vulnerabilities, misconfigurations, and anomalies often surface first in monitoring data. Detecting and addressing them in near real time is critical to prevent breaches and ensure compliance.
- Complex troubleshooting: Incidents rarely stay confined to one layer. Correlation across code, databases, external APIs, and cloud services; paired with automated root cause analysis is essential to reduce outage duration.
- Vendor lock-in: Native monitoring often works best within a single cloud ecosystem, making it harder to gain consistent visibility across AWS, Azure, GCP, and on-premises. Over-reliance on one vendor’s monitoring stack can limit flexibility in hybrid or multi-cloud strategies.
Critical components of cloud application monitoring
Effective cloud monitoring spans multiple layers. Key capabilities include:
Cloud service coverage:
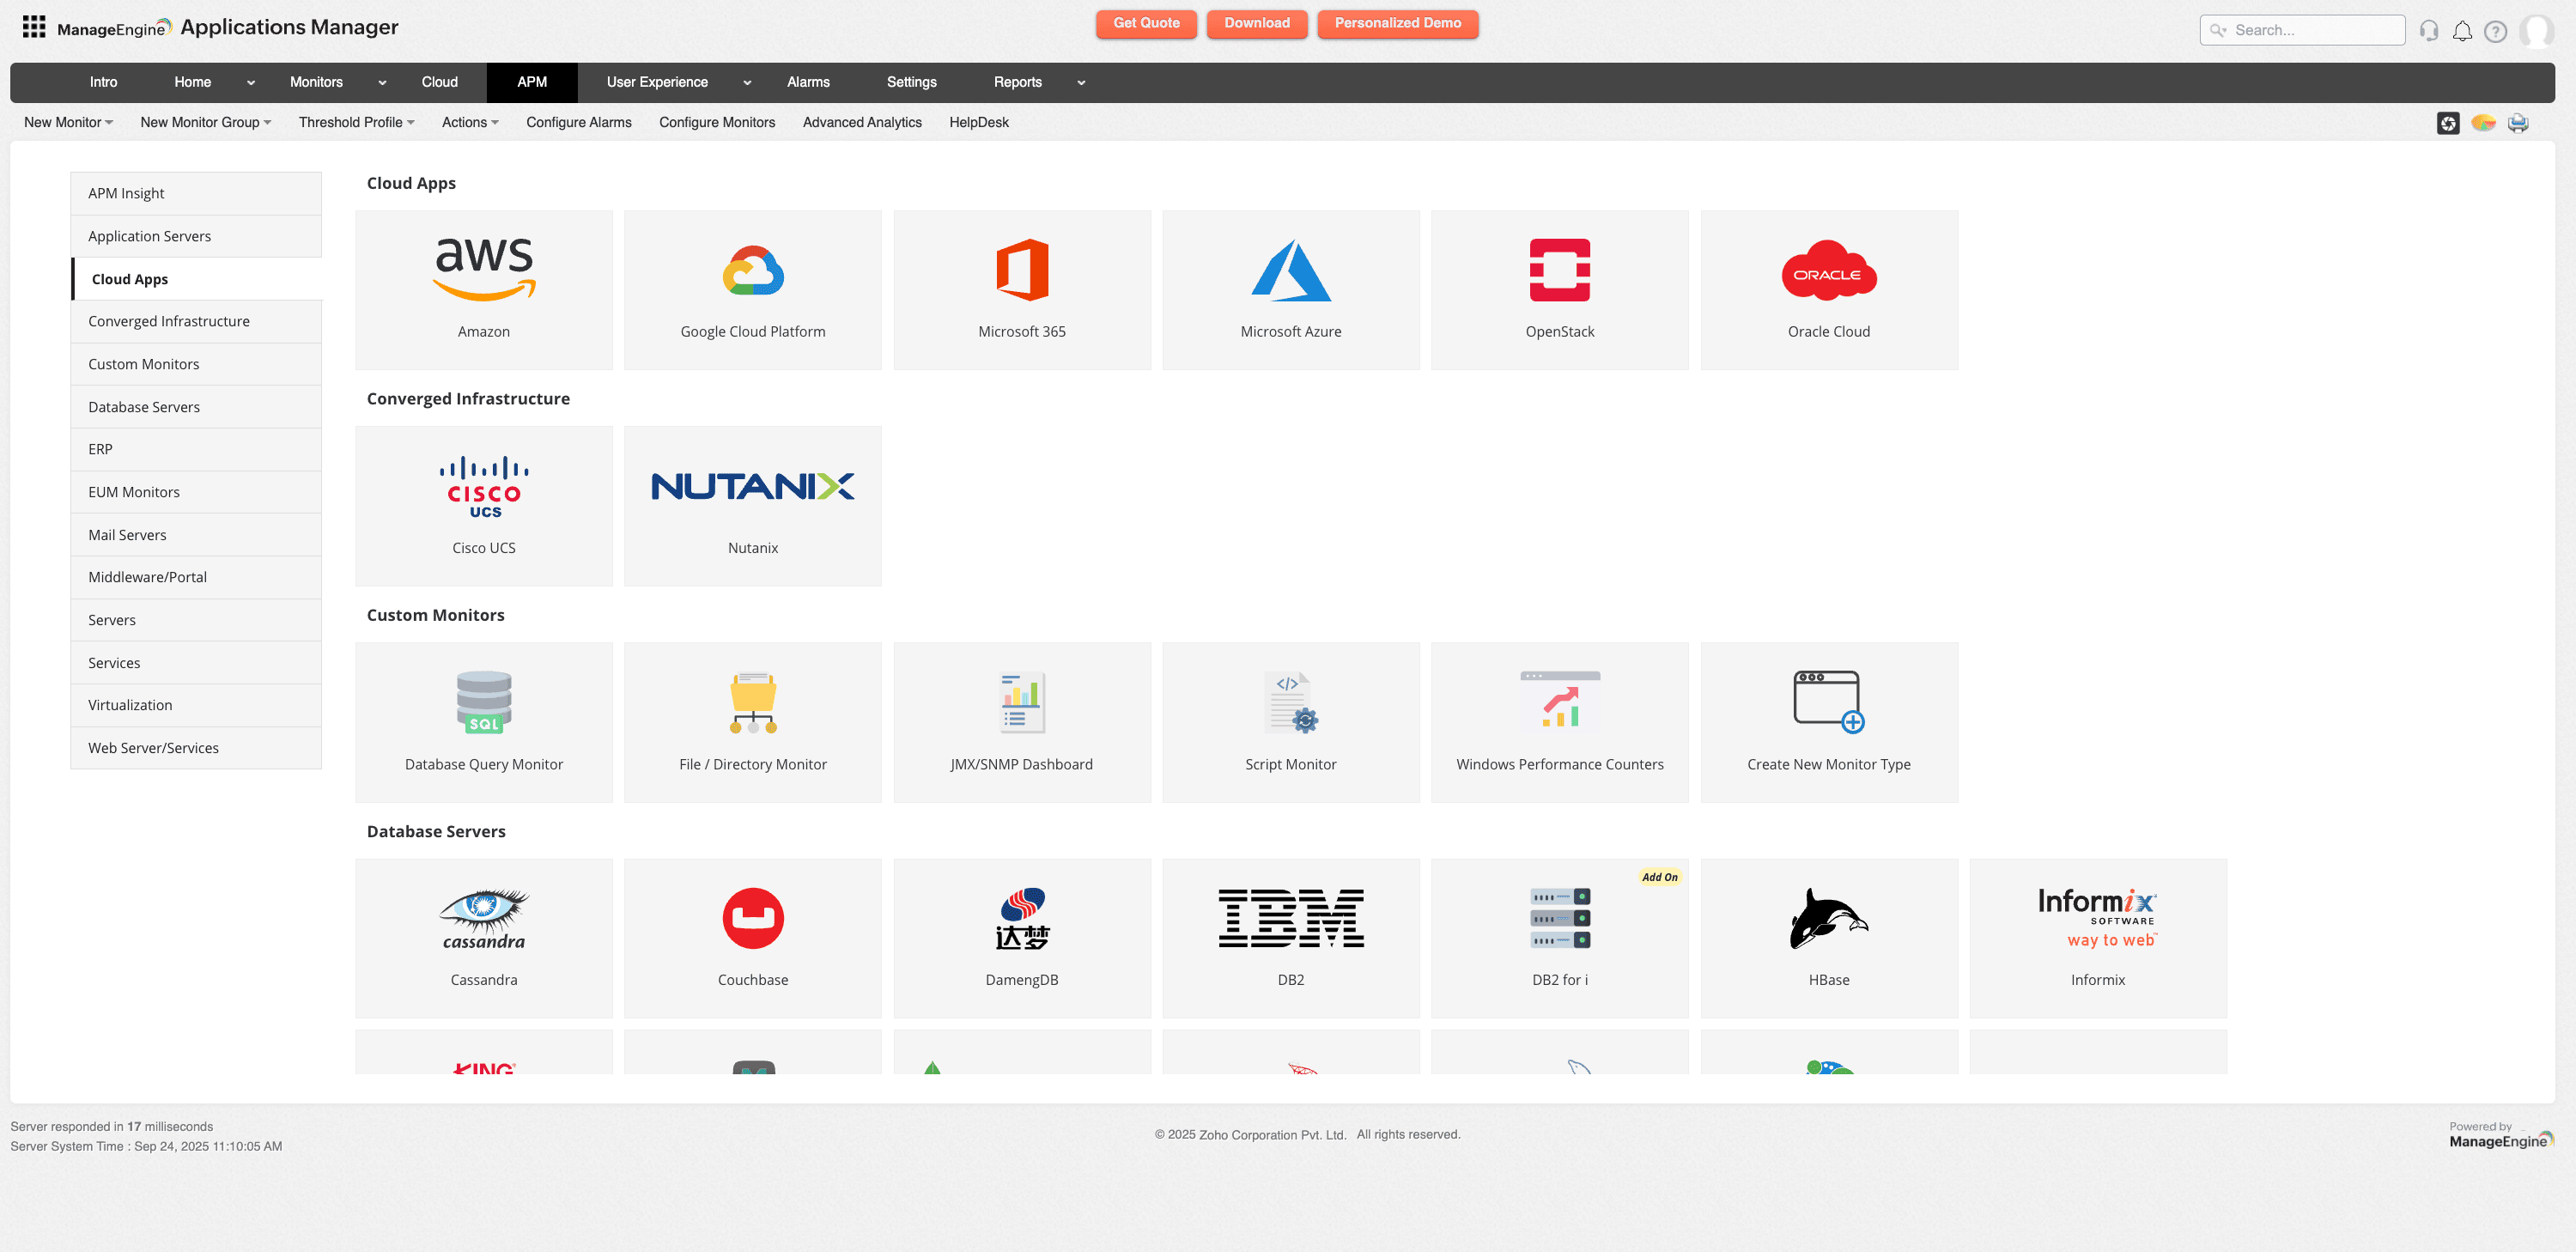
Native integration with AWS, Azure, and GCP is critical. For applications, monitoring must extend beyond infrastructure to the managed services they rely on, such as cloud-managed databases, storage, APIs, and message queues. Applications Manager consolidates this telemetry into a single platform, ensuring application health is measured in the context of its underlying cloud dependencies.

Application performance monitoring (APM):
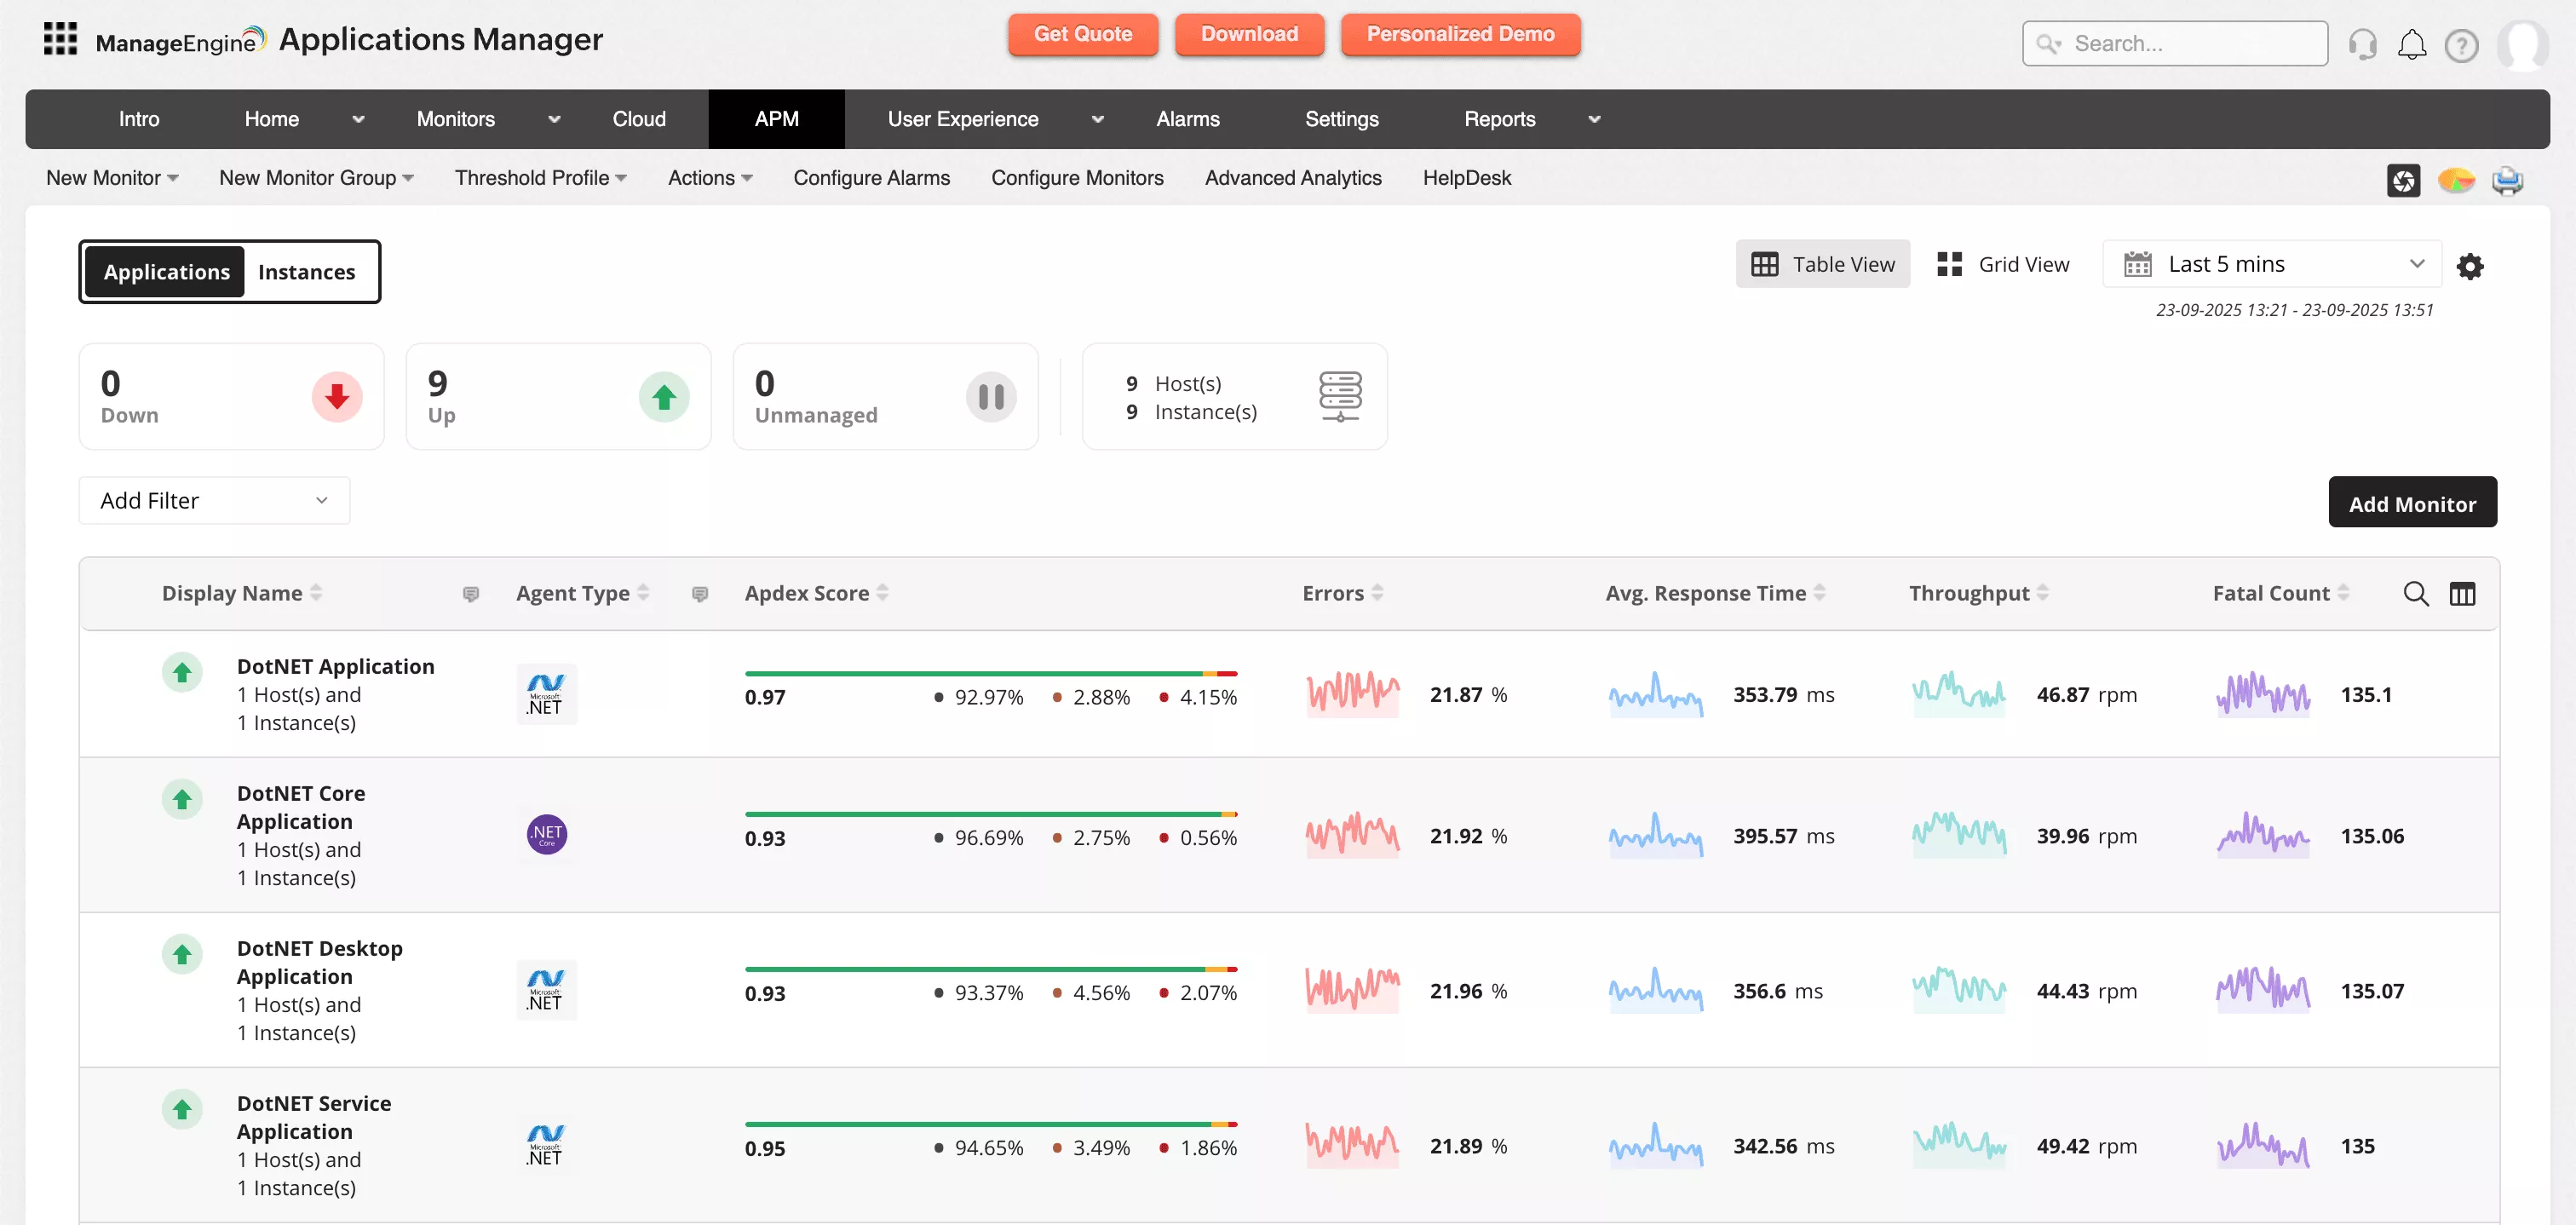
Application performance monitoring (APM) connects directly to the application layer. It traces transactions end to end, pinpoints slow code execution, highlights inefficient database queries, and surfaces bottlenecks before they cascade into user-facing issues.

Infrastructure and container monitoring:
Applications depend on compute, containers, and orchestration platforms. Monitoring VM health, container utilization, and Kubernetes performance provides context on how infrastructure affects application responsiveness and scalability. For example, pod-level saturation or node misconfiguration often manifests as application latency.
End-user experience monitoring:
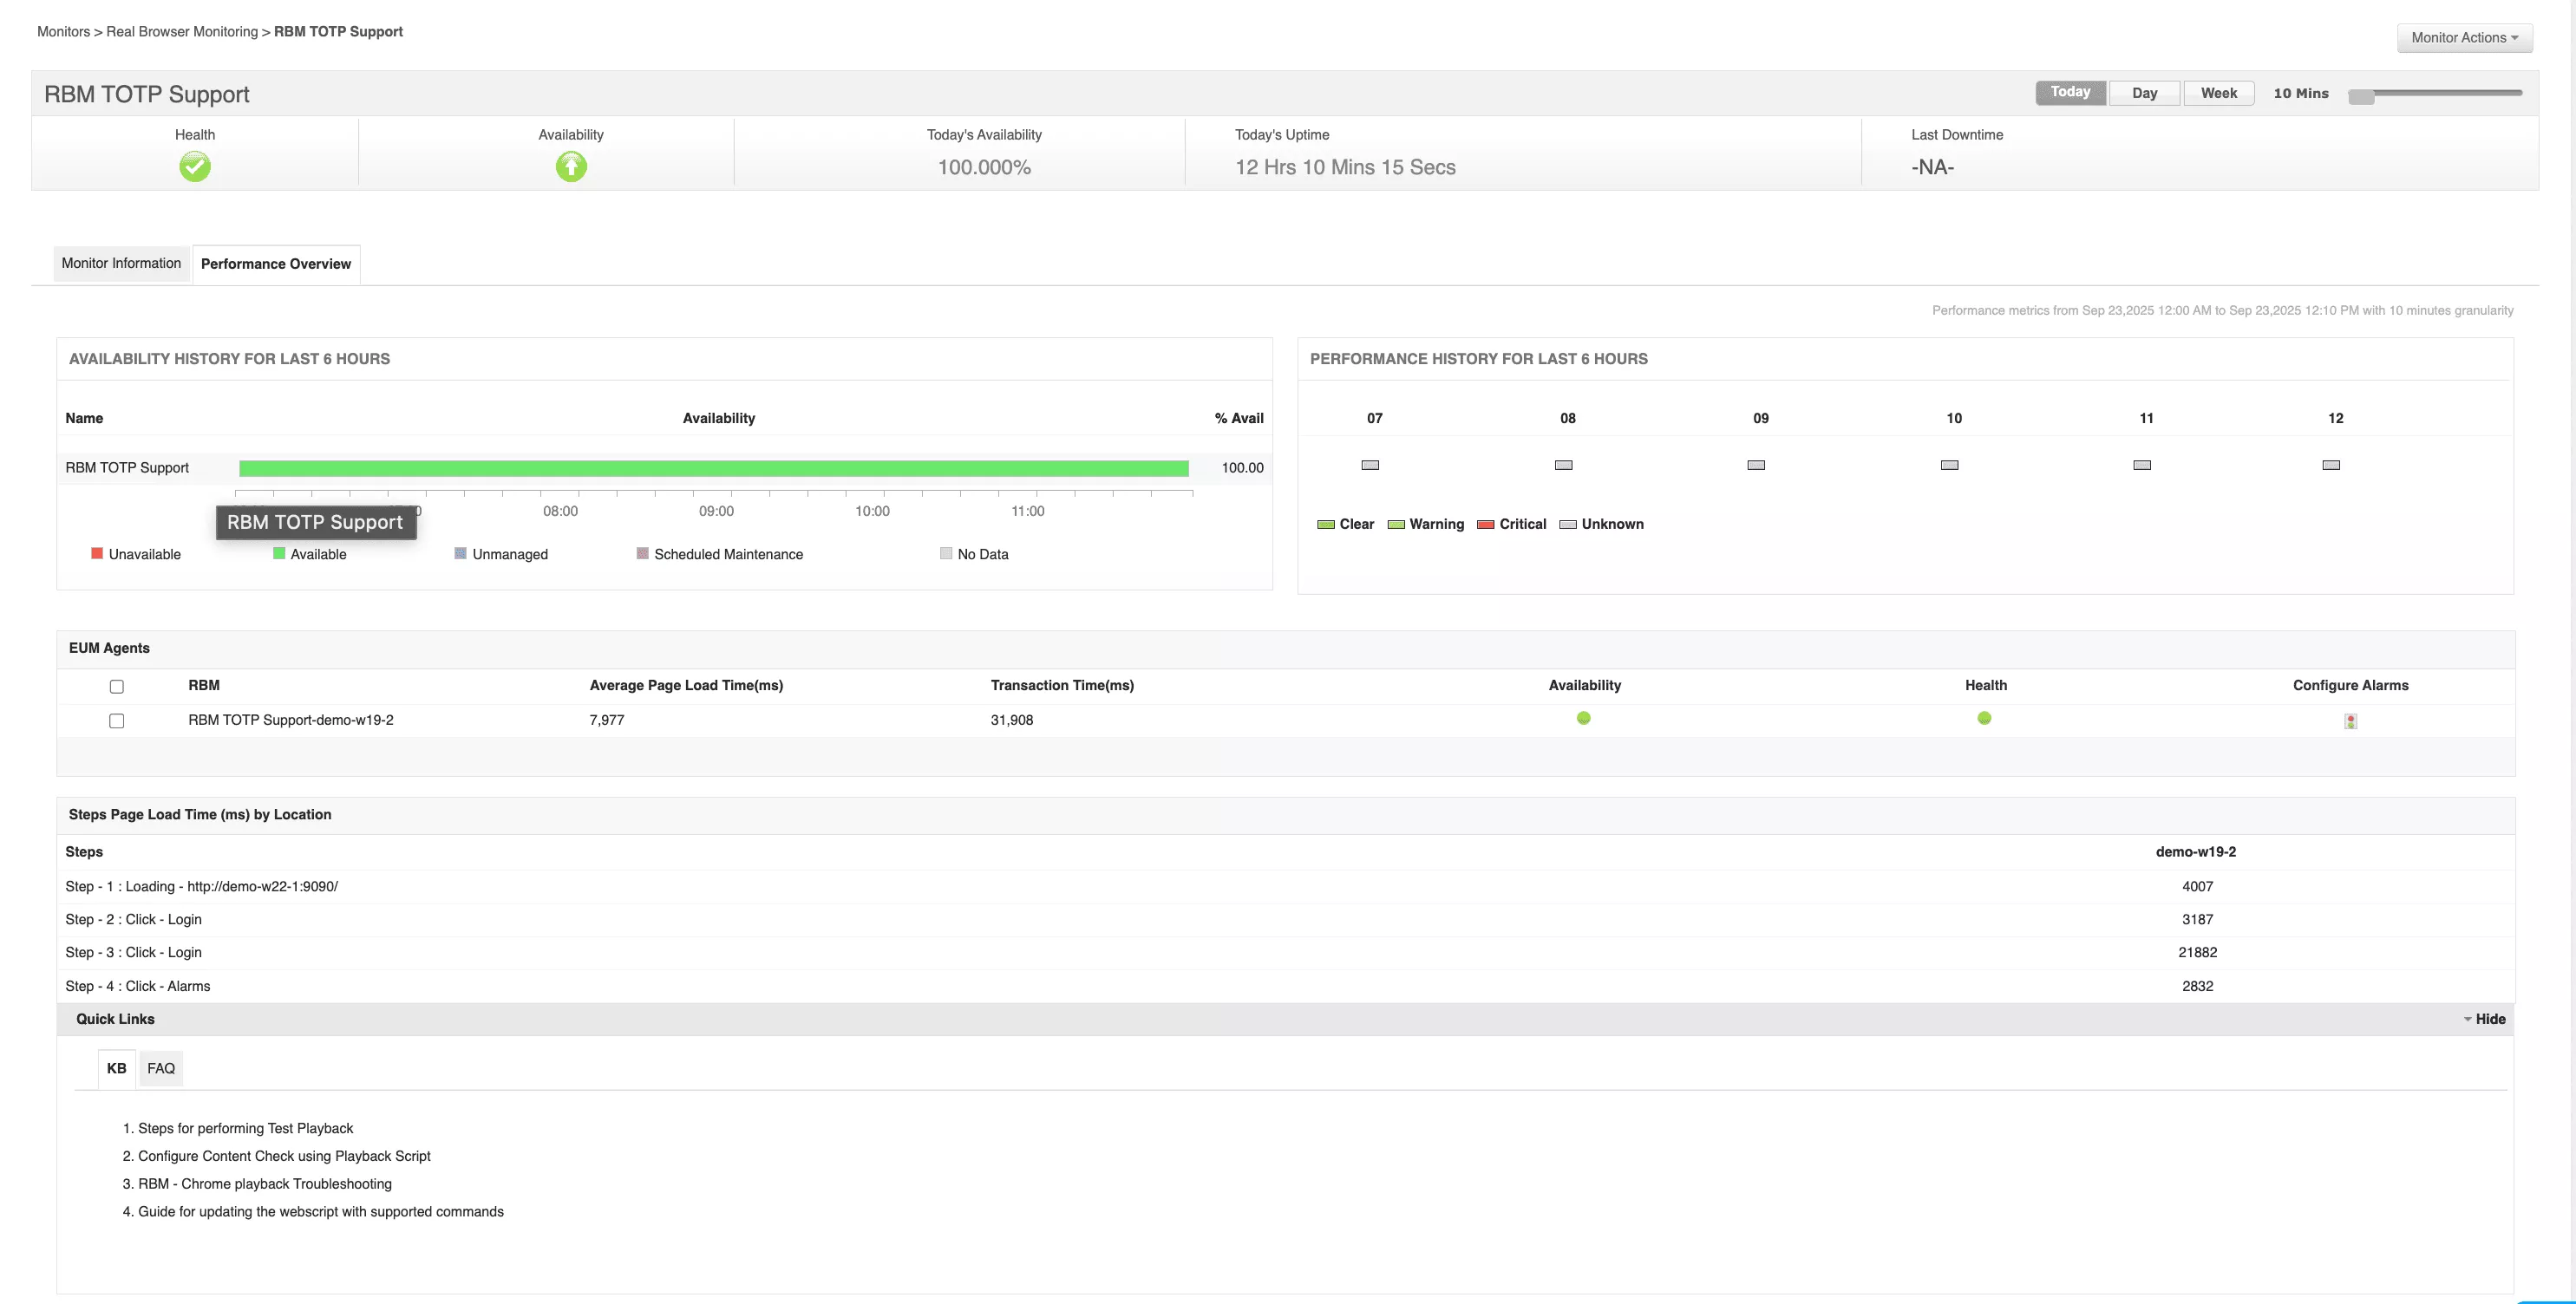
Real User Monitoring (RUM) captures how customers interact with applications in real time, while synthetic monitoring simulates critical journeys (logins, checkouts, API calls) to catch performance degradation in advance. Correlating these front-end insights with backend telemetry accelerates root cause analysis.

Learn more about digital experience monitoring and end user monitoring.
Log analytics:
Application logs (errors, exceptions, access logs) are critical for diagnosing failures. Centralizing logs with metrics and traces creates a unified view of application behavior. This helps isolate issues like failed API calls, authentication errors, or transaction delays quickly and accurately.
Smart alerting:
For applications, alerting must adapt to workload behavior. Dynamic baselines and anomaly detection reduce noise, while contextual grouping ensures teams are alerted only when user-facing services are impacted. For example, an alert tied to API latency spikes should surface only if it impacts active transactions.
Dashboards and reporting:
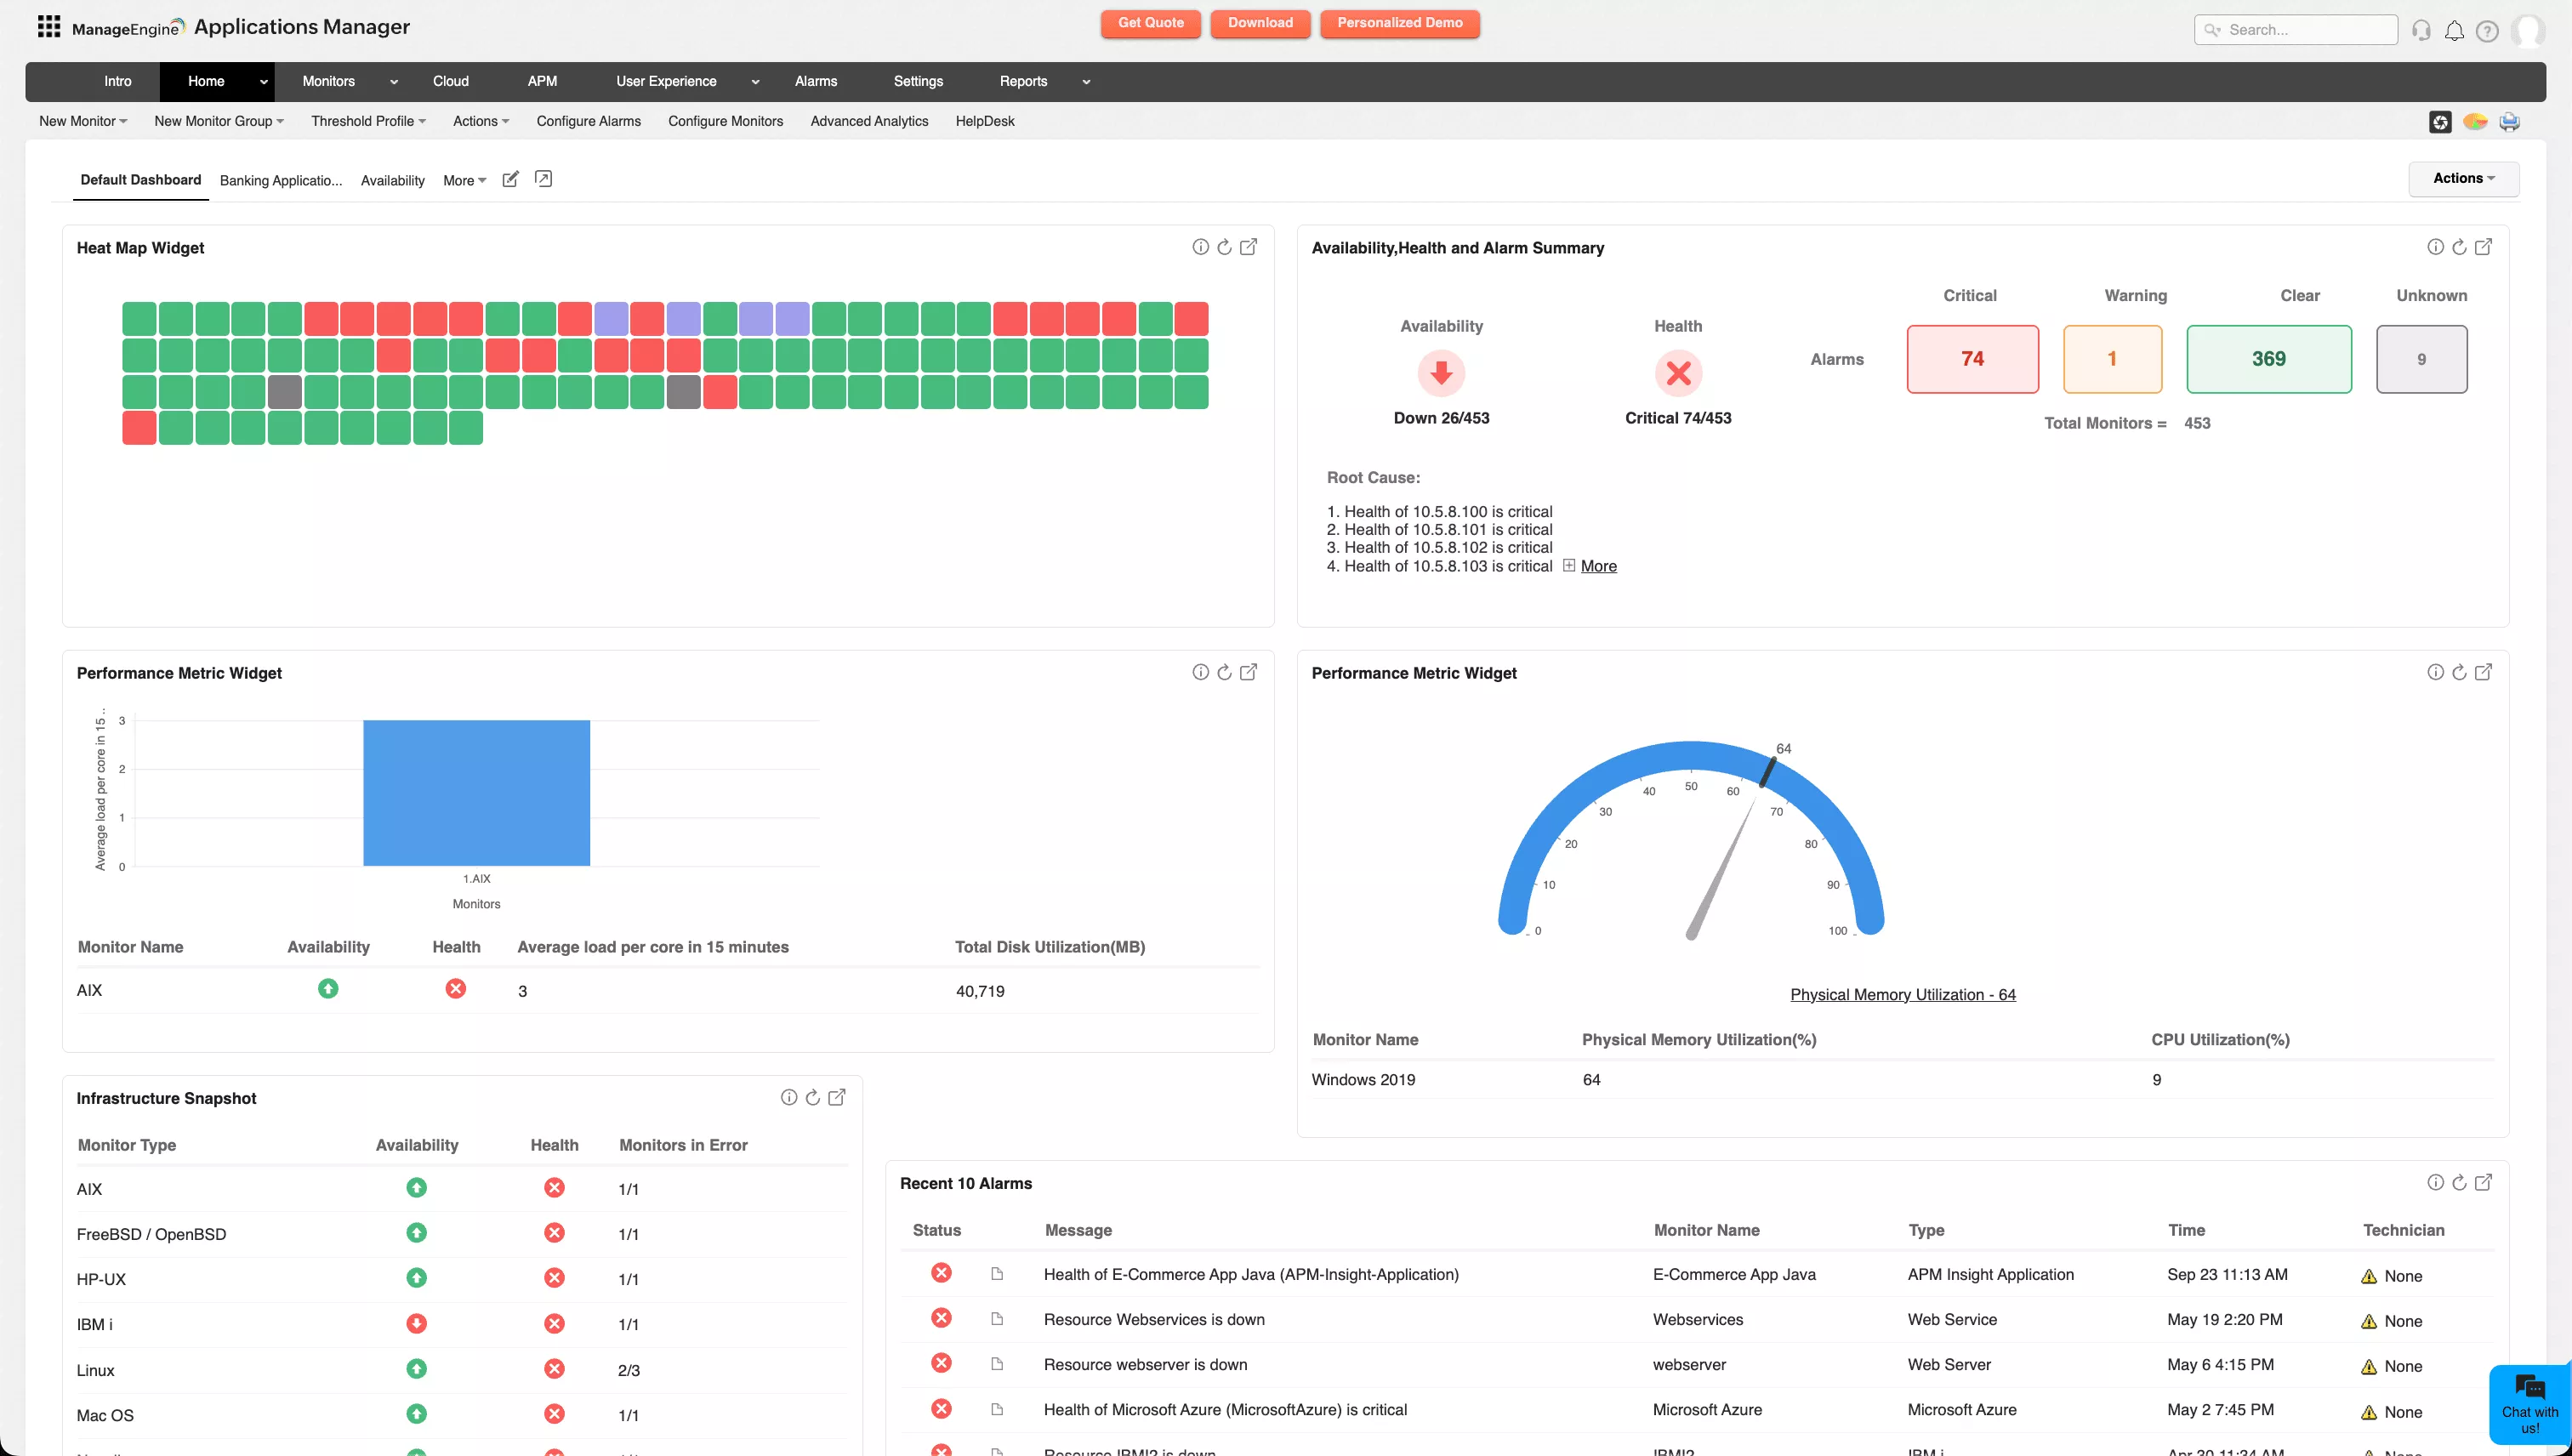
Application-centric dashboards give developers, SREs, and business teams visibility into response times, error rates, and throughput alongside revenue or SLA impact. Trend analysis supports release validation and capacity planning tied directly to application usage.

Cost optimization:
Applications running in the cloud often rely on multiple services, and misconfigurations can inflate costs. Monitoring identifies oversized instances, idle services, or inefficient queries, ensuring applications remain performant without draining budgets.
AI/ML insights:
Machine learning applied to application telemetry predicts performance degradation, correlates cross-service issues, and flags anomalies like memory leaks or sudden query spikes before they affect end users.
Ecosystem integrations:
Integrating application monitoring with CI/CD pipelines, ITSM systems, and collaboration tools ensures that performance insights are fed directly into workflows; speeding up fixes and embedding monitoring into the lifecycle of application delivery.
Market landscape for cloud monitoring tools in 2025
Cloud monitoring solutions typically fall into these categories:
- Native cloud monitoring tools (CloudWatch, Azure Monitor, GCP Monitoring): Solid for single-cloud visibility, but they struggle with multi-cloud and deeper application-level insights.
- APM suites (Dynatrace, Datadog, New Relic, AppDynamics): Excellent for application insights, but come with high cost and operational complexity.
- Infrastructure platforms (Datadog, Prometheus, Grafana): Strong on infrastructure metrics, but need extra integrations to achieve full-stack coverage.
- Log analytics (Splunk, ELK): Great at parsing and correlating events, but lack true end-to-end monitoring.
- Open source (Prometheus, Jaeger, Zipkin): Highly customizable, but require heavy lifting to maintain at scale.
Unified platforms cut down tool and service sprawl, reduce operational overhead, and deliver complete visibility in one place. ManageEngine Applications Manager is a prime example of this approach.
What makes ManageEngine Applications Manager stand out?
The cloud monitoring market is fragmented; native cloud application monitoring tools stay locked to a single provider, APM suites are heavy and expensive, infrastructure-first tools leave gaps, and log or open-source stacks demand extra effort.
Applications Manager steps in as the antidote to this sprawl. It unifies application performance monitoring, infrastructure visibility, cloud service coverage, and cost optimization into one platform.
Key differentiators include:
- Holistic coverage: Monitors 150+ technologies across AWS, Azure, GCP, containers, and serverless platforms, so teams gain visibility across hybrid and multi-cloud environments.
- Unified observability: Correlates app transactions with infrastructure health and user experience in a single console, cutting through noise and silos.
- Advanced diagnostics: Distributed tracing, code-level insights, and deep database monitoring help teams fix inefficiencies before they cascade.
- Cost efficiency: Enterprise-grade capabilities at a competitive price point, avoiding the premium overhead of legacy APM suites.
- Operational intelligence: Intelligent alerts, customizable dashboards, and automated root cause analysis keep monitoring actionable instead of overwhelming.
By consolidating observability, Applications Manager gives enterprises a smarter alternative: a single platform to strengthen reliability, optimize spend, and simplify operations without the burden of managing multiple cloud monitoring tools.
Cloud services monitored by Applications Manager:
How to find a cloud monitoring solution that suits your IT?
When evaluating cloud monitoring tools, enterprises should consider:
- Cloud and application footprint: Assess both current workloads and future expansion. An efficient cloud application monitoring tool should monitor hybrid cloud, multi-cloud setups, and evolving architectures without bolt-on fixes.
- Monitoring depth: Go beyond surface metrics. Look for transaction tracing, real user monitoring, synthetic checks, and log correlation to get true end-to-end visibility.
- Integration needs: Monitoring can’t live in isolation. The right platform should tie into ITSM workflows, DevOps pipelines, and collaboration tools so insights move directly into action.
- Scalability: Enterprise telemetry grows fast. A solution must ingest and analyze massive data volumes without adding latency or breaking under pressure.
- Cost structure: Watch for hidden costs tied to data ingestion or feature unlocks. Transparent licensing aligned with growth keeps budgets predictable.
- Proof of concept: Run pilot tests with your most critical apps. This validates usability, scalability, and impact before making a long-term investment.
Conclusion
Cloud monitoring requires more than isolated dashboards. Unified platforms like ManageEngine Applications Manager eliminate tool sprawl, consolidate data, and link infrastructure, applications, and user experience in one view. Instead of context-switching across dashboards, they show you issues, trace root-causes, and aid you in acting faster.
Applications Manager adapts efficiently to the dynamic cloud infrastructure, turning observability into actionable decisions that improve performance, reliability, and competitive advantage at scale.