Common mistakes when setting up an Azure monitoring tool: How to avoid them

Azure’s flexibility comes with complexity. Effective Azure monitoring is what keeps performance stable, costs predictable, and applications available. Azure Monitor and Application Insights cover the basics, but many teams rely on third-party tools for unified visibility. Still, Azure monitoring setup mistakes often lead to missed alerts, blind spots, and higher bills.
This guide breaks down the most common Azure monitoring mistakes and how to avoid them.
Mistake 1: Over-reliance on default metrics
Default Azure metrics like CPU usage, memory, and IOPS are too shallow to reflect real application health. Teams often assume these metrics provide full visibility, but issues like SQL query deadlocks, API latency, or Service Bus throttling remain hidden.
How to avoid it: Extend Azure monitoring with custom telemetry such as latency, error rates, and transaction volumes. Correlate infrastructure metrics with business KPIs, and use platforms like Applications Manager to tie Azure metrics with application health scores and transaction performance for deeper visibility.

Mistake 2: Inefficient log ingestion and retention
Dumping all diagnostic logs into Azure Log Analytics leads to bloated costs and sluggish queries. On the other hand, sticking with the default 30-day retention fails compliance mandates like HIPAA or PCI DSS.
How to avoid it: Design a tiered logging strategy: Short-term Azure performance troubleshooting in Log Analytics, mid-term storage in Azure Storage, and long-term forwarding to a SIEM like Microsoft Sentinel. Complement your Azure monitoring with Applications Manager’s anomaly detection and base-lining, reducing the need for raw log over-collection.
Mistake 3: Neglecting distributed tracing
Without distributed tracing, latency bottlenecks across Azure Functions, Event Hubs, and App Services remain invisible. Teams end up troubleshooting in fragments instead of mapping the full request flow.
How to avoid it: Adopt OpenTelemetry with W3C Trace Context and aggregate traces in Application Insights. Strengthen Azure monitoring with Applications Manager, which expands trace mapping across Azure, hybrid, and on-prem environments for complete visibility.
Mistake 4: Misconfigured alerts and noise fatigue
Static CPU or memory thresholds create noisy alerts that overwhelm teams, while overly narrow rules miss critical issues. This “alert fatigue” leads to ignored notifications or missed incidents.
How to avoid it: Apply SRE principles: Focus on actionable alerts, dynamic thresholds, and correlation across metrics. Use Applications Manager’s smart alerting to automate escalations and integrate alarms with channels like Slack, Teams, mail and SMS; and unlock actionable Azure monitoring.
Mistake 5: Treating Azure in isolation
Many organizations monitor Azure cloud resources without accounting for hybrid or multi-cloud dependencies. Failures in VPN gateways, DNS, or AWS services may get wrongly attributed to Azure workloads.
How to avoid it: Ensure your Azure cloud monitoring strategy extends beyond Azure Monitor. Applications Manager provides unified visibility across Azure, AWS, GCP, and on-prem infrastructure, helping teams diagnose root causes without silos.

Mistake 6: Underestimating cost governance
Uncontrolled log ingestion, verbose diagnostic settings, and misconfigured DCRs drive up Azure monitoring costs. Teams often realize too late when monitoring bills outpace their value.
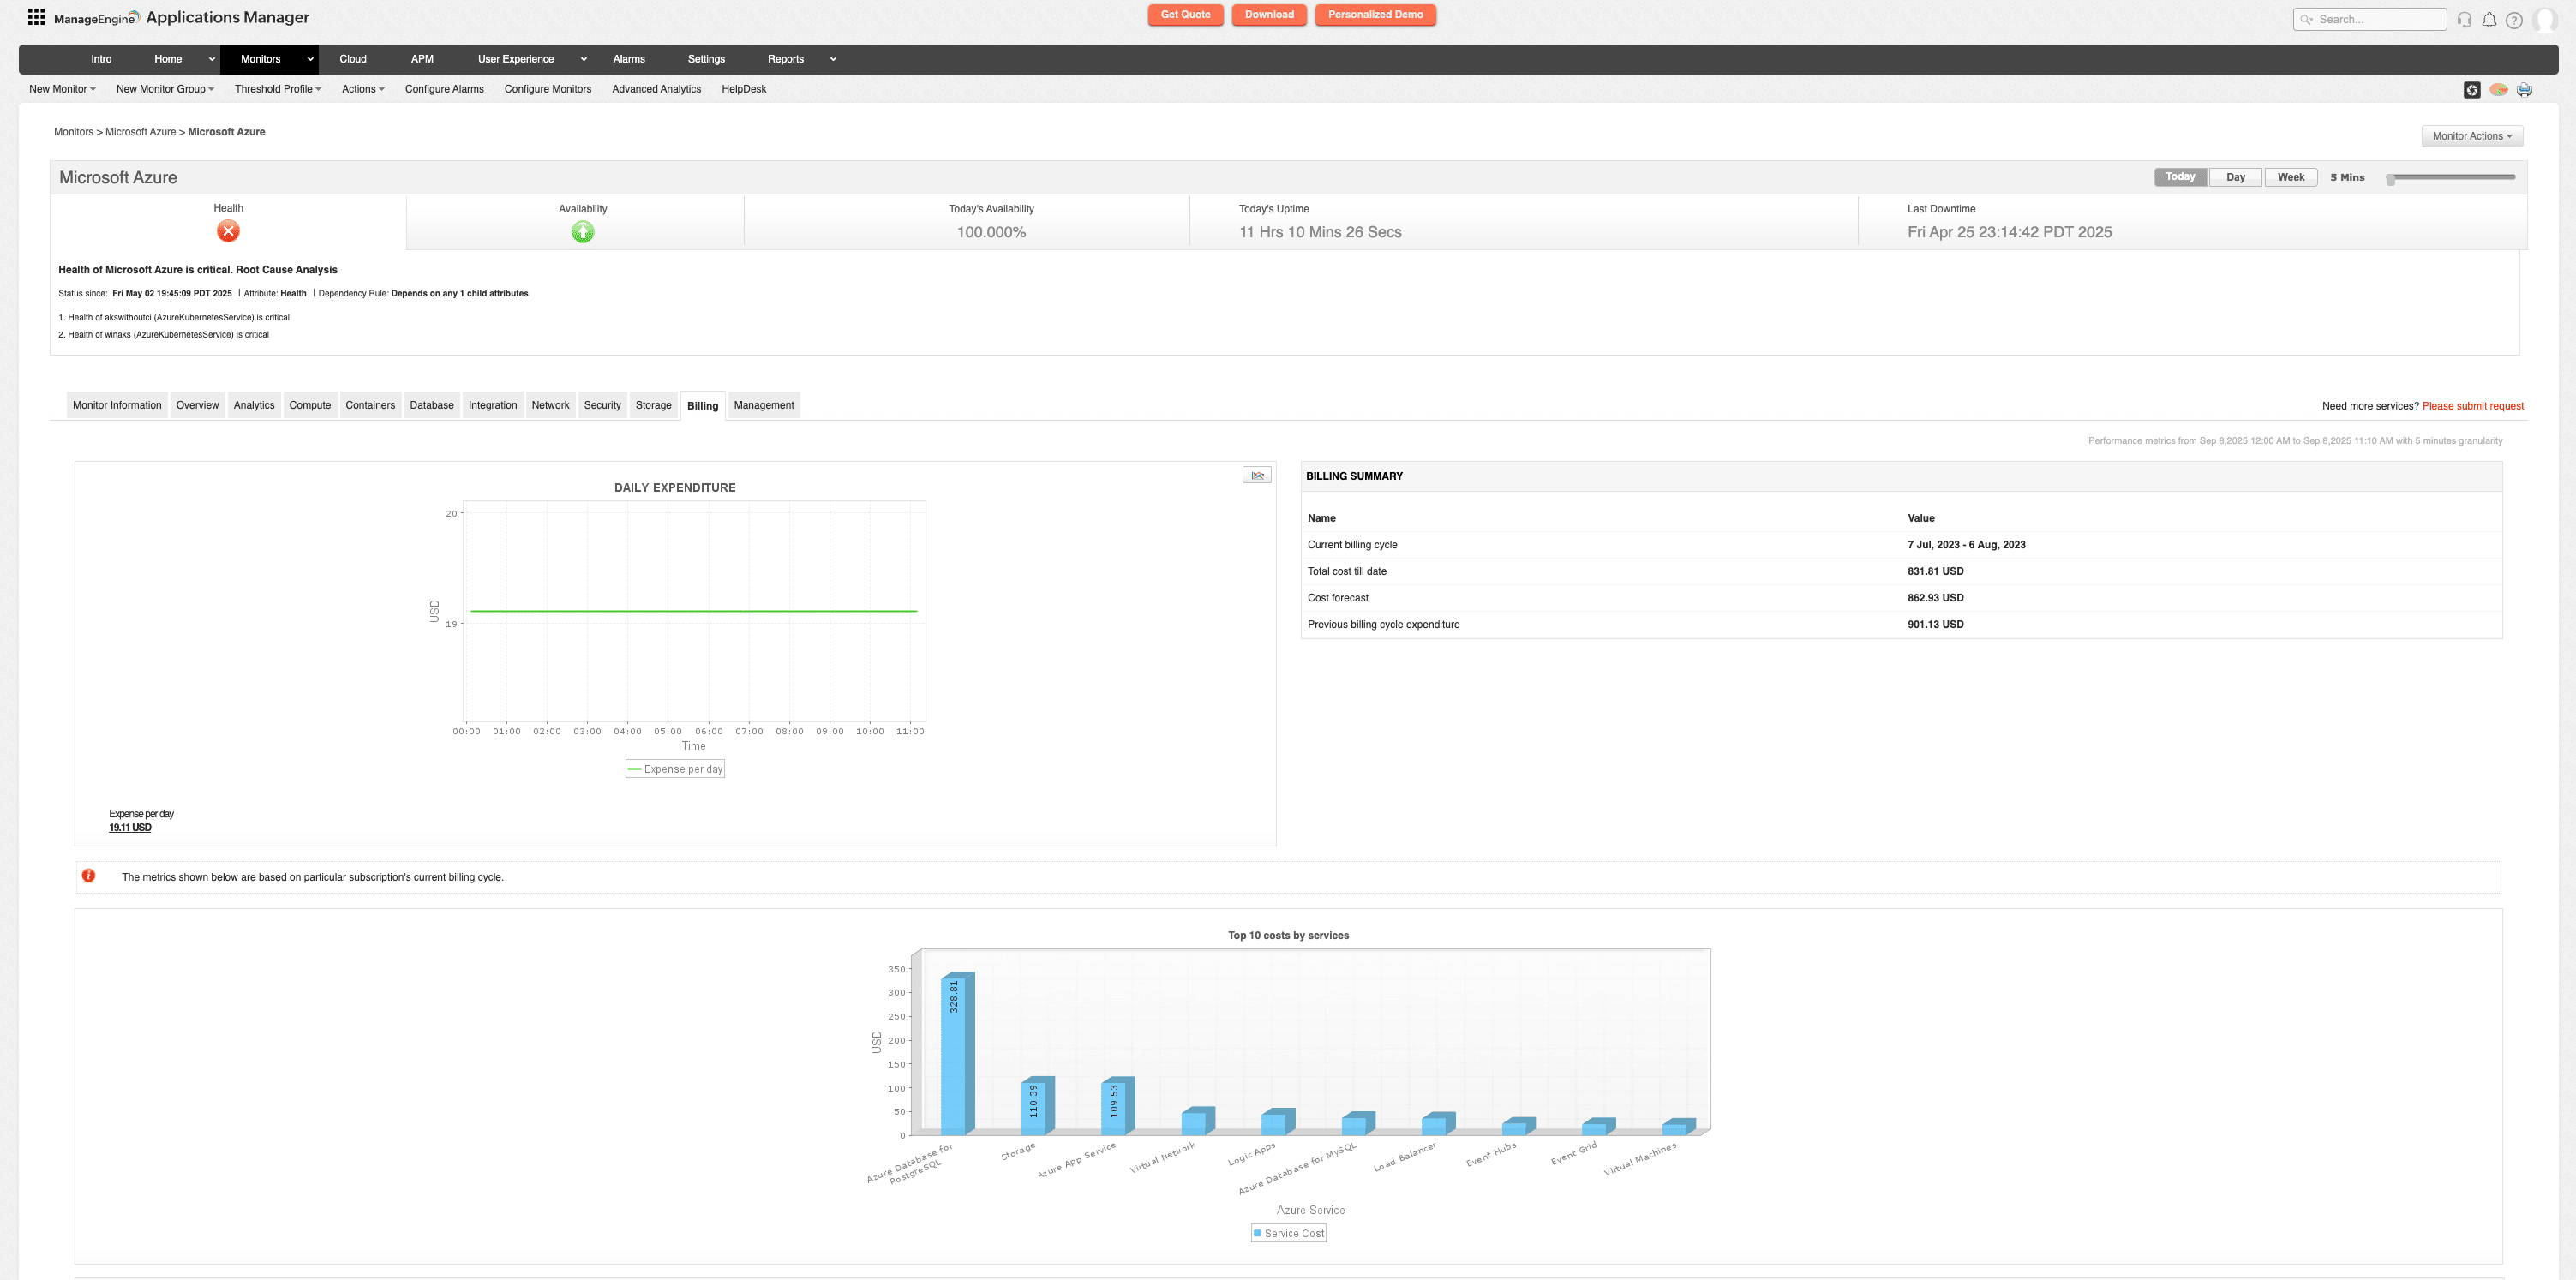
How to avoid it: Monitor observability spend with Azure Cost Management dashboards. Use sampling, collection rules, and cost-benefit analysis to balance visibility with expense. Applications Manager helps by using lightweight collection and chargeback features, making observability financially sustainable.

Mistake 7: Weak security in monitoring pipelines
Log Analytics Workspaces and monitoring dashboards often lack strict RBAC. This exposes sensitive telemetry, which attackers could use to map infrastructure or exploit vulnerabilities.
How to avoid it: Secure Azure monitoring with Zero Trust, encryption, and granular RBAC. Applications Manager strengthens this by adding audit trails, business-unit segregation, and least-privilege enforcement, ensuring monitoring remains compliant and secure.
Mistake 8: Blind spots in multi-region deployments
Azure’s global footprint helps with latency and resiliency, but monitoring each region separately creates fragmented visibility. Failover events or cross-region outages often go unnoticed.
How to avoid it: Centralize Azure monitoring across all regions. Applications Manager correlates data from distributed workloads into one console and adds synthetic monitoring from multiple vantage points to validate fail-overs and latency in real-world conditions.
Mistake 9: Ignoring service-to-service dependencies
Modern Azure applications rely on complex service chains. Without dependency mapping, cascading failures are hard to isolate.
How to avoid it: Go beyond topology maps. Integrate application transaction flows. While Application Insights provides partial maps, Applications Manager builds holistic dependency maps across Azure and external services (like SAP, Oracle), accelerating root cause analysis.
Mistake 10: Overlooking ephemeral workloads
Serverless functions and auto-scaled containers spin up and vanish quickly. Traditional monitors miss these short-lived workloads, creating gaps in observability.
How to avoid it: Enable Azure monitoring tools that auto-detect dynamic workloads. Applications Manager automatically discovers ephemeral resources, establishes baselines, and retains history even after workloads terminate, ensuring continuous coverage.
Mistake 11: Misconfigured Data Collection Rules (DCRs)
DCRs control what telemetry flows into Log Analytics. Too broad, and costs spiral. Too narrow, and you lose critical visibility. Many organizations overlook ongoing audits of these rules.
How to avoid it: Align DCR scope with business-critical metrics and regularly review rules. Applications Manager helps validate DCRs by correlating expected behavior with ingested telemetry, surfacing discrepancies and their cost implications.
Achieve better Azure monitoring with Applications Manager
Avoiding these mistakes turns Azure monitoring from a reactive task into a proactive strategy. ManageEngine Applications Manager unifies Azure and hybrid resources, streamlines alerting, tracks long-term performance, and provides deep APM visibility. It keeps costs controlled, reduces mean time to resolution, and prevents blind spots.
With the right setup, Azure monitoring becomes a business enabler; keeping applications fast, compliant, and reliable at scale.