Monitoring Azure VM performance using Azure Monitor: Optimize VM performance with advanced tools
Azure Virtual Machines (VMs) power everything from web applications to enterprise workloads. Their performance directly impacts user experience, cost, and business continuity. Monitoring Azure VM performance is a core part of Azure monitoring solutions. Without structured Azure VM monitoring setup, bottlenecks and inefficiencies go unnoticed until they cause slowdowns, outages, or unnecessary expenses.
What is Azure Monitor?
Azure Monitor is Microsoft’s native monitoring tool, designed to collect metrics, logs, and traces. It supports Azure VM performance monitoring along with the rest of the Azure services Its real-time alerts, and historical analysis help admin teams shape efficient cloud monitoring strategies.
Why monitor Azure VM performance?
Monitoring Azure VM performance ensures resources are used efficiently and problems are caught early. Effective VM performance monitoring in Azure helps detect CPU spikes, memory leaks, network congestion, and disk bottlenecks before they impact users. It also aligns with Azure cost optimization by reducing waste from underutilized or oversized VMs. Without it, organizations face:
- CPU and memory spikes that slow or crash applications.
- Disk or network bottlenecks that limit data flow and degrade performance.
- Unusual activity that may indicate a security risk.
- Rising costs from over-provisioned or underutilized VMs.
- Proactive monitoring keeps workloads stable, secure, and cost-efficient.
How to monitor Azure VM performance with Azure Monitor
Monitoring Azure Virtual Machines effectively starts with a structured setup inside Azure Monitor. The tool provides both host-level visibility (fabric view of availability, throughput, and boot diagnostics) and guest-level virtual machine insights (memory, processes, and application logs collected through the Log Analytics agent).
Set up Azure VM metrics monitoring to visualize CPU utilization, memory usage, disk I/O, and network throughput in real time. Set up Azure Monitor alerts with defined thresholds to automatically trigger ITSM workflows, enabling faster incident response. Use Azure Monitor dashboards and Log Analytics queries to consolidate and centralize visibility across all virtual machines.
Enable VM insights:
To go deeper, enable VM insights from Azure Monitor. This automatically deploys the Azure Monitor Agent (AMA) and the Dependency agent, giving you performance charts and dependency maps. If deployment fails, you can manually add these extensions under the VM’s extensions. Configure Data Collection Rules (DCRs) to define the KPIs you need in your Log Analytics workspace. Within minutes, you’ll gain end-to-end visibility across processes, dependencies, and resource utilization.
Configure metrics and alerts:
Begin by enabling diagnostic settings on the VM to send metrics and logs to Azure Monitor or Log Analytics. Track CPU utilization, memory usage, disk I/O, and network traffic; each of which directly impacts VM health. For instance, CPU usage above 80% for more than five minutes typically indicates an overloaded workload.
Memory availability below 15% suggests leaks or under-provisioning. High disk latency signals storage throughput issues, while elevated network latency can point to bandwidth saturation. Define thresholds for each metric and configure alerts that trigger through email, SMS, Teams, or ITSM tools. This ensures that spikes are detected in real time, allowing administrators to act before performance degrades.
Build dashboards and reports:
Custom dashboards in Azure Monitor or Workbooks consolidate these metrics across multiple VMs, making patterns easier to interpret. For example, tracking CPU and memory trends alongside disk queue depth helps determine whether application slowdowns are caused by compute or storage limitations.
These dashboards become essential during troubleshooting, letting IT teams correlate host metrics with guest processes. Reports can also highlight underutilized VMs, supporting cost optimization by resizing or cutting off idle resources.
Integrate with other services:
Deeper troubleshooting often requires moving beyond surface-level telemetry. By connecting Azure Monitor with Log Analytics, administrators can query event logs, process data, and security signals to isolate the root cause of anomalies. Integration with Application Insights extends this further, linking VM performance with application-level telemetry to uncover whether slowdowns stem from the infrastructure or the code. This combination provides true end-to-end Azure VM monitoring, reducing mean time to detect (MTTD) and mean time to resolve (MTTR).
Troubleshooting with Azure Monitor:
- For CPU utilization, validate host-level spikes, then drill into guest metrics with Log Analytics to identify heavy processes. Remedies may include scaling VM size, adding instances, or optimizing application code.
- For memory usage, watch for low available memory and rising commit charge. Use KQL queries to trace memory leaks or poorly optimized services. Scaling to a memory-optimized SKU or tuning workloads helps restore stability.
- For disk I/O bottlenecks, compare host metrics like throughput and latency with guest process logs to see what’s generating load. Moving to Premium SSDs or reworking queries is often the resolution path.
By combining real-time alerts, historical dashboards, and advanced integrations, Azure Monitor for VMs provides a strong foundation for proactive monitoring. Yet for enterprises with hybrid or multi-cloud environments, pairing it with platforms like ManageEngine Applications Manager brings additional benefits such as unified dashboards, anomaly detection, and automated remediation.
Best practices for monitoring Azure VM performance
Effective Azure VM performance monitoring goes beyond enabling a few counters. The goal is to establish observability that is both proactive and cost-efficient.
Setting thresholds based on baselines is the first step. Instead of relying on generic values (like CPU greater than 80%), IT teams should analyze historical data from Azure Monitor’s Metric Explorer to determine what “normal” looks like for their workloads. This reduces false positives and ensures alerts align with performance deviations.

Define baselines for Azure VM performance metrics like Disk greater than 80% utilization. Use KQL queries in Azure Monitor for custom log insights. For enterprises, extend Azure VM monitoring solutions with platforms like Applications Manager to unify hybrid workloads.
Advanced analytics should be layered on top of metrics. Using KQL queries in Log Analytics enables administrators to detect recurring process crashes, memory leaks, or disk latency spikes. Enabling anomaly detection across VM metrics allows Azure Monitor to highlight unusual patterns that may precede outages, such as sudden memory growth or gradual increases in I/O latency. By embedding this into monitoring workflows, organizations can detect and resolve subtle performance issues before users notice them.

Unifying monitoring across platforms is critical because enterprises rarely operate in a single environment. Workloads often span Azure, AWS, Oracle Cloud, and other providers, with some components still running on-premises. While Azure Monitor extends visibility to hybrid and on-premises workloads through Application Insights, ManageEngine Applications Manager goes further by consolidating performance data across multiple cloud vendors and on-premises systems.
Its multi-vendor support brings infrastructure metrics, application telemetry, and business service KPIs into a single view, reducing the need to switch between dashboards and improving troubleshooting with correlated insights across cloud, on-premises, and multi-cloud setups.
How Applications Manager enhances Azure VM monitoring
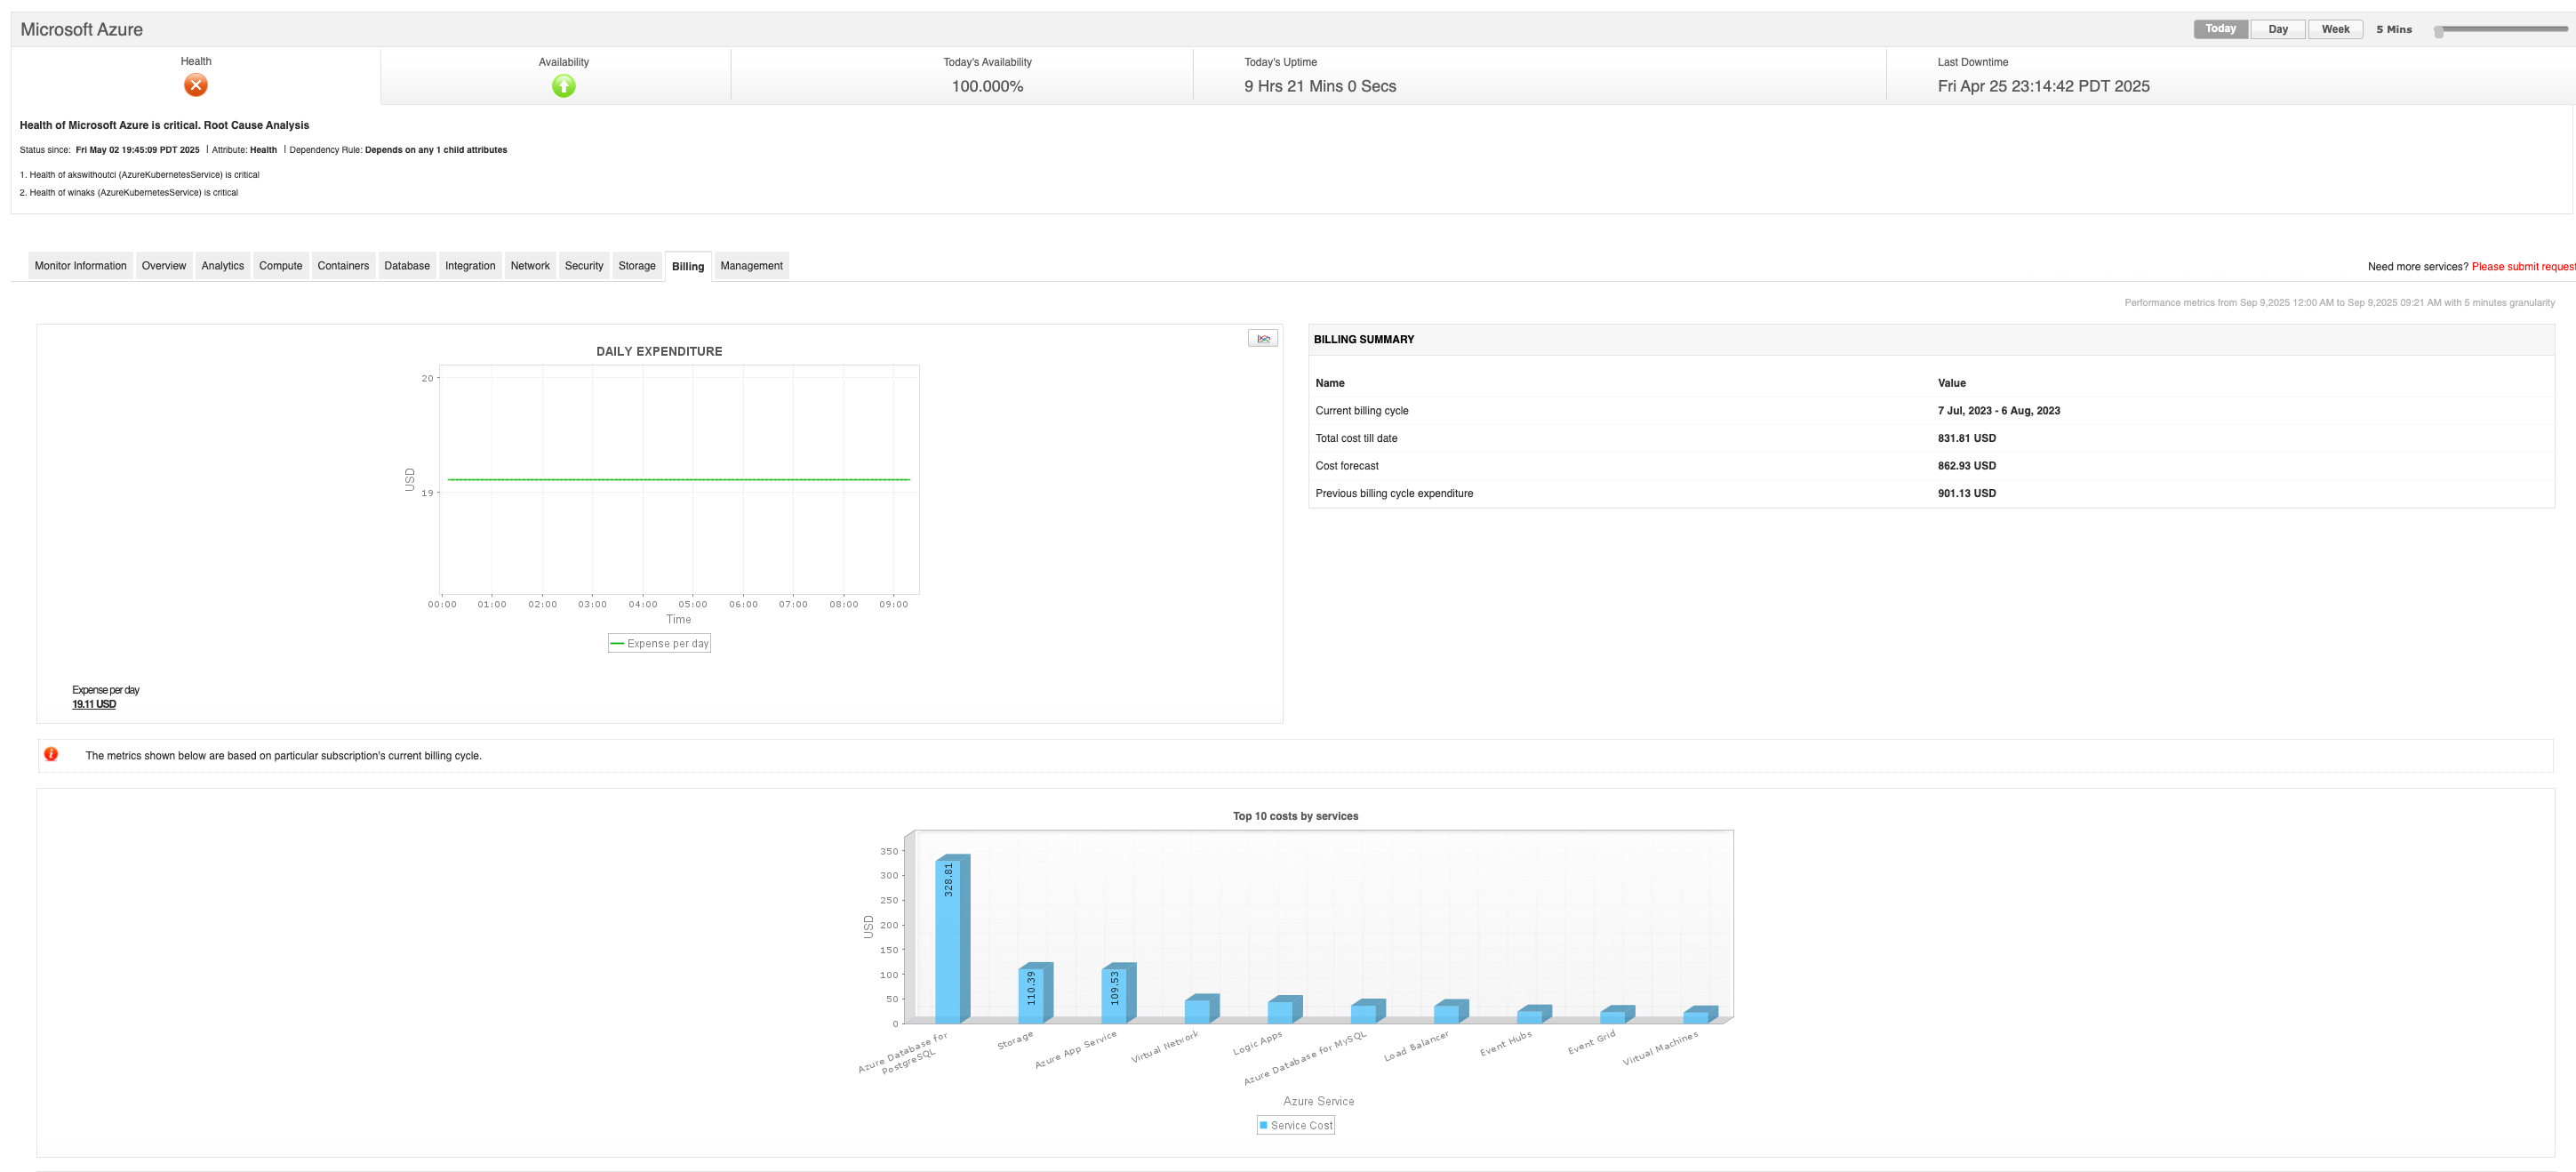
While Azure Monitor provides strong native monitoring for Azure resources, correlating performance data across multiple clouds and services often requires custom queries or manual effort.This is where ManageEngine Applications Manager adds value. It unifies Azure monitoring data with metrics from on-premises, cloud, and hybrid environments into a single console, eliminating silos and enhancing Azure VM performance optimization.
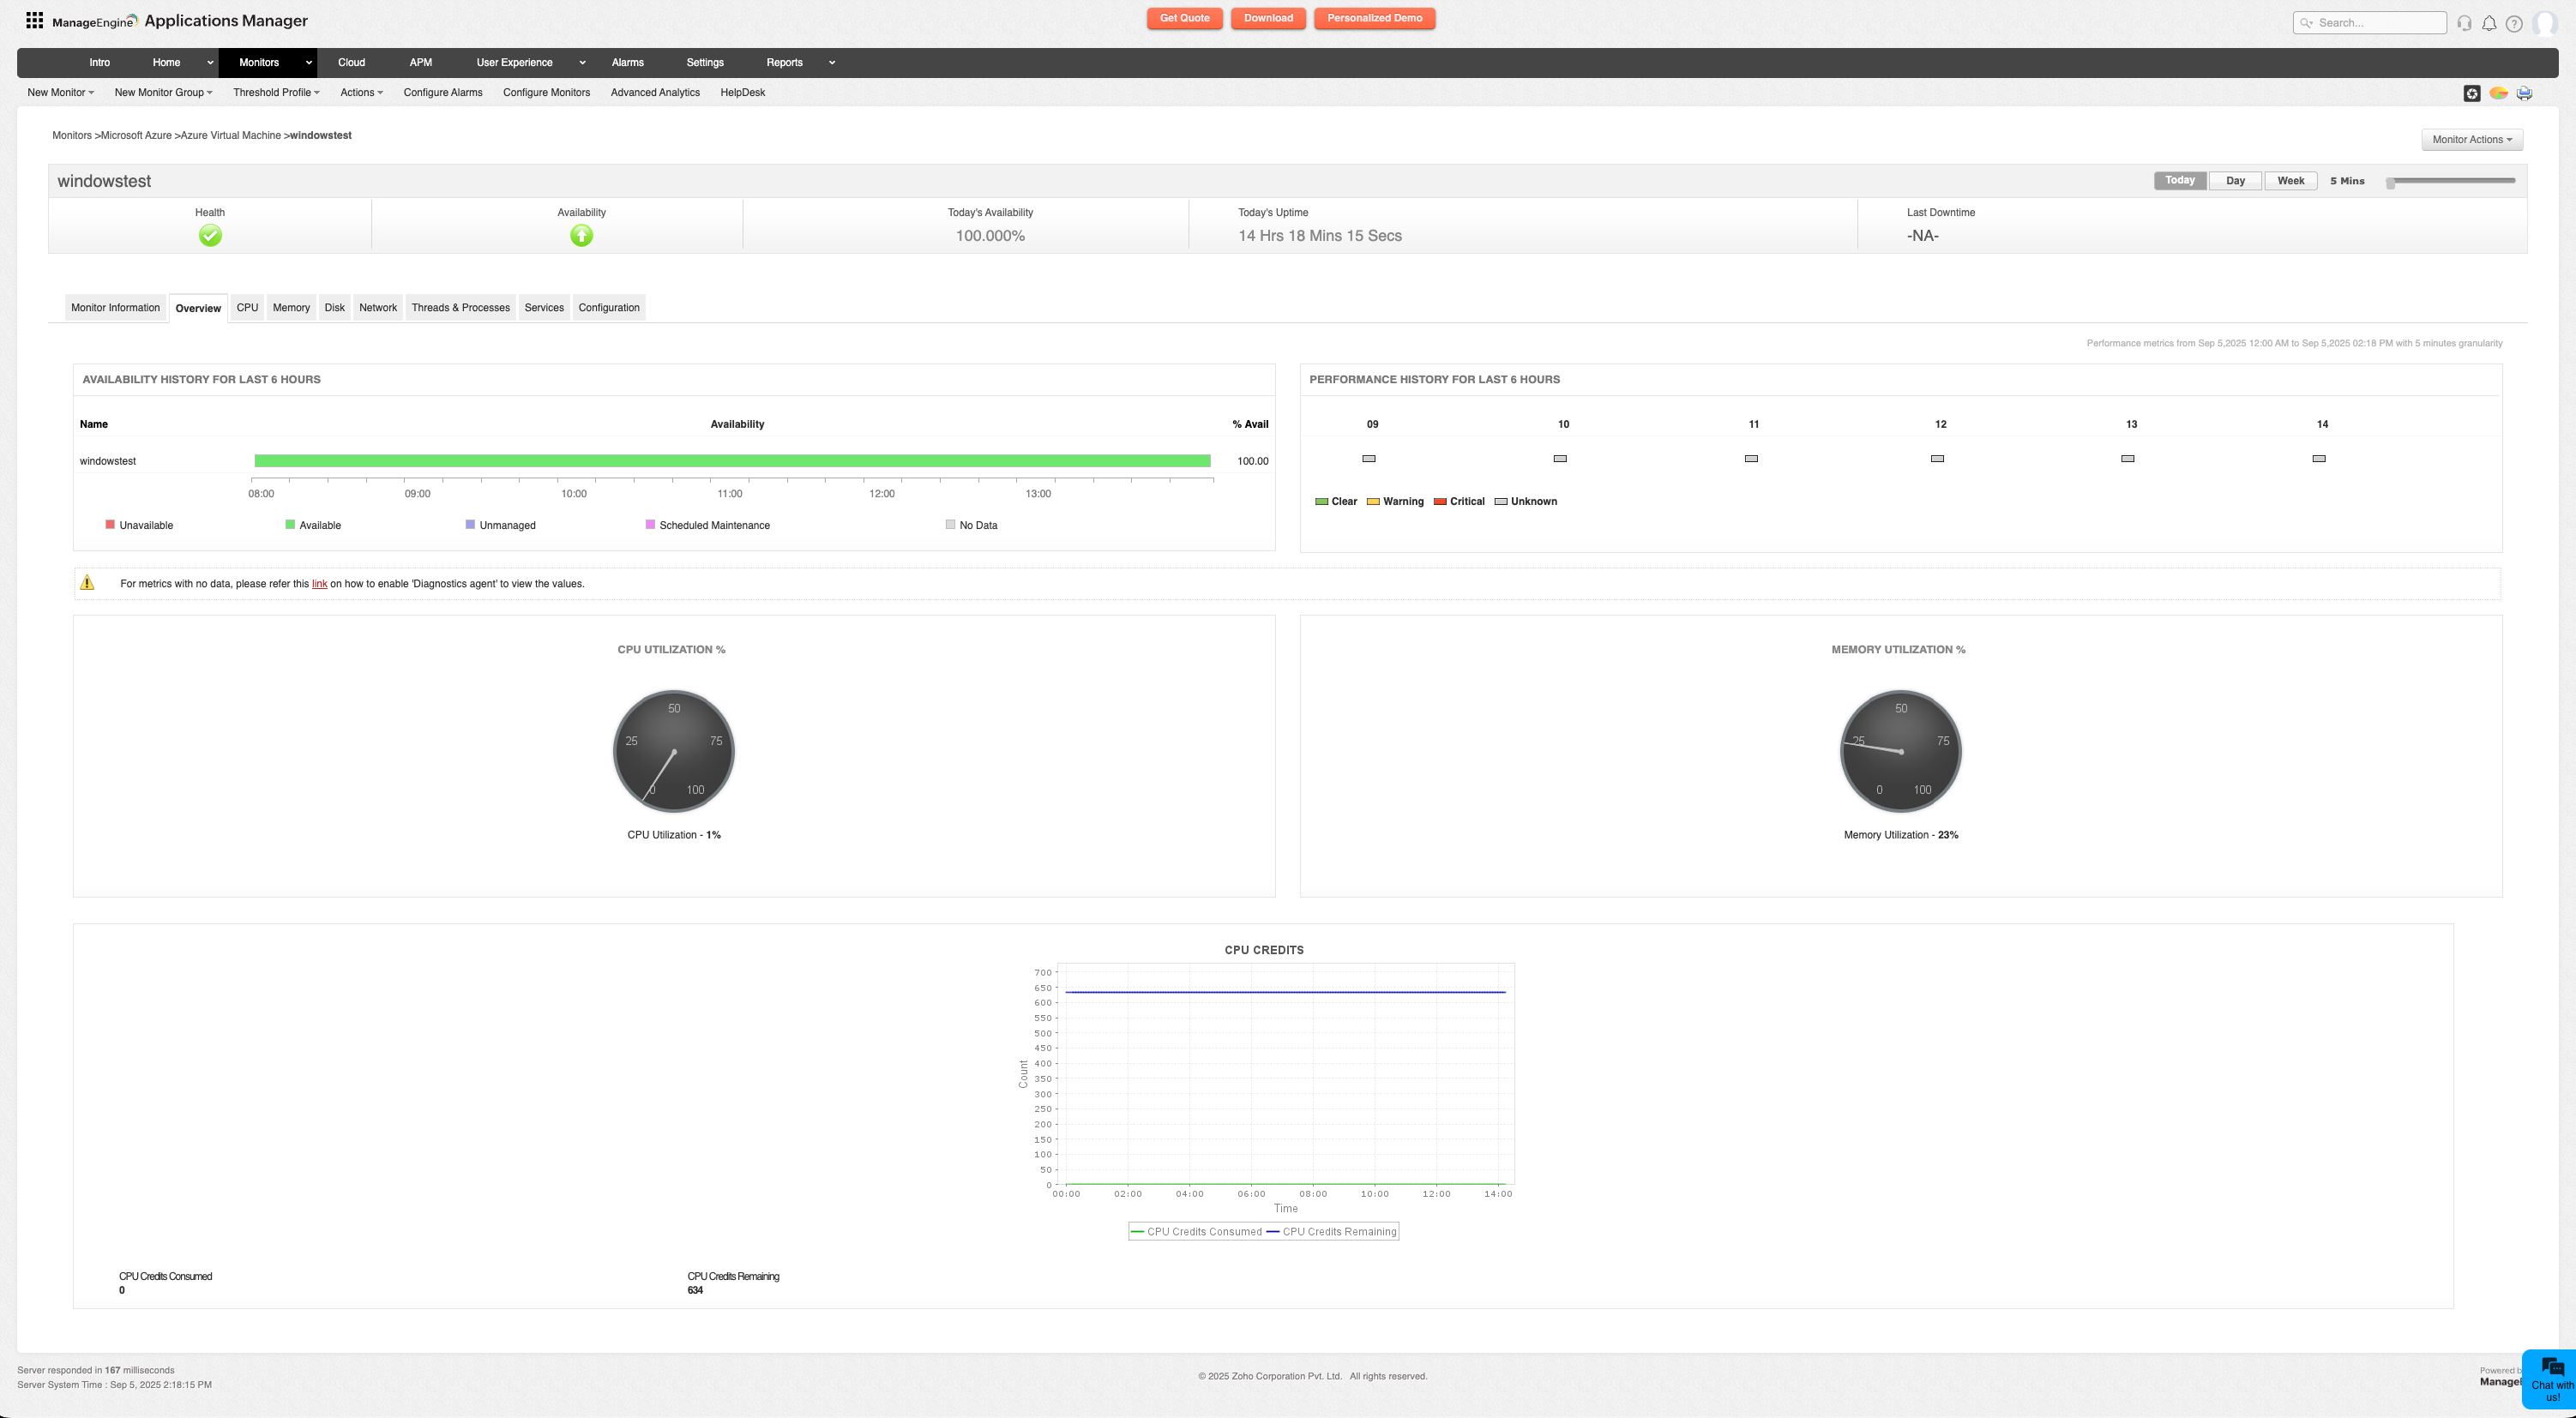
With customizable dashboards, IT teams can quickly visualize CPU, memory, disk, and network usage alongside application-level insights. Its AI-driven anomaly detection and forecasting help teams act on critical performance deviations before they escalate, while automated workflows remediate issues like restarting a failed service or resizing a VM; without manual effort.

Unlike Azure Monitor, which is primarily telemetry-driven, Applications Manager offers contextual visibility by mapping performance issues to the right layer (VM, dependent database, middleware, or external service) accelerating root cause analysis. It also provides actionable rightsizing and cost optimization recommendations, helping Azure workloads stay reliable, efficient, and aligned with overall IT operations.

Summing up
Monitoring Azure VM performance is key to keeping workloads efficient, secure, and cost-effective. Azure Monitor provides robust native tools for metrics, logs, and alerting, while solutions like ManageEngine Applications Manager extend visibility and automation across hybrid environments. Together, they give IT teams the insight and control needed to keep critical applications running smoothly.