Introduction to AWS monitoring: Why it matters and how to do it right
When you run workloads on AWS, one thing quickly becomes clear: the cloud doesn’t automatically manage itself. Resources scale up and down, services talk to each other across regions, and costs fluctuate with every transaction. Without monitoring, it’s almost impossible to know whether your infrastructure is running efficiently, if your applications are behaving as expected, or if something suspicious is happening in your account.
Monitoring in AWS is not just about dashboards and alerts—it’s about having the confidence that your architecture is resilient, cost-effective, and secure. In this article, we’ll look at why AWS monitoring matters, the tools you can use (native and third-party), and best practices to get it right.
Why AWS monitoring matters for performance, cost, and security?
1. Keeping performance on track
Cloud-native applications are built on layers of compute, storage, and networking services. Each has its own limits and quirks. If you don’t monitor them, bottlenecks often show up at the worst possible time—like when user traffic spikes or a batch job runs longer than expected.
2. Keeping costs manageable
AWS’s pay-as-you-go model is a double-edged sword. It gives you flexibility but also makes it easy to overspend if something is misconfigured. Idle EC2 instances, runaway Lambda invocations, or excessive data transfers can cause unexpected bills. Monitoring is what connects the dots between usage and spend.
3. Ensuring account security
Security in AWS isn’t only about IAM policies and encryption. It’s also about visibility. Unauthorized access, unusual API calls, or sudden spikes in resource creation can all signal trouble. Monitoring ensures you don’t miss these signs.
4. Supporting better decisions
Finally, monitoring isn’t just reactive. The insights you gather guide architectural choices. Maybe you realize Aurora is a better fit than RDS, or that caching layers need to be added. Monitoring tells you what’s working and what isn’t.
How do I monitor my AWS infrastructure?
AWS gives you a solid toolbox for infrastructure monitoring. But effective monitoring means pulling those pieces together in a systematic way rather than just glancing at a few metrics.
Core monitoring services to rely on
- Amazon CloudWatch – The native telemetry backbone. Provides metrics, logs, alarms, and dashboards across nearly all AWS services. Custom metrics can extend visibility into application-specific behaviors.
- AWS X-Ray – Enables distributed tracing, invaluable in microservice or serverless environments where bottlenecks may occur in downstream service calls.
- AWS CloudTrail – Records API activity across the account, foundational for auditing and governance.
- AWS Trusted Advisor – Supplies recommendations across cost, security, fault tolerance, and performance dimensions.
- Amazon DevOps Guru – Applies machine learning to detect anomalies and surface contextual insights.
When to use third-party AWS monitoring tools
Native tools are powerful, but they can be fragmented across accounts and regions. This is where third-party monitoring platforms like ManageEngine Applications Manager add value by:
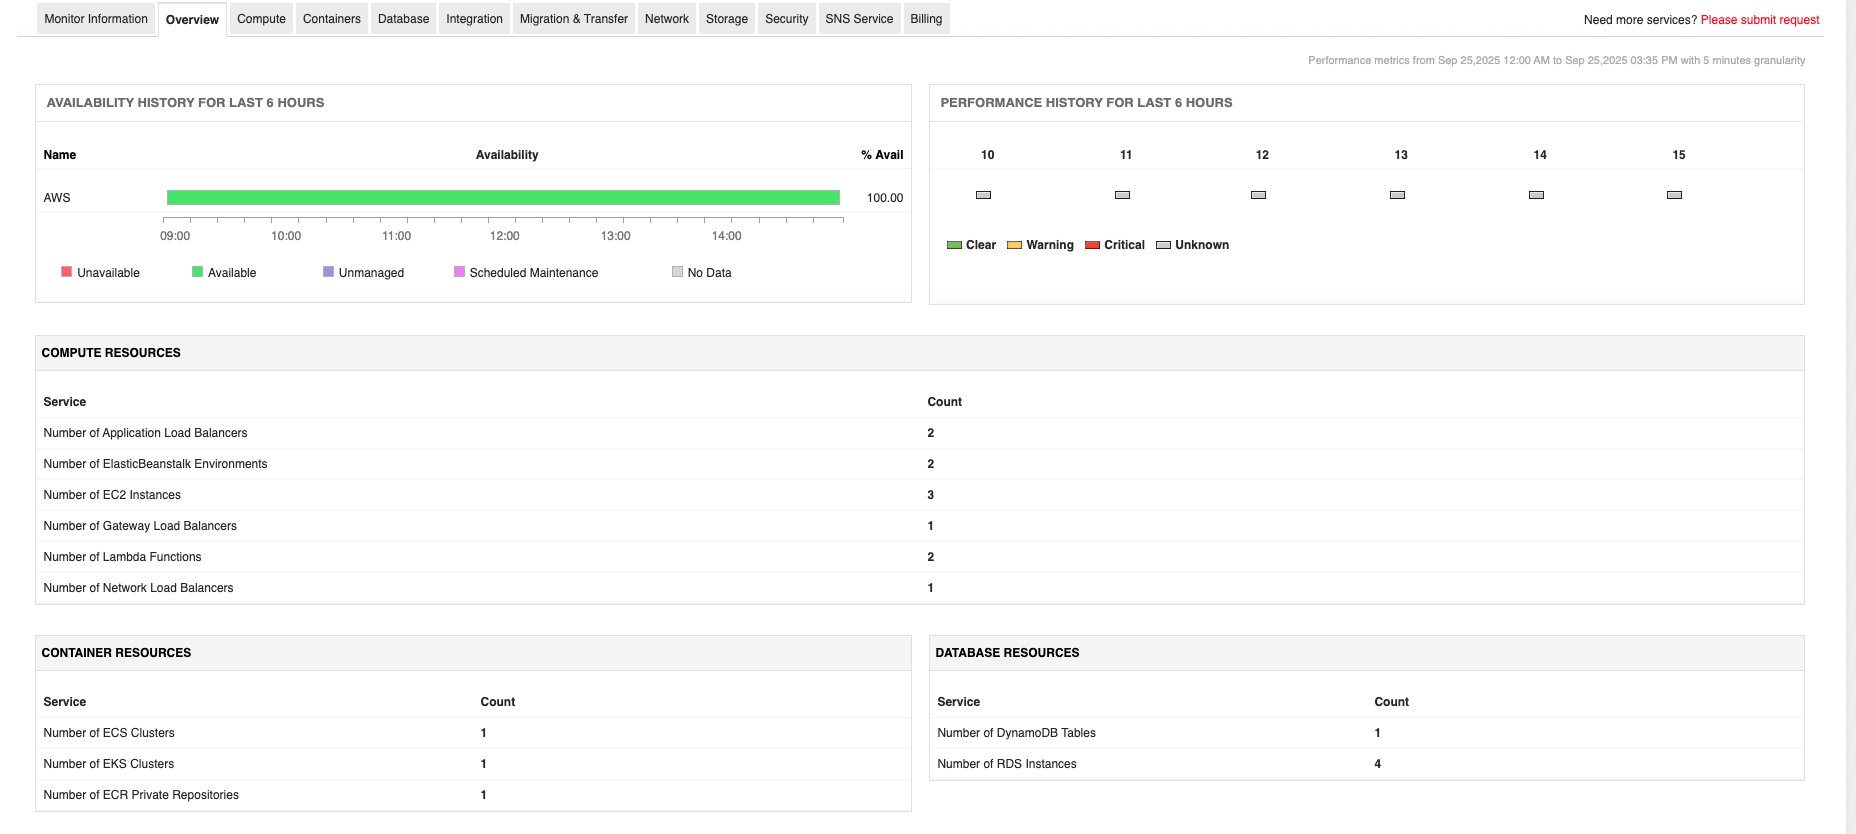
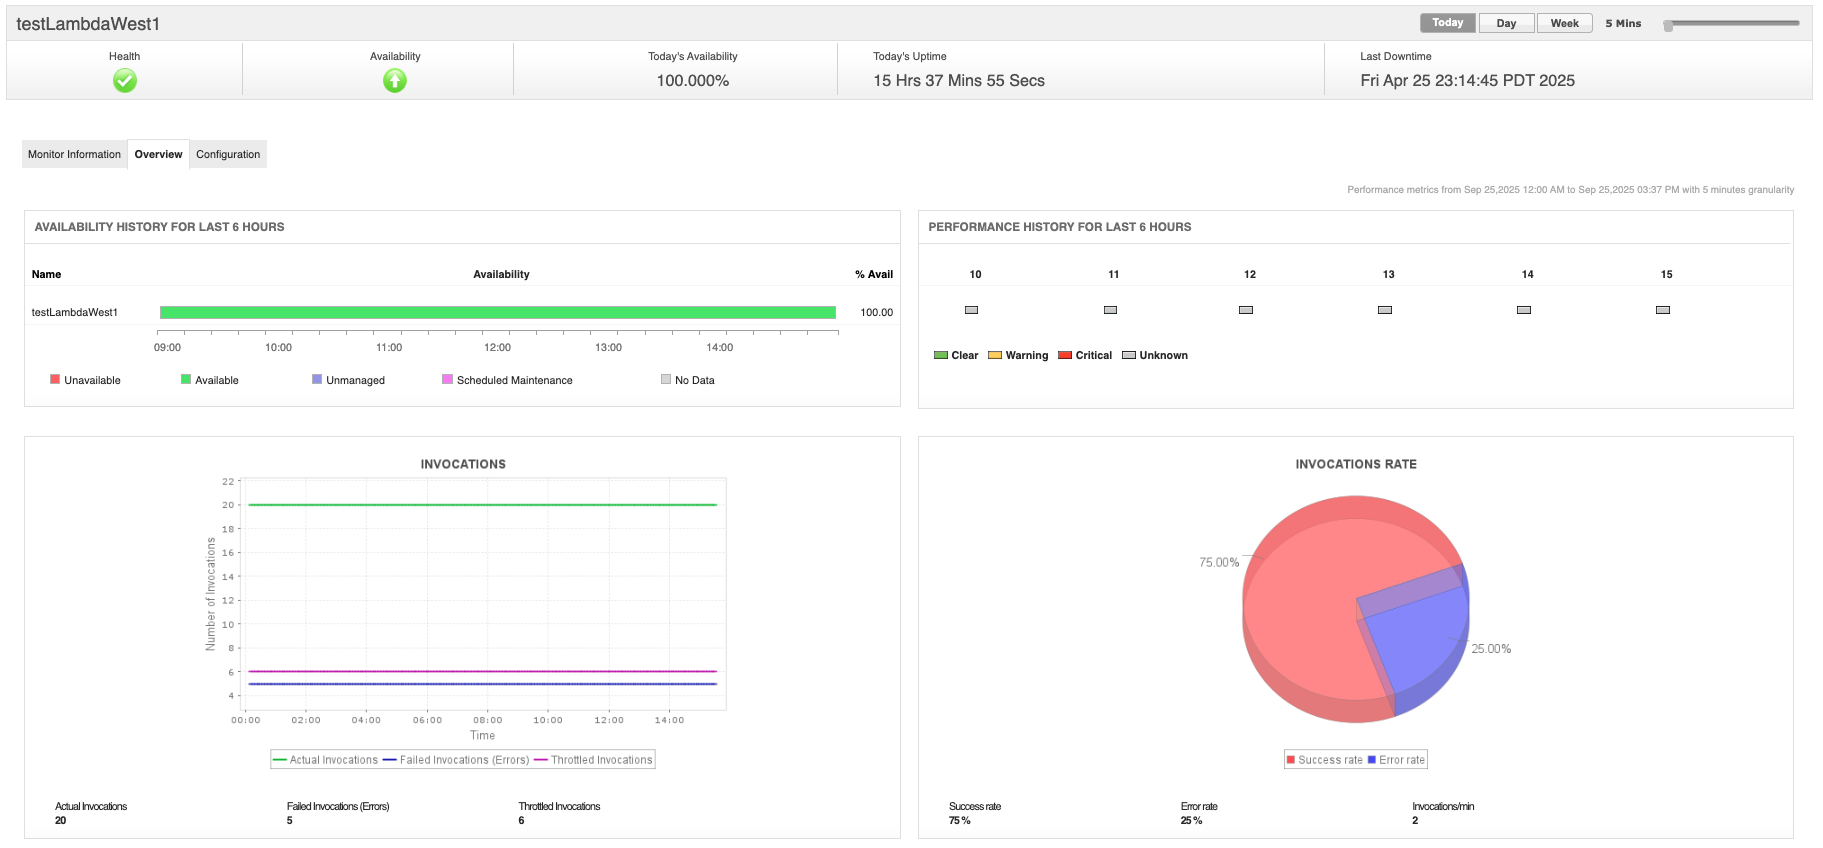
- Consolidating AWS metrics, traces, and logs into a single dashboard.
- Monitoring hybrid and multi-cloud environments alongside AWS.
- Offering prebuilt AWS monitoring templates for faster setup.
- Providing AI-driven anomaly detection and root cause analysis
Observability dimensions to watch for
Infrastructure monitoring must evaluate the following primary layers:
- Compute layer – Includes EC2 instances, ECS/EKS containers, and Lambda functions. Key metrics include CPU utilization, memory pressure (via CloudWatch Agent), request concurrency, and execution duration.
- Data layer – Covers RDS, DynamoDB, ElastiCache, and S3. Metrics focus on query latency, read/write throughput, cache hit ratios, and storage IOPS.
- Network layer – Involves VPC traffic, NAT gateways, load balancers, and inter-region transfers. Metrics of interest include request counts, latency, dropped packets, and throttling events.
Best practices for AWS monitoring
- Set baselines – Establish normal ranges for latency, throughput, and error rates to detect deviations.
- Instrument at multiple layers – Combine infrastructure metrics with application telemetry for context.
- Centralize monitoring – Use CloudWatch cross-account observability or third-party aggregators to unify data from multiple AWS accounts and regions.
- Automate responses – Configure alarms to trigger auto-scaling, Lambda remediations, or incident workflows.
How do I monitor unauthorized activity in my AWS account?
Unauthorized activity often manifests subtly before causing major impact. Billing anomalies, suspicious API calls, or privilege escalations are common early indicators. A cost spike, a login from an unusual location, or an IAM role change can all hint at unauthorized activity. Monitoring must therefore include financial signals alongside operational and security telemetry.
Common threat scenarios
- Compromised access keys: Attackers may use leaked keys to launch resources for cryptocurrency mining, leading to sudden billing surges.
- Privilege escalation: Misconfigured IAM roles or policies may grant users broader permissions than intended.
- Anomalous console logins: Unusual geolocations or times of access may indicate compromised credentials.
- Unintended resource proliferation: Rapid provisioning of compute or storage resources can signal abuse.
Core monitoring services to help you stay ahead
- AWS CloudTrail: Enables auditing of all API calls. Critical for identifying unexpected activity, such as IAM role modifications or S3 bucket policy changes.
- Amazon GuardDuty: Performs continuous threat detection using machine learning and threat intelligence feeds. Detects anomalies such as unusual API invocations or reconnaissance activity.
- AWS Config: Monitors configuration drift, ensuring security baselines are enforced.
- AWS Security Hub: Aggregates and prioritizes security findings across services.
Monitoring billing as a security signal
Unusual billing activity is often the first red flag. Monitoring costs is not just about financial discipline—it’s also about detecting security issues and requires a combination of real-time and historical analysis.
- AWS billing and cost explorer: Provides granular breakdown of service spend.
- AWS budgets: Allows thresholds and alerts on cost or usage, sending notifications when anomalies occur.
- CloudWatch integration: Billing metrics can be ingested into CloudWatch, enabling alarms and automated remediation (e.g., disabling compromised IAM keys).
- Third-party monitoring solutions: Many organizations extend AWS billing telemetry into platforms such as ManageEngine Applications Manager for richer anomaly detection.
Leveraging the dual force of infrastructure and security monitoring
One of the most common mistakes is treating infrastructure monitoring and security monitoring as separate activities. A sudden spike in EC2 usage, for example, could either mean your application is scaling correctly or that someone is abusing your account. Without cross-correlation, it’s hard to tell the difference, for which, the two disciplines must be unified:
- Cross-correlation: A sudden billing spike (cost anomaly) should be correlated with CloudTrail activity (e.g., new EC2 instances launched in unexpected regions).
- Unified dashboards: CloudWatch dashboards or third-party observability platforms should combine system metrics, application traces, and security alerts.
- Incident automation: EventBridge rules can automatically invoke Lambda functions to quarantine resources, revoke credentials, or alert security operations.
Advanced considerations beyond the basics
For large organizations, monitoring gets even more complex. Multi-account setups require centralized visibility, often via AWS organizations or third-party observability tools. Hybrid environments add another layer, requiring integration between on-prem and cloud telemetry.
Machine learning is also increasingly part of the equation. Services like Amazon DevOps Guru and GuardDuty use it to reduce reliance on static thresholds and to surface subtle anomalies that human operators might miss.
Compliance is another consideration. If you operate in a regulated industry, logs and metrics must be stored securely and be auditable. Many teams stream data from CloudTrail and CloudWatch into external SIEM systems for this reason.
Take control of AWS monitoring with Applications Manager
Monitoring in AWS isn’t just about metrics and alerts—it’s about confidence. Confidence that your workloads will scale when they need to, that costs won’t spiral out of control, and that security threats won’t go unnoticed. AWS gives you excellent native tools, but stitching them together into a single, seamless picture can be a challenge.
That’s where a unified AWS monitoring solution like ManageEngine Applications Manager comes in. By consolidating infrastructure metrics, application traces, billing visibility, and security alerts into one platform, Applications Manager helps teams shift from reacting to issues to proactively managing performance and cost. The result is better resilience, tighter cost control, and fewer sleepless nights.


To see how this works in practice, you can download a free 30-day trial or schedule a personalized demo of Applications Manager today.