Monitoring PHP applications with Applications Manager: An overview
Working with PHP offers flexibility and speed, but it also comes with unpredictability. While it remains a reliable choice for building dynamic web applications, performance issues can quietly creep in. A slow query, memory spike, or missed error in production can escalate into application downtime and leave users with an unpleasant experience.
That’s why PHP monitoring matters. By tracking performance in real time, you can detect issues early, understand what’s slowing your application down, and prevent those small problems from becoming costly ones.
Why PHP monitoring matters
Most of us don’t know something’s wrong with an application until it slows down or crashes. And when that happens, it’s rarely obvious where the issue lies. It could be your PHP code, a database query that’s gone rogue, a resource limit on the server, or an unresponsive external API.
Without visibility, troubleshooting becomes guesswork. PHP monitoring changes that by giving you the context you need to:
- Spot performance anomalies before they snowball into downtime.
- Identify and address production issues quickly.
- Avoid reactive fixes triggered by user complaints.
The more visibility you have, the more confidently you can build and run stable PHP applications, especially in production environments where testing doesn’t always catch every issue.
What to monitor in your PHP applications
Monitoring isn’t just about knowing whether your application is up; it’s about knowing how it’s performing. That means going deeper than health checks and focusing on:
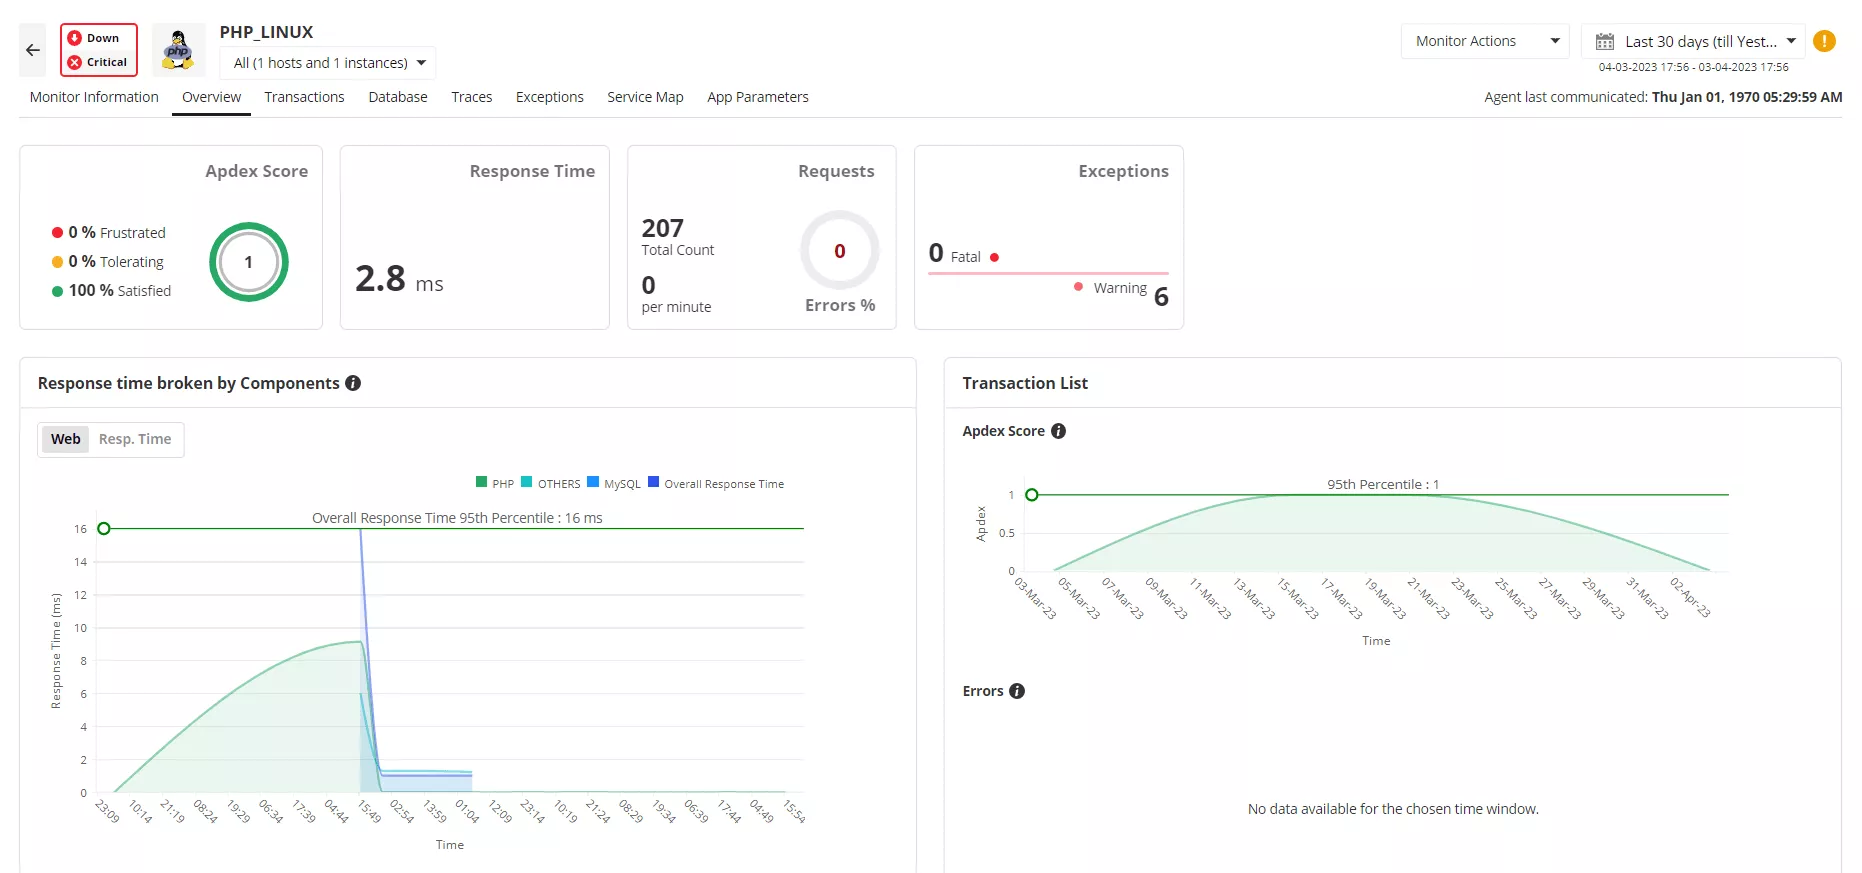
- Response time breakdowns: Understand not just how long a request took, but where response time was spent (i.e., database, backend logic, external calls).
- Throughput: Measure the volume of requests your application handles, especially under load.
- Error tracking: Stay ahead of errors, whether notice, warning, or fatal. Act before your users are impacted.
- Queries: Slow database queries can affect application performance, downgrading the end-user experience. Monitoring query activity and health can help you correlate application health with database performance.
- Resource consumption: Identify scripts that are consuming too much CPU or memory and fix erroneous algorithms.
- Function profiling: Pinpoint slow methods or functions that drag down performance.
Tracking these metrics helps streamline debugging and builds a stronger foundation for scaling and optimization.
How Applications Manager supports PHP performance monitoring
ManageEngine Applications Manager's PHP monitoring goes beyond surface-level metrics. It helps teams make sense of PHP performance in the broader context of their application ecosystem. Whether you're managing simple scripts or complex applications built on frameworks, you get full-stack visibility that connects the dots.

Here's what Applications Manager delivers:
Code-level diagnostics:
- Pinpoints slow PHP function calls, methods, and database queries.
- Tracks internal function calls and time taken for each.
Transaction tracing:
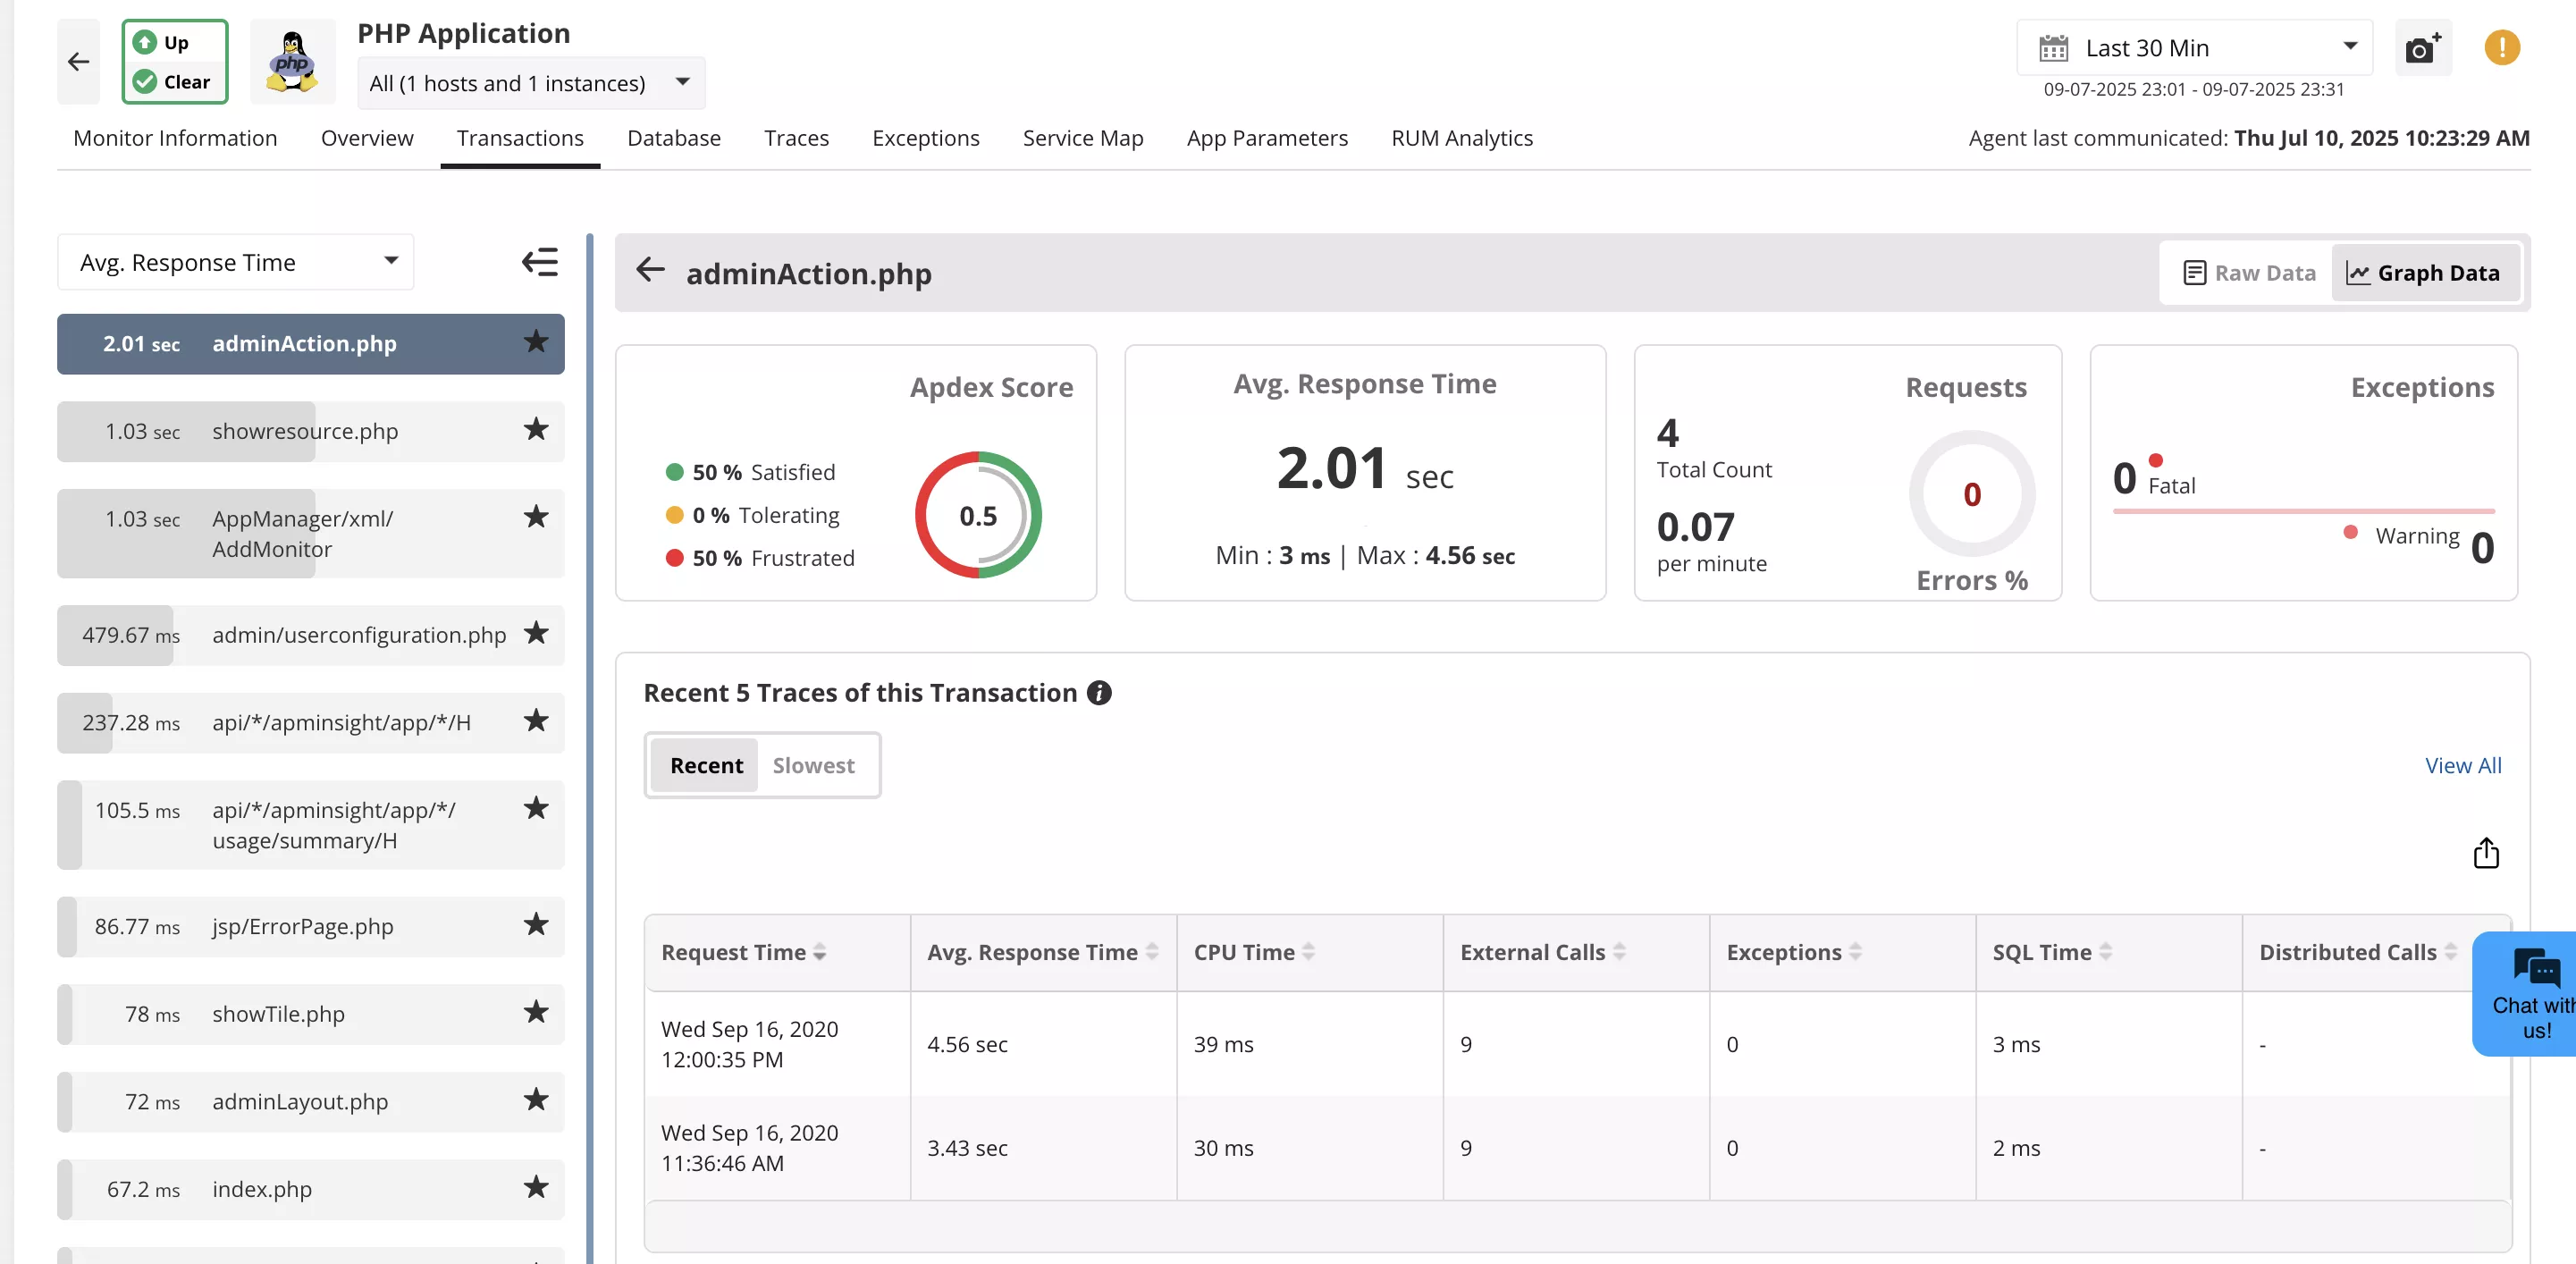
- Traces transactions end-to-end, from browser to backend.
- Highlights response time, throughput, and errors.
- Drills down to find performance bottlenecks in specific transactions.
Database query monitoring:
- Monitors database calls made by PHP applications.
- Helps identify slow SQL queries.
Error tracking:
- Captures unhandled exceptions and error messages.
- Shows stack traces for easier debugging.
Web transaction snapshots:
- Offers snapshots of slow transactions, showing function call stack and time breakdown.
- Includes HTTP parameters and custom metrics.
Thread profiling:
- Takes periodic snapshots of threads to identify methods consuming CPU/memory.
- Helps optimize resource usage.
Integrated real user monitoring:
- Provides a comprehensive picture of PHP application performance by combining backend metrics with real user interactions.
- Compares webpage metrics across different timeframes and geographies to detect trends and problem areas.
- Instantly captures and debugs frontend JS errors to reduce user friction.

You can also build dashboards crafted to your team’s priorities and correlate PHP performance with server health and external dependencies.
Instead of switching between tools or skimming logs, trust one place to monitor everything that matters.
The real value of visibility
Effective monitoring doesn’t just reduce downtime; it helps you prevent it. When you have access to real-time performance insights, you can be proactive while managing your application infrastructure. This leads to faster resolution time, smarter optimization, fewer recurring issues, and better use of resources.
Whether it is handling a traffic spike or resolving a slowdown, knowing what’s happening behind the scenes helps you stay in control.
Building efficient PHP applications in real-world environments
PHP applications don't operate in isolation. They often depend on databases, APIs, and other services to function. These interdependencies can introduce complexity to your IT ecosystem. That’s why your monitoring solution needs to cover more than just the PHP layer.
Applications Manager helps you monitor the entire stack—code, infrastructure, and user experience—so you can respond quickly and confidently when issues arise. No guesswork, no interface switching, just the information you need to keep your application running the way it’s meant to. You can monitor PHP applications hosted on Azure, AWS, Kubernetes, Docker, and GCP, and also seamlessly manage auto scaling for your cloud applications.
Applications Manager supports popular web servers like IIS, Apache2, Nginx, or any FPM-based web server and a variety of databases like Redis, Memcached, Oracle, MySQL, MSSQL, Cassandra, and more. You can also configure applications for popular PHP frameworks such as Laravel and Symfony.