Why MySQL databases slow down over time and how to prevent it
Modern applications rely heavily on MySQL databases for reliability and scalability. But as workloads grow, it’s common to notice gradual performance degradation, queries that once took milliseconds now take seconds, replication starts lagging, and CPU utilization creeps higher than usual.
So, why does this happen? And what can you do to stop MySQL from slowing down as your data scales?

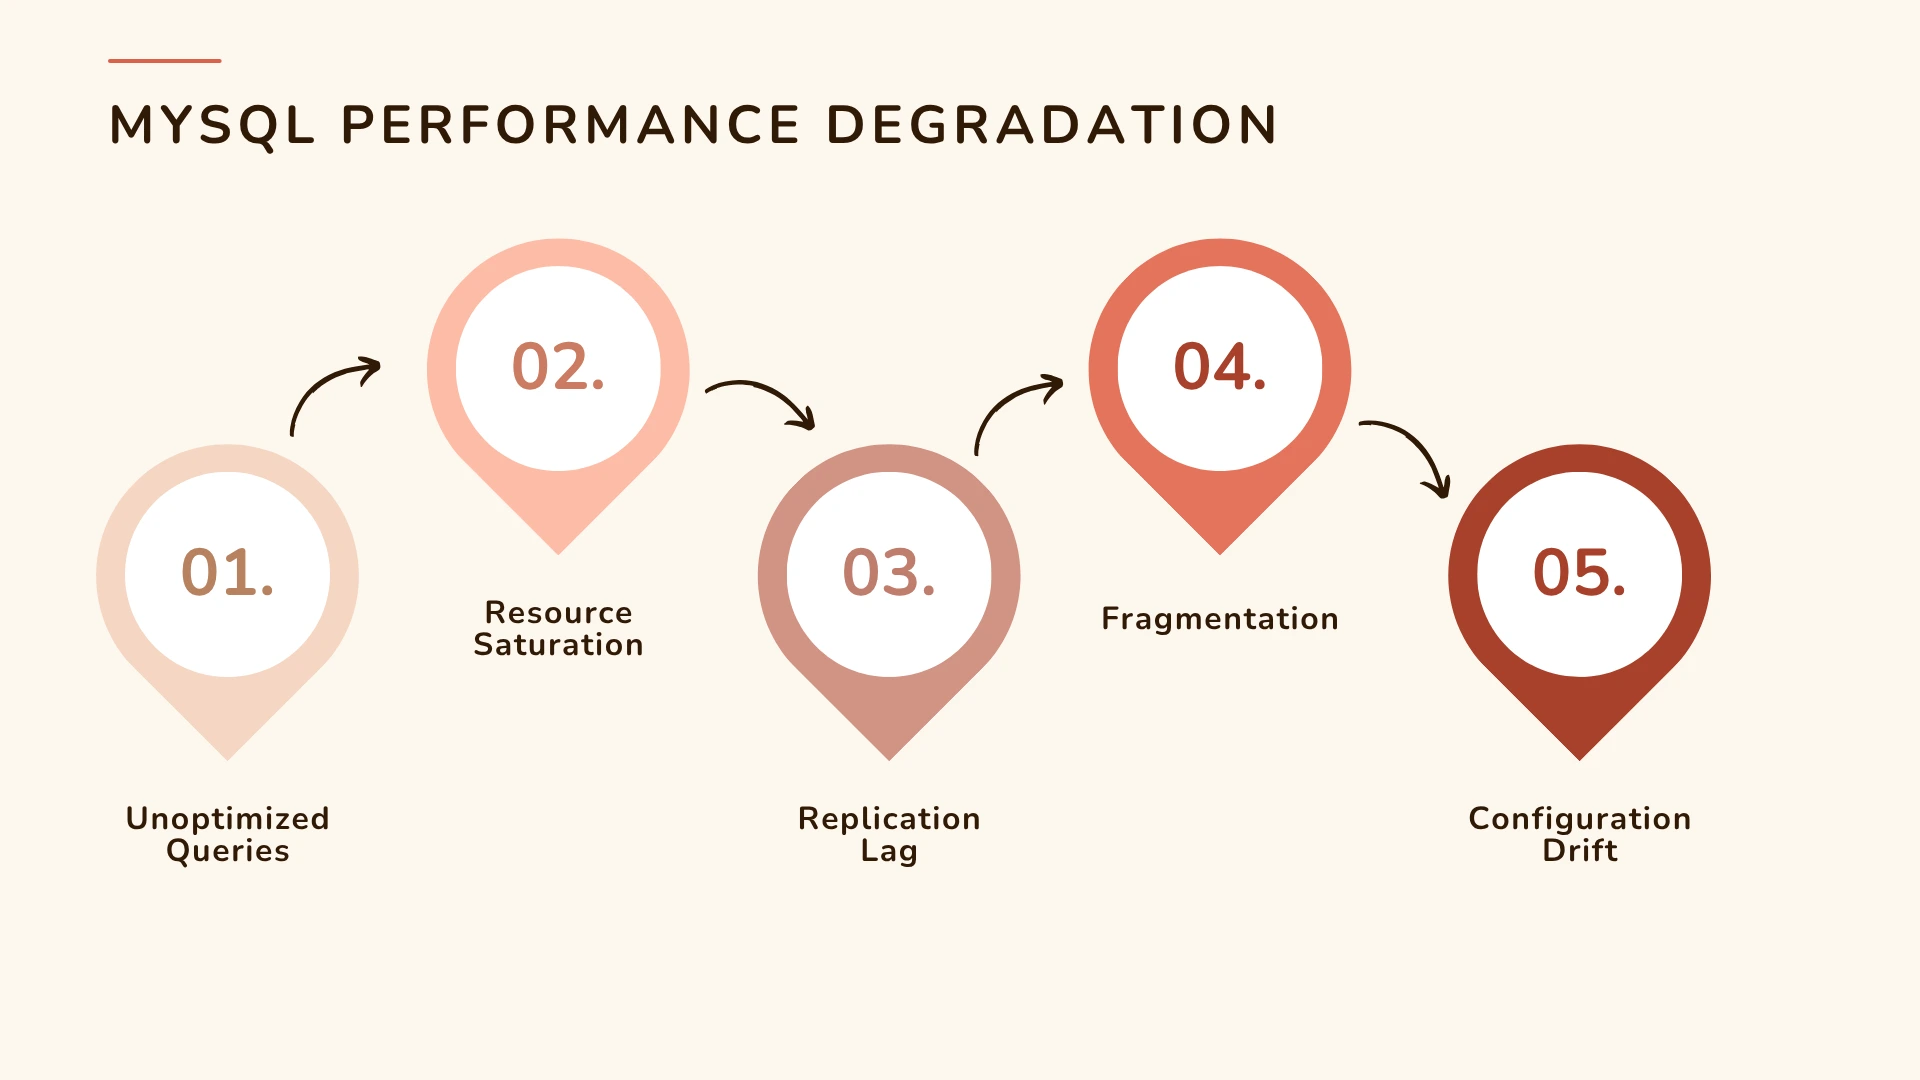
Growing data volume and unoptimized indexes
As your MySQL tables expand, so does the time required to scan, join, and retrieve data. Without proper indexing, queries start to perform full table scans instead of using indexes efficiently. Over time, this leads to:
- Increased I/O operations
- Higher CPU utilization
- Slow query execution times
In the early stages, this might go unnoticed. But as your database scales, these inefficiencies compound and result in significant slowdowns.
How to prevent it:
Regularly review query plans using the EXPLAIN command and track index hit ratios in your monitoring tool. Using Applications Manager’s MySQL performance metrics, you can identify queries with high scan-to-return ratios and fix indexing issues before they impact users.
Fragmentation and inefficient storage management
When data is frequently inserted, updated, and deleted, tables can become fragmented. Fragmentation wastes storage and increases the number of disk reads required to retrieve data.
- Higher I/O latency
- Slower query performance
- Increased memory usage
How to prevent it:
Run OPTIMIZE TABLE periodically on frequently updated tables. You can also track storage growth trends using Applications Manager’s MySQL monitoring dashboard to forecast capacity and reorganize data before it becomes a problem.
Increasing replication lag
Replication ensures high availability, but as data volume and write activity increase, replication lag can become a serious performance issue. Common causes include:
- Network congestion between master and slave nodes
- Large transactions or writes that exceed buffer limits
- High I/O load on the replica
How to prevent it:
Monitor replication metrics such as seconds behind master and relay log size.
Applications Manager’s replication health reports also alert you to replication failures in real time, helping DBAs take corrective action before users are impacted.
Inefficient query design and unoptimized workloads
Poorly written queries are one of the most common culprits behind slow MySQL performance. For example:
- Fetching unnecessary columns (SELECT *)
- Missing JOIN conditions
- Using functions on indexed columns
- Not limiting query results
How to prevent it:
Use Applications Manager’s query-level monitoring to identify slow queries, query frequency, and execution times.
Set up slow query thresholds to alert you when queries exceed acceptable response times. Once identified, work with developers to rewrite or index queries.
Monitoring metrics such as query execution time and thread cache hit rate can help detect performance regressions early.
Resource saturation: CPU, memory, and disk I/O
Even if your database is perfectly indexed and queries are optimized, hardware constraints can still create bottlenecks.
When CPU or memory utilization stays consistently high, MySQL struggles to allocate resources efficiently. High disk I/O latency can further delay read/write operations.
How to prevent it:
Track system-level metrics like CPU usage, memory consumption, I/O throughput, and network bandwidth in parallel with database metrics.
Applications Manager’s MySQL monitoring provides a unified view of both application and infrastructure health.
Lack of regular maintenance and trend analysis
MySQL performance isn’t static. Tables grow, indexes change, and workloads evolve. Without ongoing visibility, performance can slowly degrade over time.
Periodic manual checks are risky, you may miss subtle signs of degradation such as increased cache misses or lock waits.
How to prevent it:
Set up automated MySQL monitoring that continuously tracks KPIs like slow query count, buffer pool usage, and connections.
Leverage trend analysis to identify long-term changes in query performance. Our tech topic on addressing MySQL performance bottlenecks explains how to interpret these trends.
Configuration drift and inconsistent parameters
Over time, MySQL configurations change due to upgrades, manual edits, or shifting workloads. Parameters such as innodb_buffer_pool_size, max_connections, and query_cache_size have major performance impact when misconfigured.
How to prevent it:
Review configuration parameters regularly and compare them with performance baselines. Applications Manager enables you to audit configuration variables alongside performance metrics.
To understand why configuration visibility is crucial, see What is MySQL monitoring?

Poor capacity planning
Without proper forecasting, it’s easy to outgrow your existing hardware. As disk space runs low or I/O bandwidth saturates, MySQL slows down significantly.
How to prevent it:
Use capacity planning reports in Applications Manager to predict when your MySQL instances will exceed safe thresholds for memory, storage, or CPU utilization.
Preventing performance degradation with proactive MySQL monitoring
Most MySQL performance issues don’t appear overnight, they build up gradually as your database scales. The key is to monitor trends, not just incidents.
ManageEngine Applications Manager provides end-to-end MySQL monitoring that helps you:
- Track queries, connections, replication, and system resources in real time
- Set intelligent thresholds to alert you about anomalies
- Correlate database performance with underlying infrastructure metrics
- Forecast growth and plan capacity effectively
By combining continuous monitoring with actionable insights, you can eliminate guesswork, prevent slowdowns, and ensure your MySQL databases always perform at peak efficiency.
Explore now by downloading a free, 30-day, trial of ManageEngine Applications Manager now!