Hazelcast monitoring
Hazelcast is an in-memory database that is often used as an operation memory layer for databases. It helps to improve performance of applications, to distribute data across servers, clusters and geographies, to ingest data at very high rates, and to manage large data sets. It is imperative that businesses which are dependent on Hazelcast database, monitor it closely to ensure that it doesn't suffer any performance degradation. Applications Manager's Hazelcast monitoring tool empowers you to track the performance of your Hazelcast grid and clusters, and optimize them to deliver maximum results.
Get deep insights into performance metrics with Hazelcast monitoring.
Sweep the nooks and corners of your Hazelcast clusters with Applications Manager's Hazelcast monitoring tool. Monitor key parameters like metrics related to clusters, threads, memory, operation, maps, etc.
Get extensive resource usage stats.
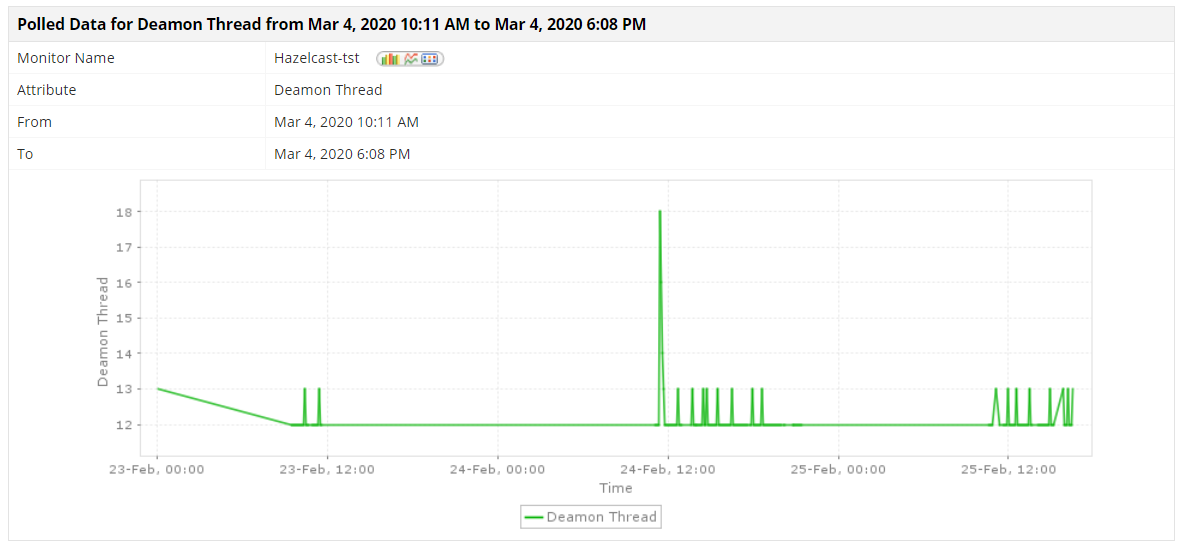
Resource usage stats like the memory utilization, threads used, heap memory and non-heap memory are available at your disposal. Prevent any issues that arise out of insufficient resources with Applications Manager's Hazelcast monitor which constantly monitors these stats.


Monitor Operations, Partitions and Events.
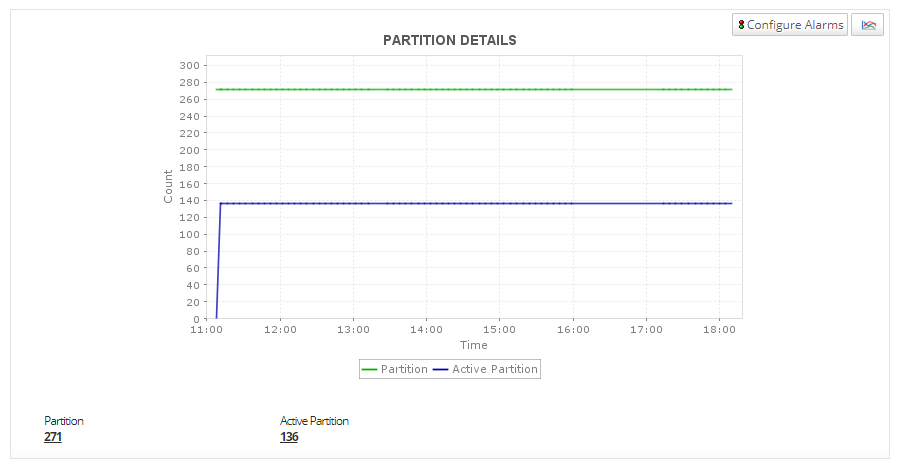
Eliminate overload risks by tracking operations & events running on your Hazelcast grid, connections, and partitions. Applications Manager's Hazelcast monitoring tool helps you by providing a panoramic view on important Hazelcast parameters.
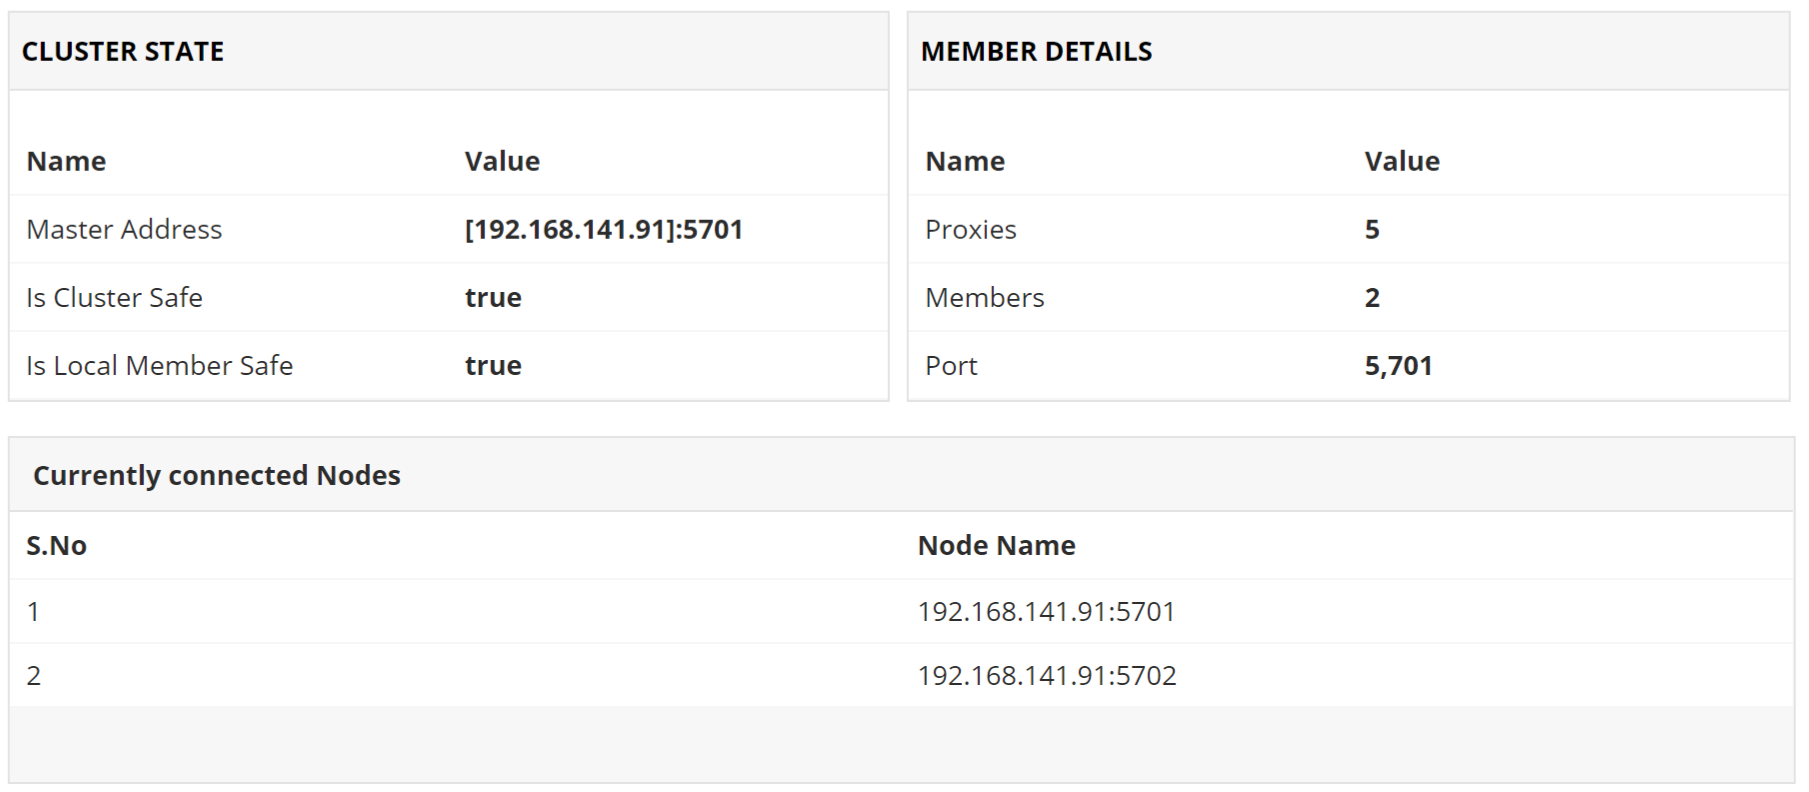
Get details about Configuration and Clusters.
Applications Manager's Hazelcast cluster monitoring software enables you to understand your grid better by providing specifications of your clusters and configuration.
Monitor Queues and Topics.
Applications Manager's Hazelcast monitoring facility enables you to keep tabs on Hazelcast Queues and Topics with real time stats of operations like backup, empty poll, event, offer, publish, and receive operations.
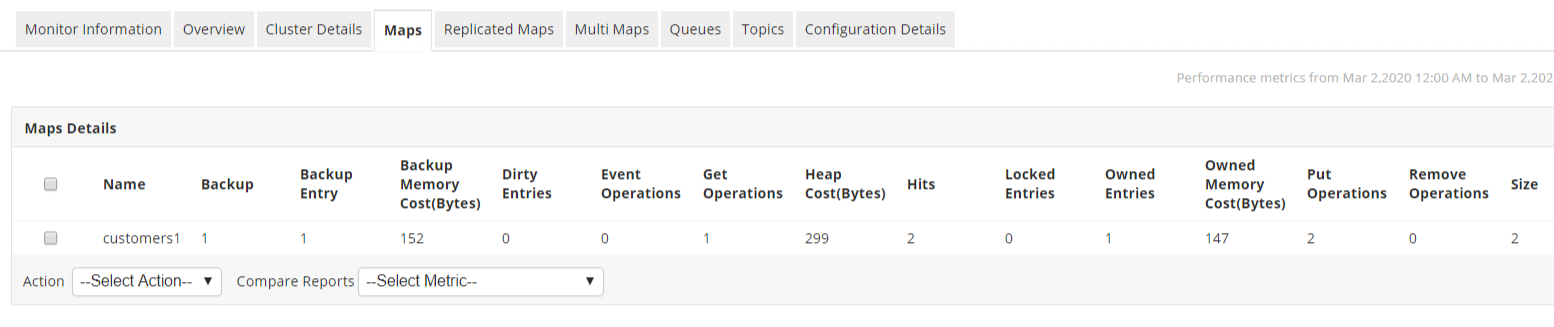
Keep an eye on Maps, Replicated Maps and Multi Maps.
With details about backup, dirty entries, event operations, get operations, put operations, entry details and size, gain insight into the performance of Hazelcast database.
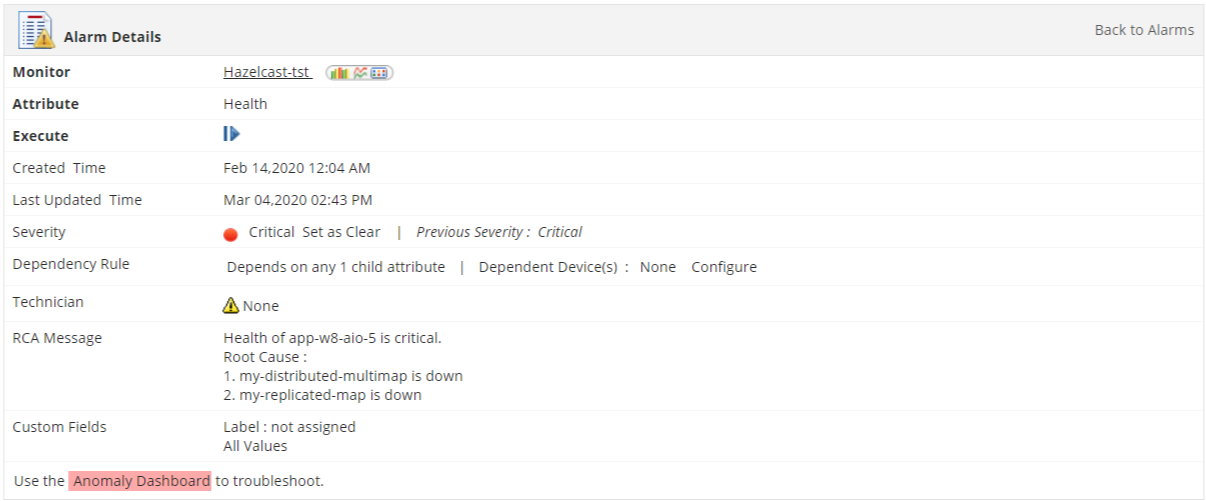
Quickly troubleshoot performance issues.
Our Hazelcast performance monitoring solution enables you to set up thresholds for crucial metrics to receive alerts when the values deviate from the permissible range. You can choose between static, dynamic and adaptive baseline values as the threshold. Additionally, you can also recognize performance degradation by setting up anomaly profiles. Configure automated actions and associate them to thresholds and anomaly profiles to reduce manual intervention.
Predict future needs with intelligent reports.
With the trend analysis reports offered by Applications Manager's Hazelcast performance monitor, you can analyze the historical data of various metrics over a period of time. You can also make informed decisions regarding your resources with the help of forecast reports. These reports employ machine learning techniques to predict growth and utilization trends for up to three years in the future.