Add Log Type
A Log Type specifies the structure and format in which an application generates log entries. Applications Manager supports multiple predefined log types out of the box and also allows you to create custom log types for application-specific or non-standard log formats.
While it defines how logs are structured and parsed, a log type does not initiate log collection by itself. Collection begins only after the log type is associated with a Log Profile and applied to one or more monitors.
Once AppLogs is enabled, simply create a Log Profile and associate the appropriate log type with the required servers to begin collecting, parsing, and analyzing log data.
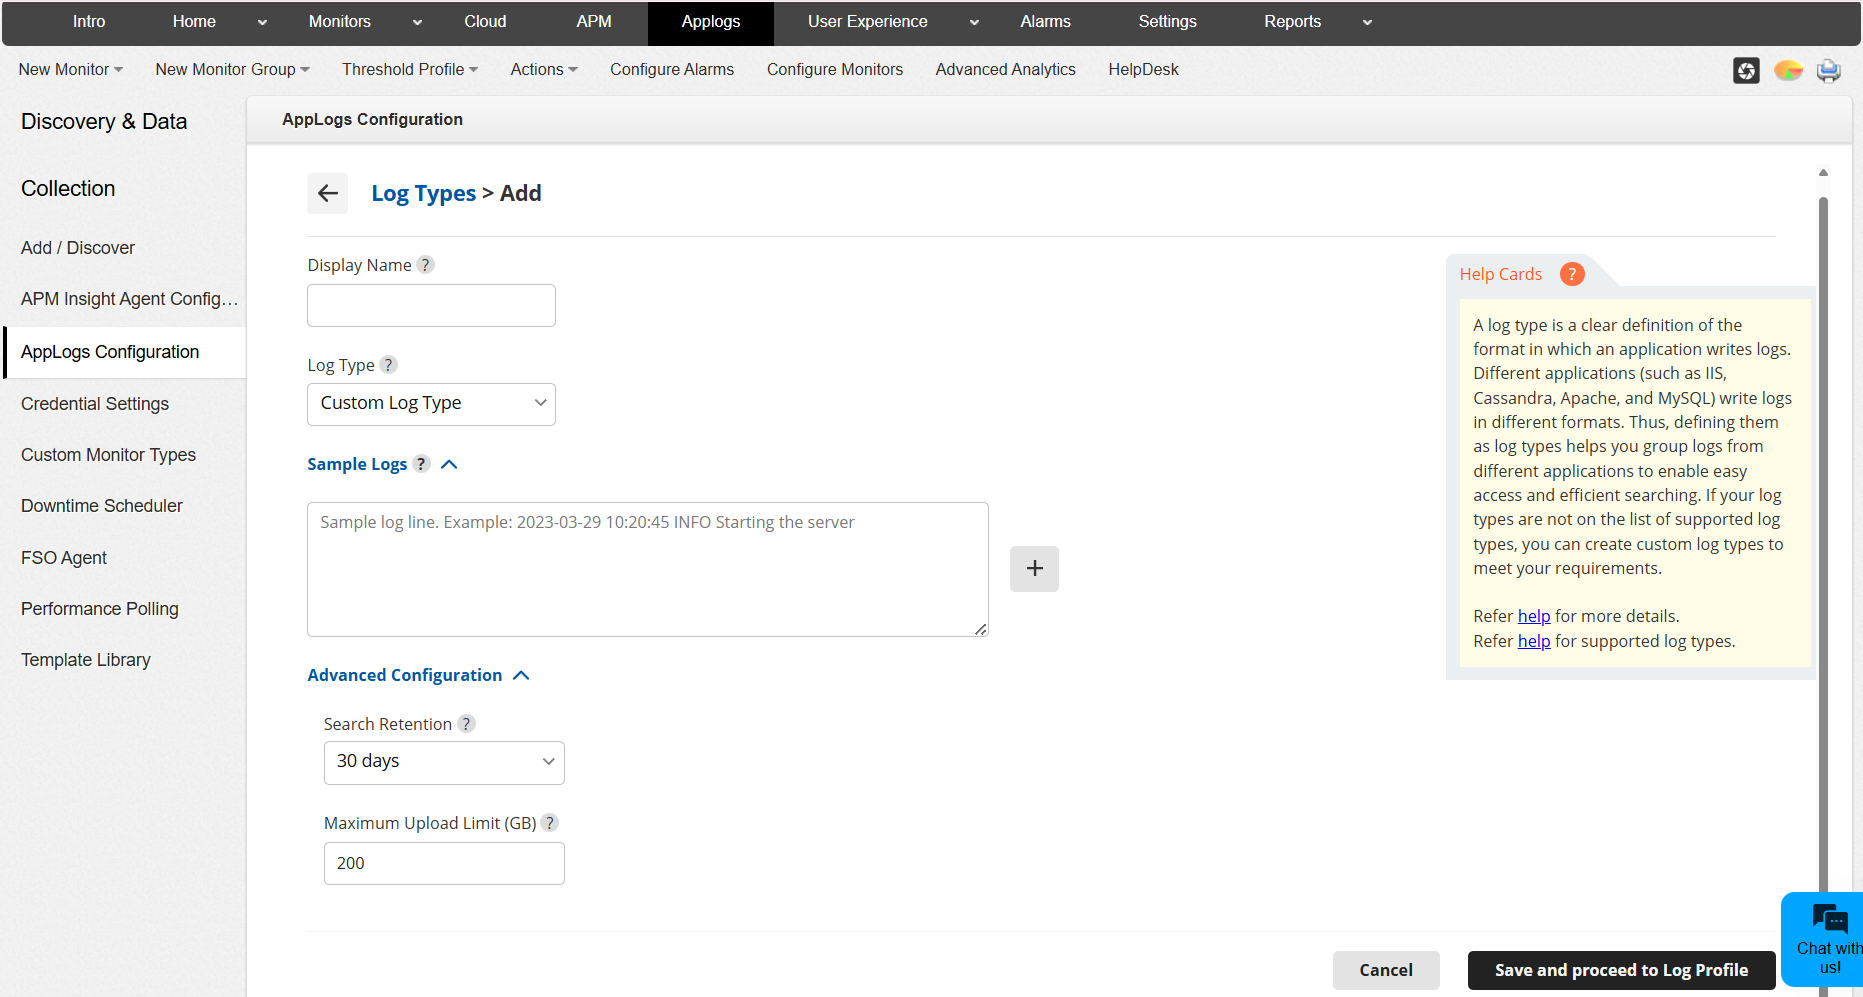
To add a log type, navigate to AppLogs → Configurations → Log Types → Add Log Type and configure the following:
Enter the Log Type details
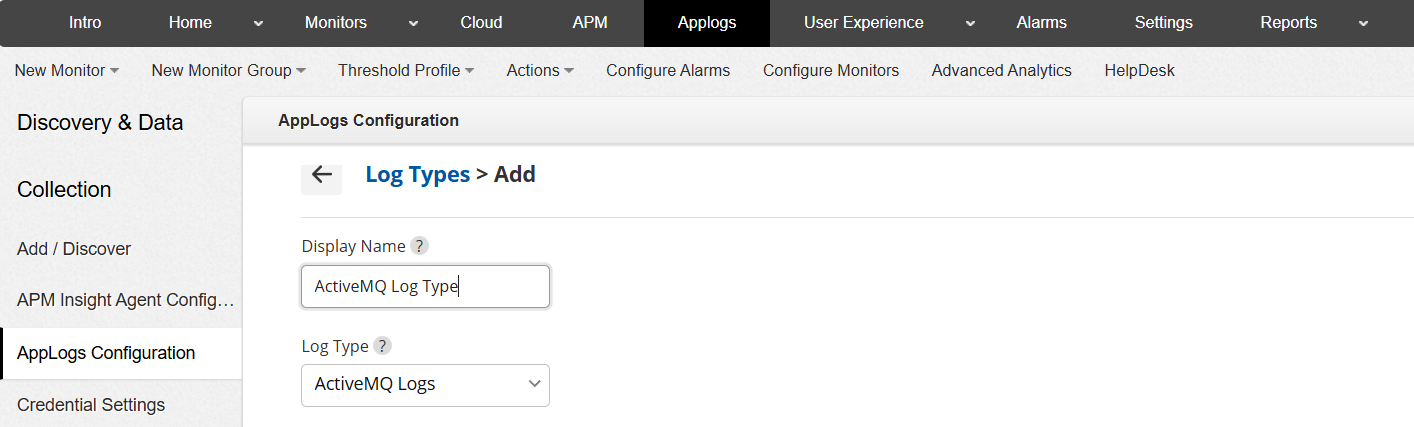
- Display Name: Enter a descriptive name for the log type.
- Log Type: Choose from the list of predefined log types (if you want to review or modify them), or select Custom Log Type to create a new parsing configuration for unsupported log formats.
Provide Sample Log Entries
In the Sample Logs section, enter one or more sample log lines exactly as they appear in the log file. These samples help Applications Manager automatically detect the log structure and derive the appropriate parsing pattern.

- Enter valid sample log lines including timestamps, log levels, and messages.
- Click the + icon to add multiple sample log entries, if required.
Note: Ensure that the sample logs accurately represent the actual production log format. Incorrect, partial, or mixed-format samples may result in improper pattern derivation and inaccurate field extraction.
Log Pattern
Applications Manager automatically generates a default parsing pattern from the provided sample logs. This derived pattern determines how individual log fields—such as timestamp, severity, source, event ID, and message—are extracted, parsed, and indexed.
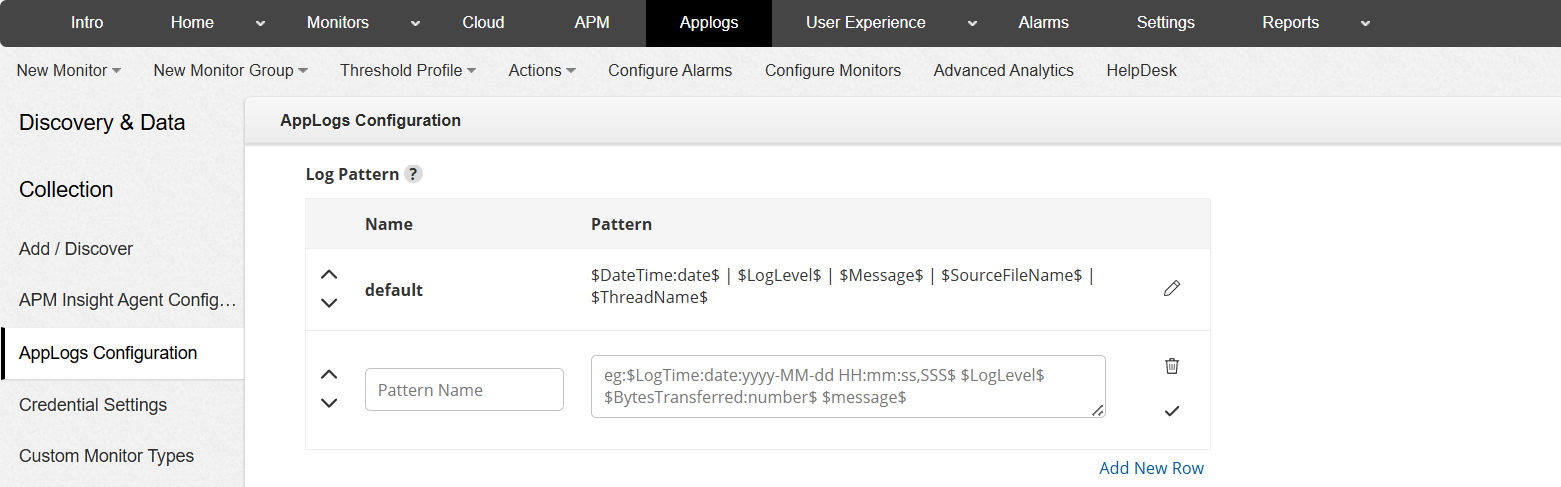
- The Matched Pattern indicates which pattern successfully matches the provided sample log.
- You can click the Edit icon next to a pattern to manually refine the derived parsing expression.
- Use Add New Row to define additional patterns if your application generates logs in multiple formats.
Note:- The parsing pattern is generated based on the sample logs provided during log type creation.
- This pattern is reused by associated Log Profiles to structure and index incoming log data.
- Provide representative samples for all possible log formats and review the extracted fields to ensure accurate parsing before saving.
- If the pattern does not accurately reflect the actual log format, logs will still be collected but certain fields may not be extracted correctly.
Sample Output
The Sample Output section displays how the selected pattern parses the sample log entry. It shows the extracted fields and their corresponding values.
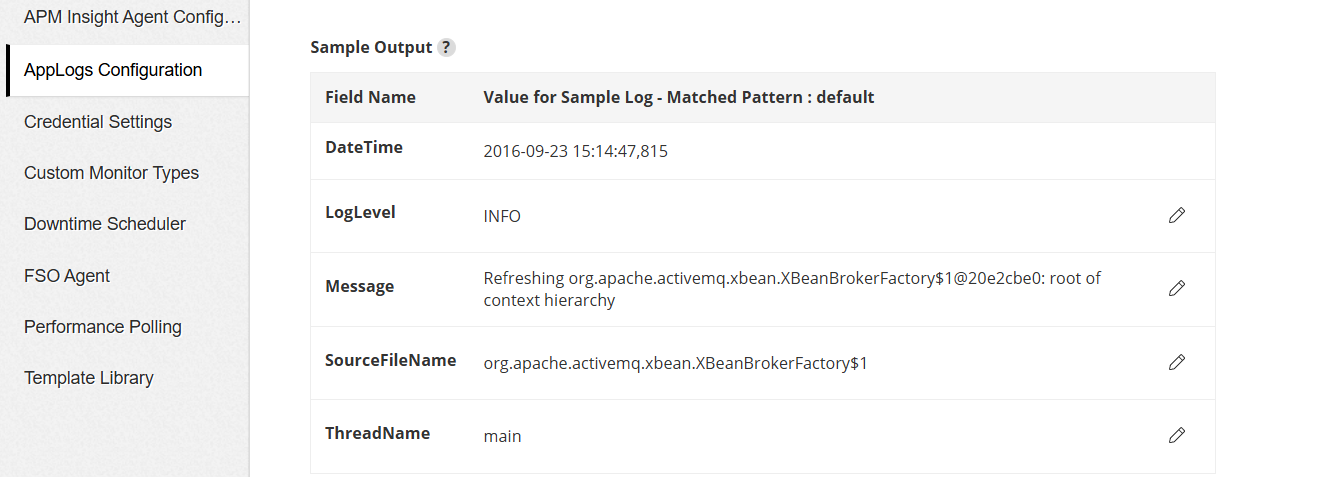
- Fields such as DateTime, LogLevel, and Message are displayed along with parsed values.
- If a field is incorrectly parsed, you can refine the associated pattern.
- Click the Edit icon next to a field to configure advanced field-level settings. When editing a field from the Sample Output section, an Advanced Field Configuration pop-up is displayed. This allows you to:
- Enable masking or hashing for sensitive data
- Filter log lines at the source based on field values
- Ignore specific fields at the source
- Define derived fields using custom regex expressions
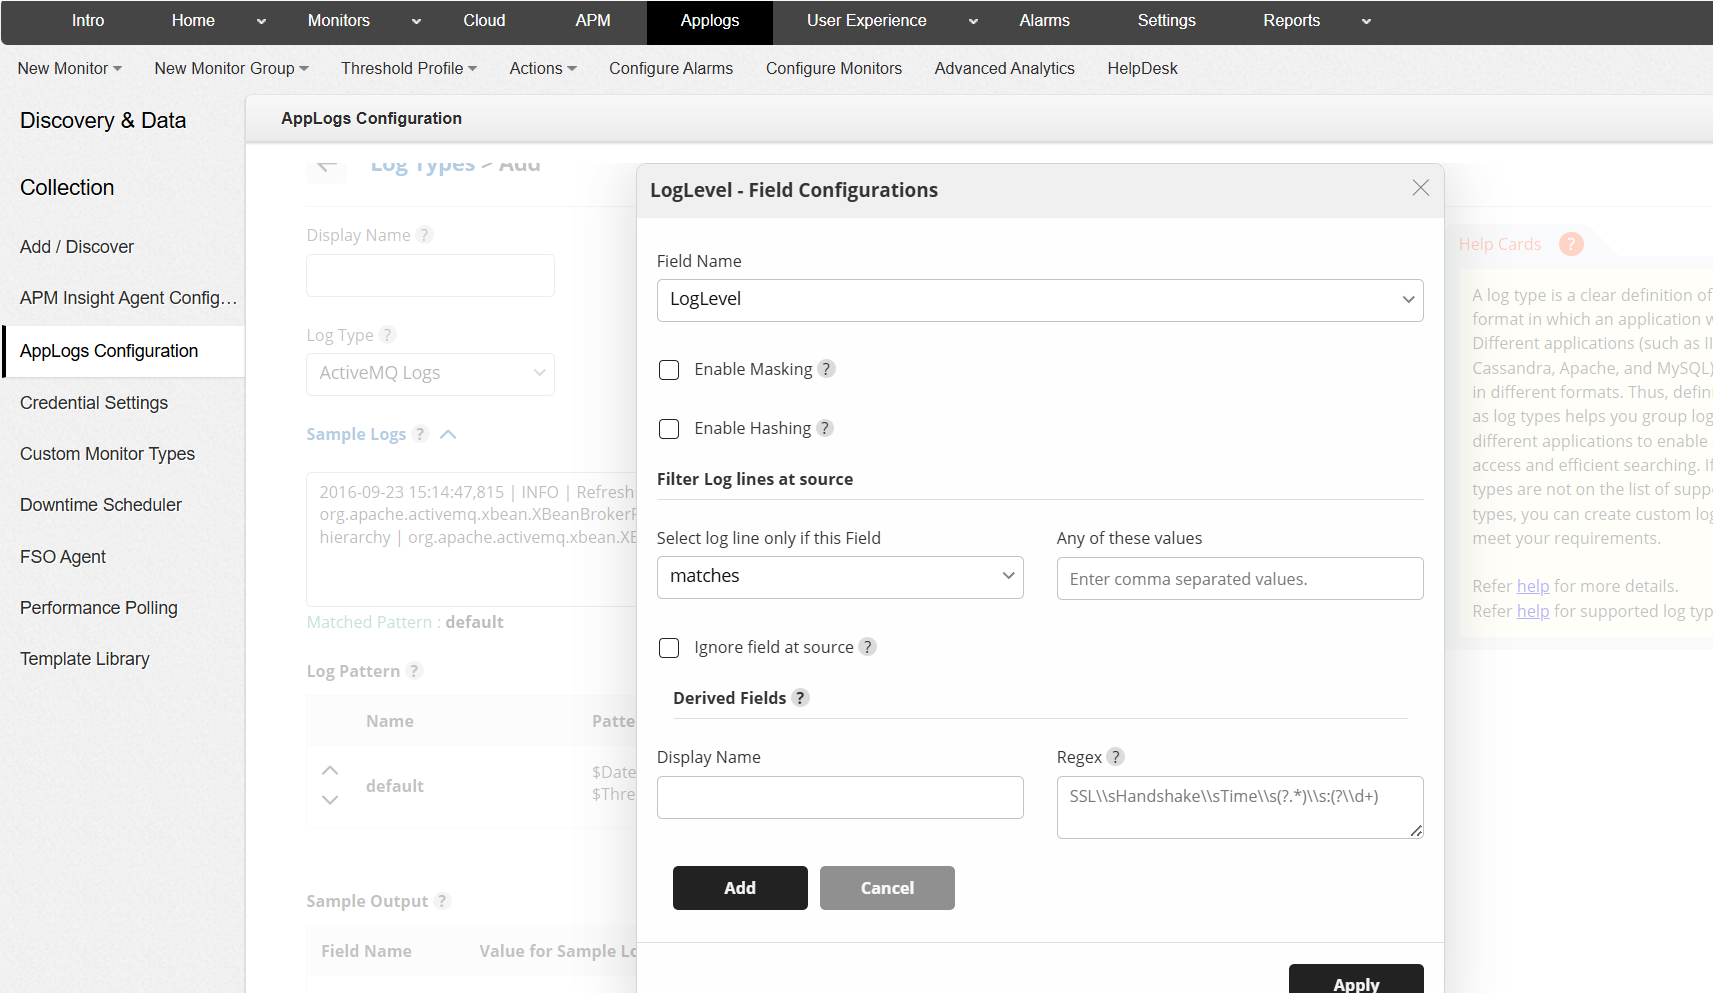
This provides fine-grained control over how extracted fields are stored, indexed, and used in log analysis.
Advanced Configuration
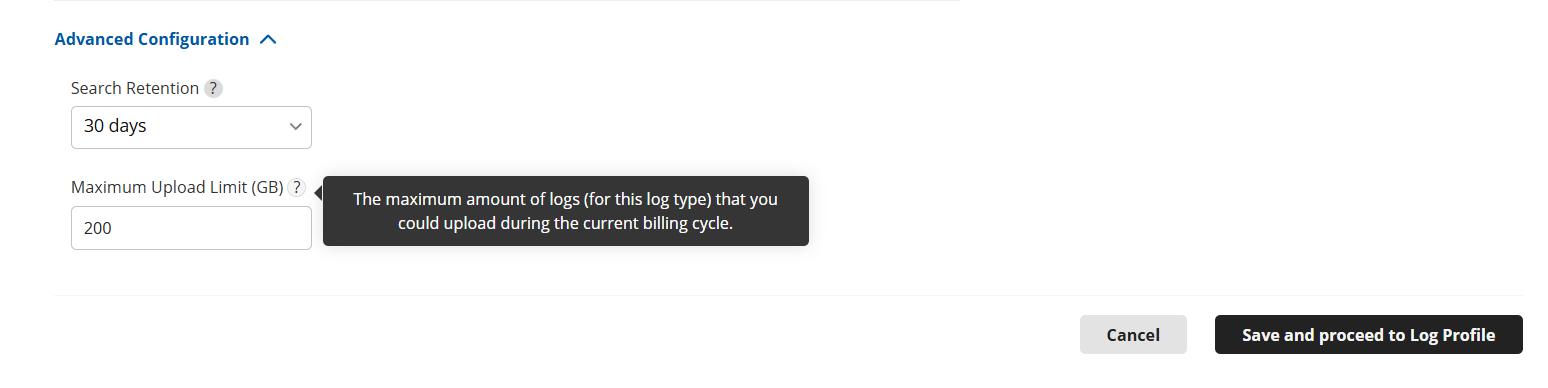
- Search Retention: Specifies the number of days the collected log data will be stored and available for search in Applications Manager. You can choose from the predefined options — 7, 15, 30, 60, or 90 days. The default retention period is 30 days.
- Maximum Upload Limit (GB): Defines the maximum amount of logs (for this log type) that can be uploaded during the current billing cycle. By default, the maximum limit per log type is aligned with the total AppLogs add-on license (in GB) purchased. You can configure a lower limit per log type here if required to control log volume distribution across multiple log types.
- Once all the required details have been entered, click on Save and proceed to Log Profile.
Once configured and saved, the log type becomes available for selection when creating or editing Log Profiles and can be associated with the required servers to begin log collection.
