Async request tracking in Java
APM Insight Java includes CompletableFuture asynchronous transaction support. This is the most useful and widely adopted method for asynchronous processing in many supported frameworks. This document explains how asynchronous processing occurs and how APM Insight monitors async functions.
Asynchronous operations
A synchronous programming model typically executes programming tasks in a specific order. One task must be completed before the next can begin, which increases the waiting time for several tasks.
Asynchronous programming uses a non-blocking model, allowing tasks to be executed concurrently. Asynchronous tasks are completely independent of one another in terms of execution and initialization. Because asynchronous code does not execute in a sequential order, the server's full processing power can be utilized more efficiently.
The APM Insight Java agent has been specifically designed to monitor async tasks, allowing users to track the performance of async functions and web transactions easily.
Traces to identify asynchronous calls
The traces captured in APM Insight provide visibility into how asynchronous tasks are executed concurrently across your environment.
Follow the steps below to view the asynchronous calls:
- Log in to your Applications Manager web client.
- Go to APM tab → Your Java application.
- Click the Traces tab, then click the required trace.
- Select the Trace Details tab.
![]()
We show the following metrics for async calls:
- Async call status: Completed, Failed, Cancelled
- Async thread information: Thread name, Thread ID, CPU time, Memory allocated
- Threadpool wait time: The waiting time of an async task for a new thread assignment
- Wait time in caller thread: The waiting time of the main thread for the async job to finish (if join() is invoked)
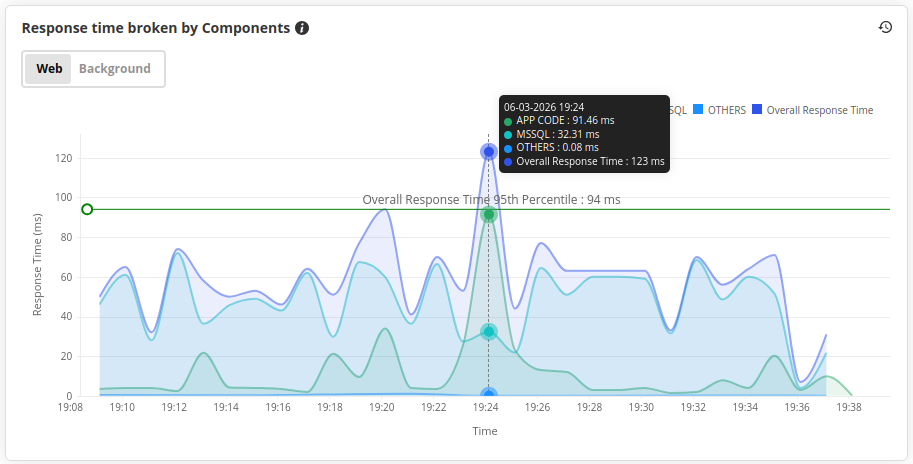
How do async calls impact response time?
The Overall Response Time for asynchronous Java applications is often less than the total transaction time. This is because async methods do not have to wait for all preceding methods to finish before returning. Because tasks can be deferred, the application can make better use of its limited resources and process things faster.
To view this, navigate to the Applications Manager web client > APM tab > select your application > click the Overview tab. On the Overview page, check the App Server Response Time Broken by Components graph. The asynchronous activity in the respective Java application can result in the response time being less than the total transaction time.