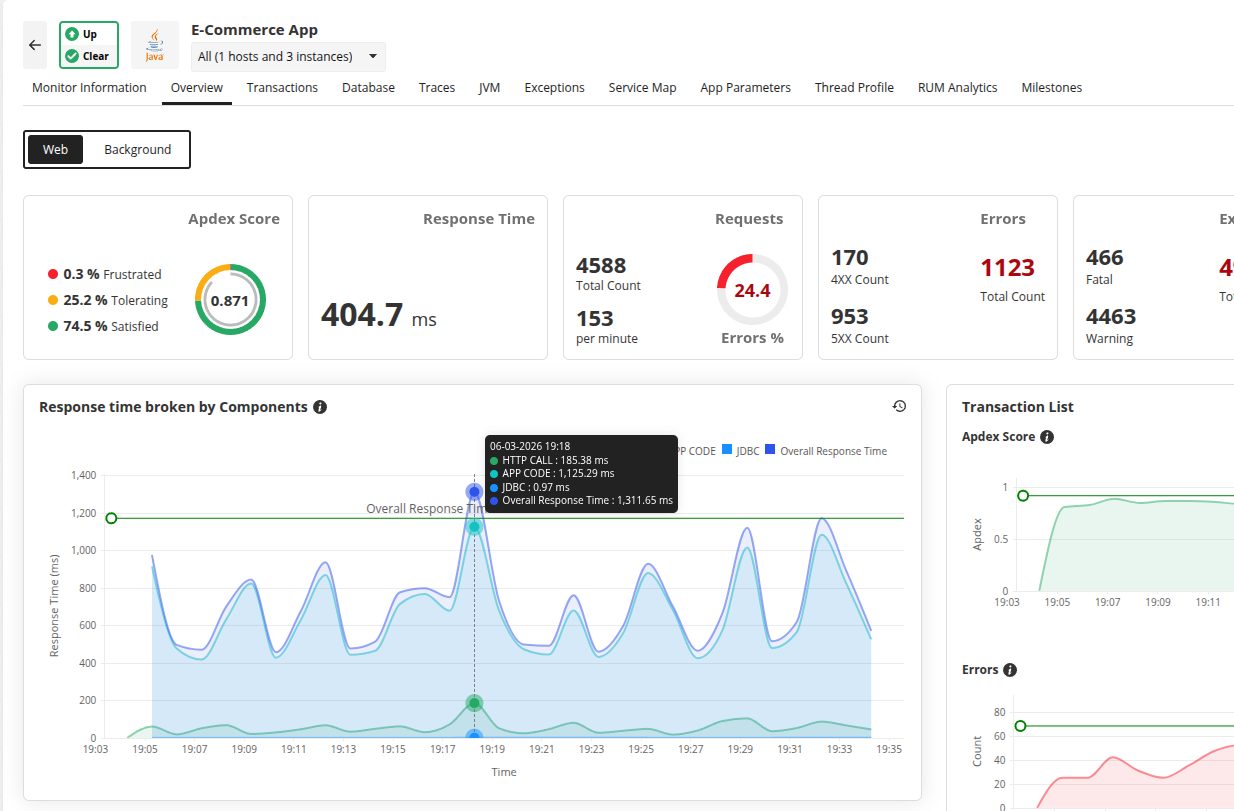
Metrics and inference - Overall response time
The total response time is the amount of time taken to complete a transaction. It is depicted as a stacked graph and can be viewed under the App Server Response Time Broken by Components graph. This shows the correlation between the time taken by the individual components and the overall response time of the application.
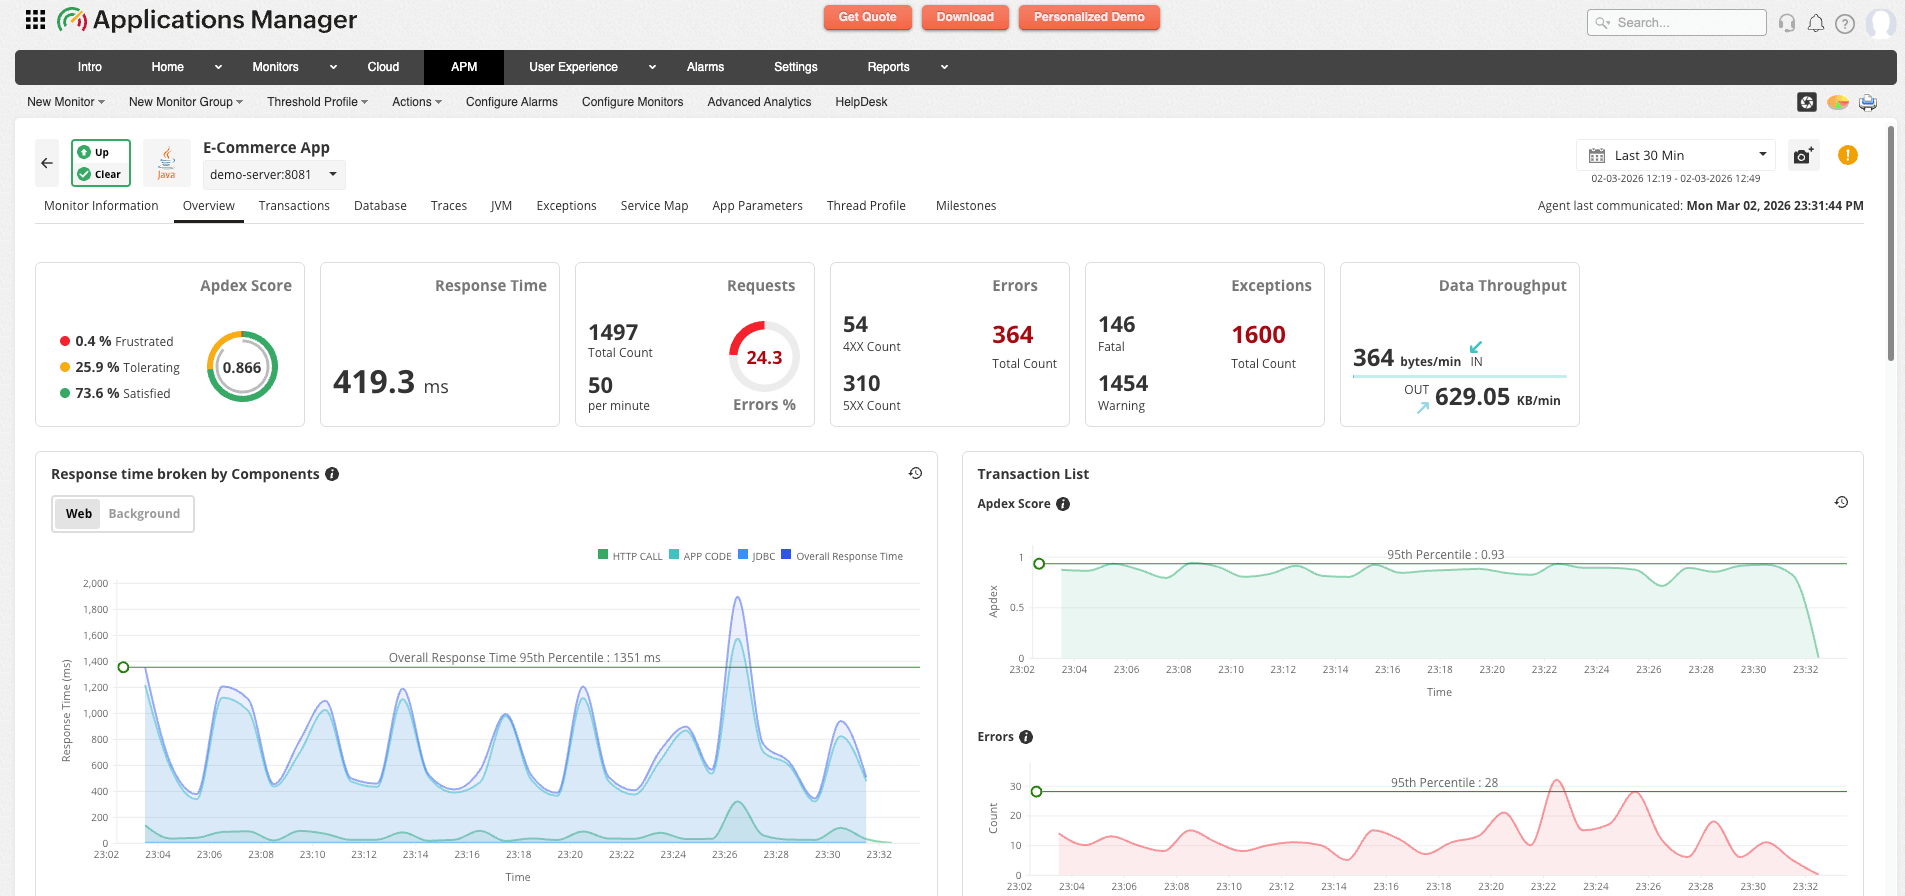
In case of synchronous applications, sum of the response time of app server components will be equal to the overall response time.
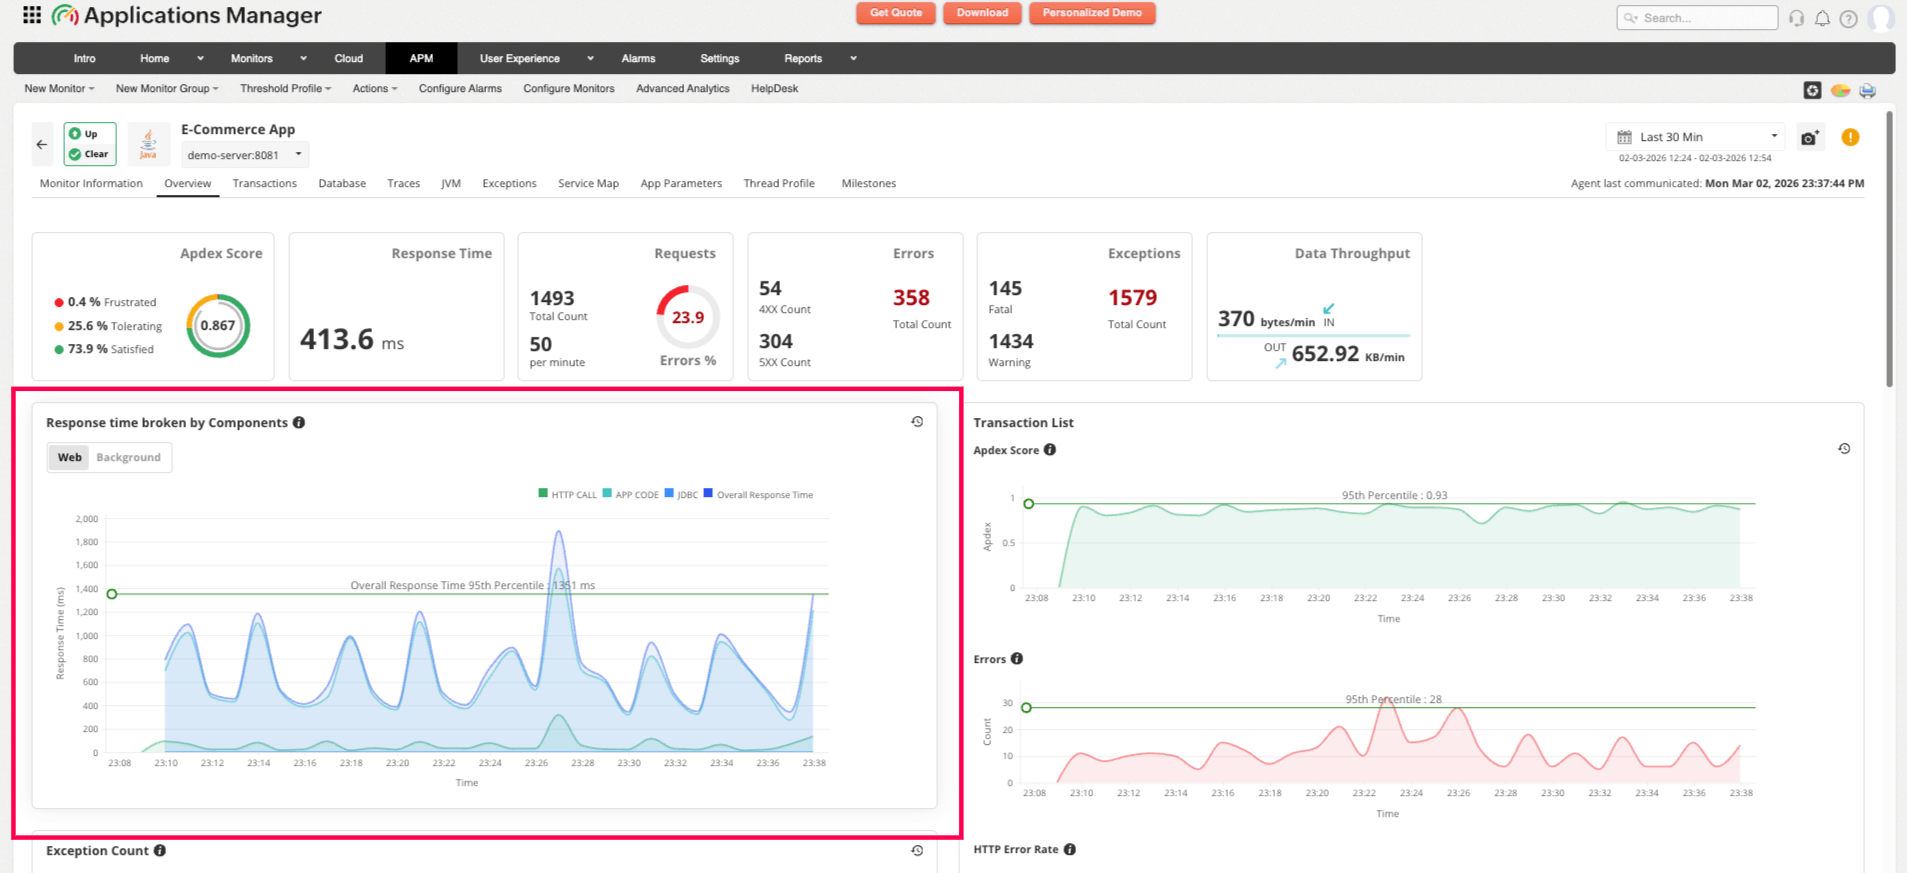
In case of asynchronous applications, sum of the app server component time may be greater than the overall response time.
Note: The maximum number of unique components tracked by the agent is 15. If the component count exceeds 15, response time of other components are shown as Others. Also, time spent in waiting for resources, say time taken to initiate a DB request, is included in Others.