Configuring .NET Agent Custom Instrumentation Manually
The APM Insight .NET Agent automatically adds instrumentation to the .NET framework's relevant methods and gathers the associated metrics. Additionally, custom instrumentation enables you to monitor your framework's performance without needing to modify your application code.
With custom instrumentation, you can easily monitor and analyze your application's methods as they appear in the transaction traces. This feature proves invaluable when troubleshooting performance-related problems, especially if you suspect that execution time is primarily consumed by your application's specific methods.
In scenarios where your application contains methods with extensive code blocks or makes external calls, custom instrumentation becomes essential for pinpointing the root cause of performance issues.
Why configure Custom Instrumentation?
- Viewing your own web applications' performance.
- To group method metrics or performance, users can name the same component for multiple methods.
- Example:
- Method1 : SampleComponent
- Method2 : SampleComponent
- Method3 : SampleComponent
- If the SampleComponent takes 25% time in overall application, it means that the three methods defined for the component consumed 25% of overall performance.
- Example:
- Tracking performance of any third party framework used in an application.
Configuring custom instrumentation
The configuration file used by APM Insight is structured in JSON format. In this configuration file, you have the flexibility to define various elements specific to your web application. These elements include the assembly name, class name, and method name, which allows the agent to identify and track the performance of these specified methods within your application.
The custom instrumentation configuration file custom_instrumentation.json can be found in the ProgramData/DotNetAgent path.
Syntax of the Custom Instrumentation data
{
  "AssemblyName1": {
    "NameSpace.ClassName1": {
      "MethodName1": "ComponentName"
    },
    "NameSpace.ClassName2": {
      "MethodName1": "ComponentName",
      "MethodName2": "ComponentName"
    }
  },
  "AssemblyName2": {
    "NameSpace.ClassName1": {
      "*": "ComponentName"
    },
    "NameSpace.*": {
      "MethodName1": "ComponentName",
      "MethodName2": "ComponentName"
    }
  }
}
where,
- AssemblyName: Name of the DLL.
- NameSpace.ClassName: Name of the class along with the namespace name.
- MethodName: Name of the method to be monitored.
- ComponentName: The component name of the method. If it is empty, the default component name POCO (Plain Old CLR Object) will be entered.
Note: Providing '*' in place of ClassName or MethodName, will track all the methods in the classes of assembly. Add enable.wildcardmatch=true in apminsight.conf file to achieve this.
Custom Instrumentation example
namespace Employee.Controllers
{
    public class SalaryController : Controller
    {
        public ActionResult ProcessPayRoll()
        {
           EmployeeSR.EmpServiceClient empServiceClient = new EmployeeSR.EmpServiceClient();
           empServiceClient.ProcessPayroll(Context.EmpId);
           return View();
        }

        public ActionResult GetSalaryAmount(int empId)
        {
           using(var conn = new SqlConnection(connString))
           {
                conn.Open();
                var cmd = new SqlCommand("select Salary from Employee where id='" + id + "'", conn);
                ViewBag.SalaryAmount = cmd. ExecuteScalar();
                conn.Close();
           }
           return View();
        }

        public ActionResult GetSalaryPerMonth(string id)
        {
           int salary = GetSalaryPerYear();
           ViewBag.Result  = salary / 12;
           return View();
        }
    }
}
The custom instrumentation configuration for the class is as follows:
{
"Employee": {
"Employee.Controllers.SalaryController": {
"ProcessPayRoll": "PAYROLL",
"GetSalaryAmount": "FETCH",
"GetSalaryPerMonth": "FETCH"
}
}
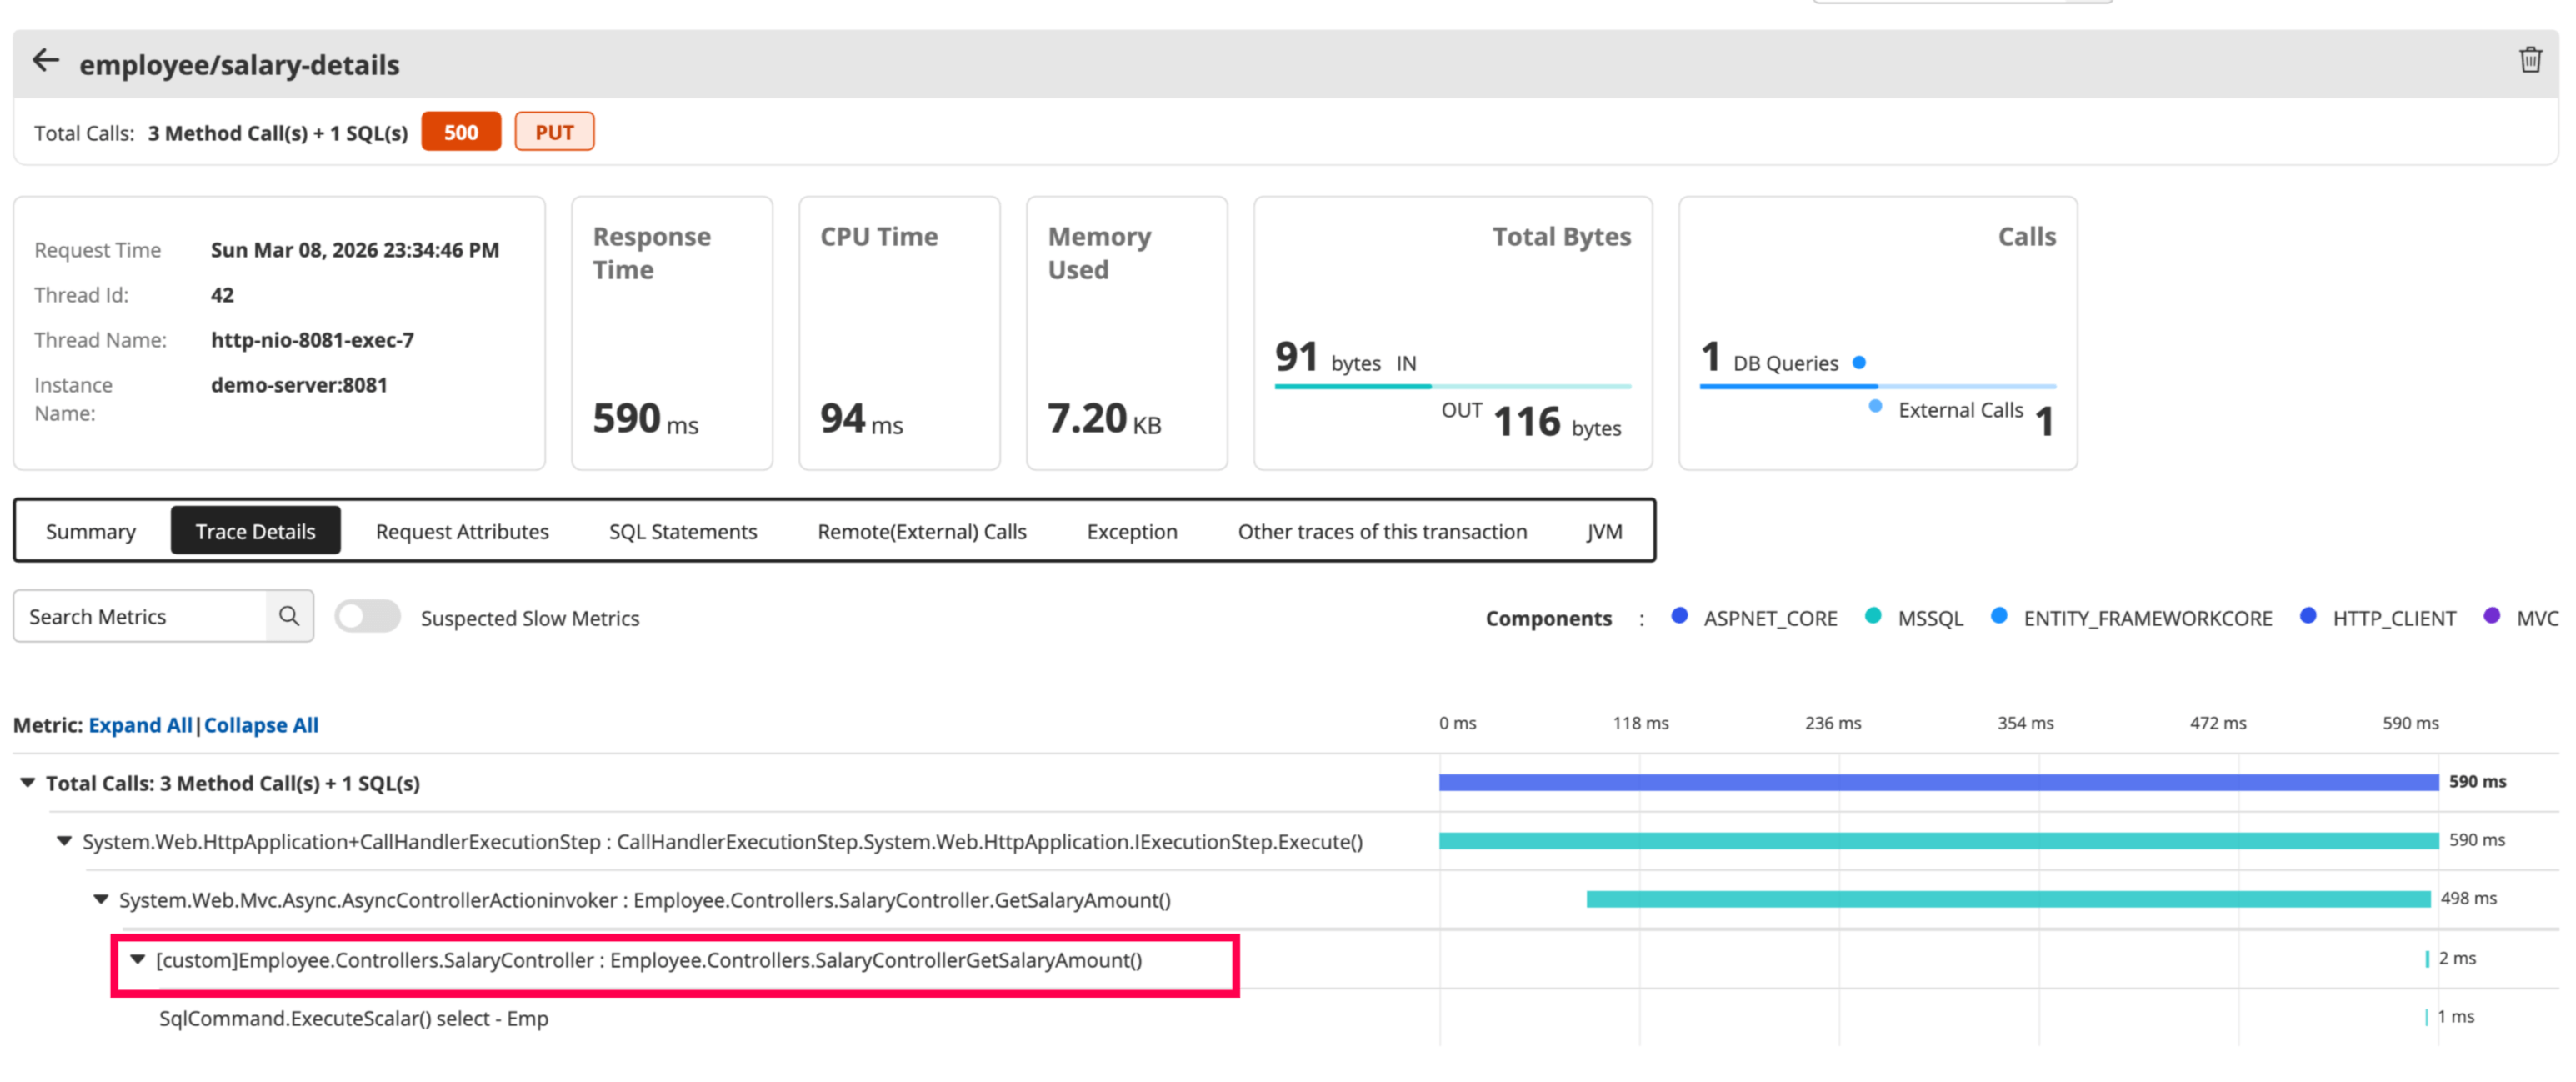
}The instrumented methods will be displayed with the execution time under the Traces tab as follows:
Note:
- The IIS does not need to be restarted.
- The corresponding application pool must be recycled after modifying the custom instrumentation file to take effect.
