Application Process Discovery
When the Applications Manager Full-Stack Agent is installed with AutoProfiler enabled, it automatically detects application processes running on your host machine. Based on predefined rules, it hooks the appropriate APM agents and begins monitoring applications and collecting performance metrics. With Application Process Discovery, you can choose the application processes you want to monitor.
Browse through the following topics to learn more:
- Access the Application Discovery tab
- How the Application Discovery works
- What if an application process does not match a default rule?
- Process Discovery overview
Access the Application Discovery tab
To access the Application Discovery tab:
- Log in to Applications Manager.
- Go to the APM tab > Hosts.
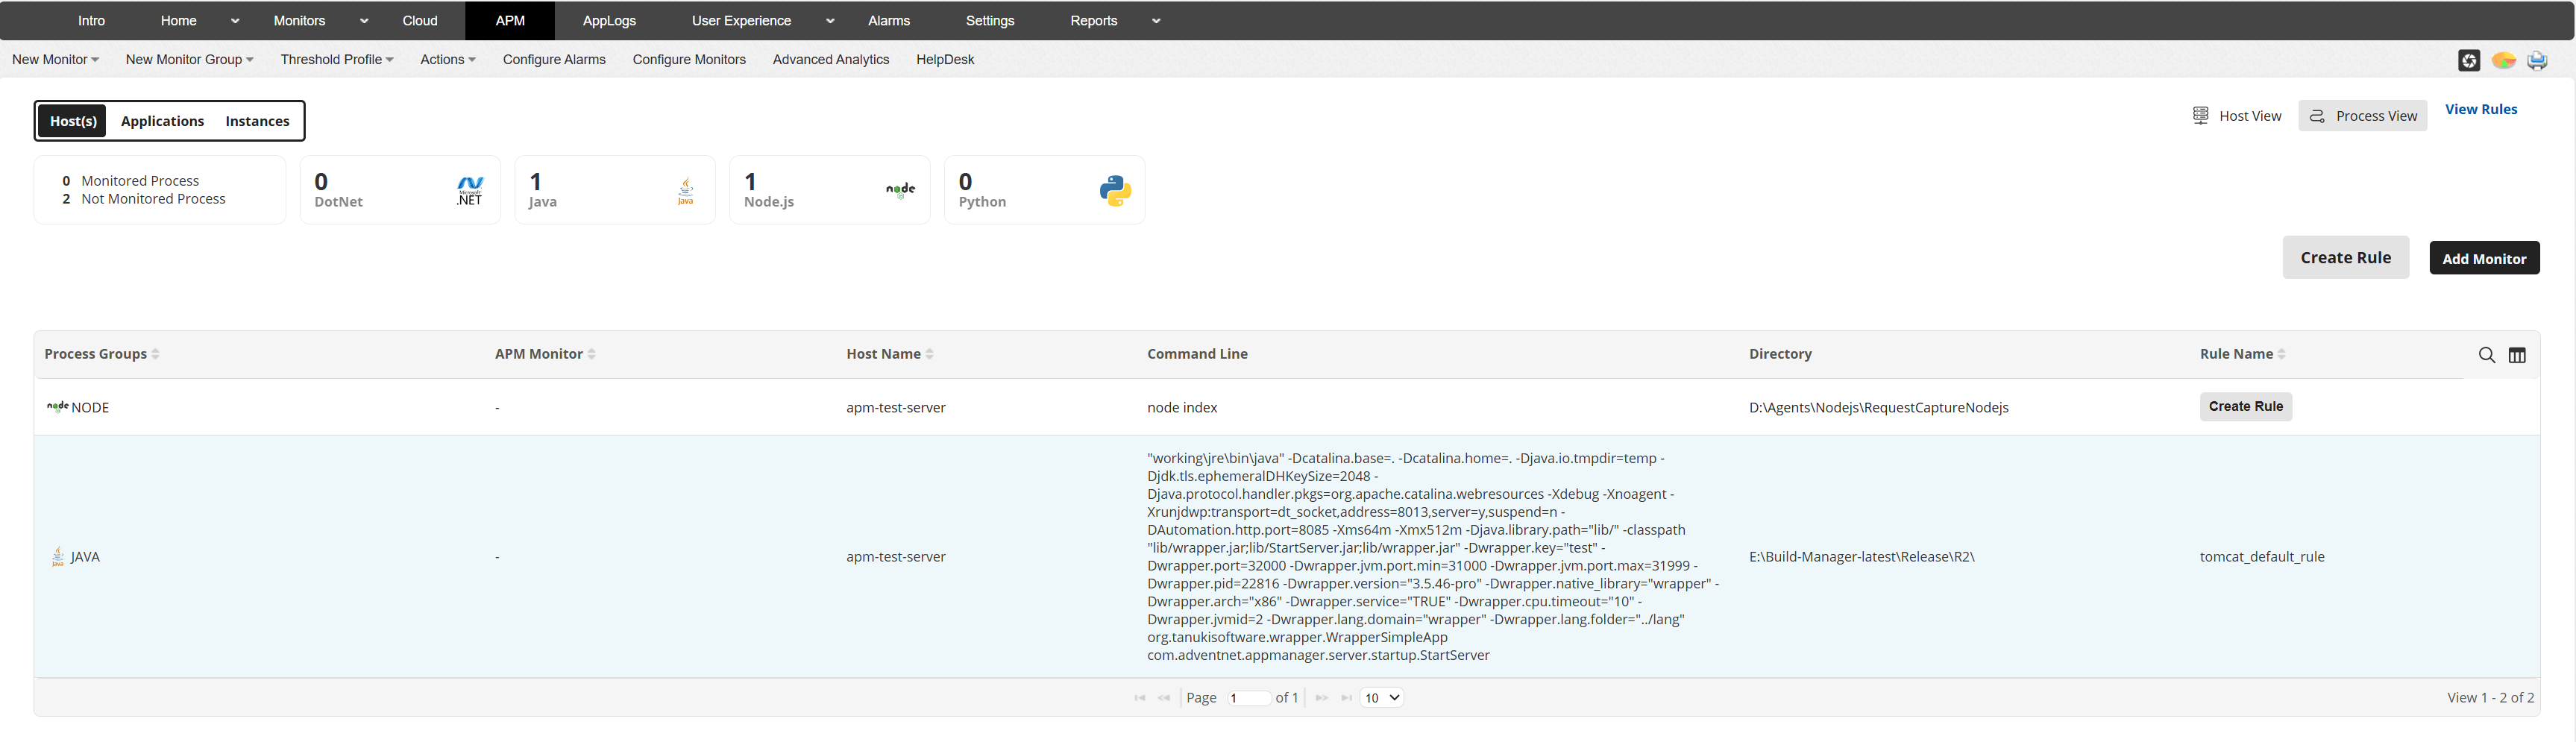
- You will find the list of all the processes detected on your host under the Process Discovery tab.
How the Application Discovery works
Once the Full-Stack Agent, along with AutoProfiler, is installed, the APM AutoProfiler scans your host machine to detect running application processes, and the identified applications are listed under the Process Discovery tab.
The preloader compares each detected process with the default rules available in the APM Process Monitoring Rules section. These default rules are based on popular industry-standard frameworks. If a detected application matches a default rule, it is automatically mapped, and an APM monitor is created.
Note: Any processes that were running before the Full-Stack Agent installation must be restarted for the APM monitor to be created.
What if an application process does not match a default rule?
If an application does not match any existing rule, an Add Rule button will be displayed, allowing you to create a custom rule.
After you add a new rule, wait up to five minutes for the next process discovery cycle to detect the changes. Then restart your application so the monitor can be created.
You can select which application processes to monitor. If no rule is added or if the assigned default rule is disabled, the corresponding application process will not be monitored.
Process Discovery overview
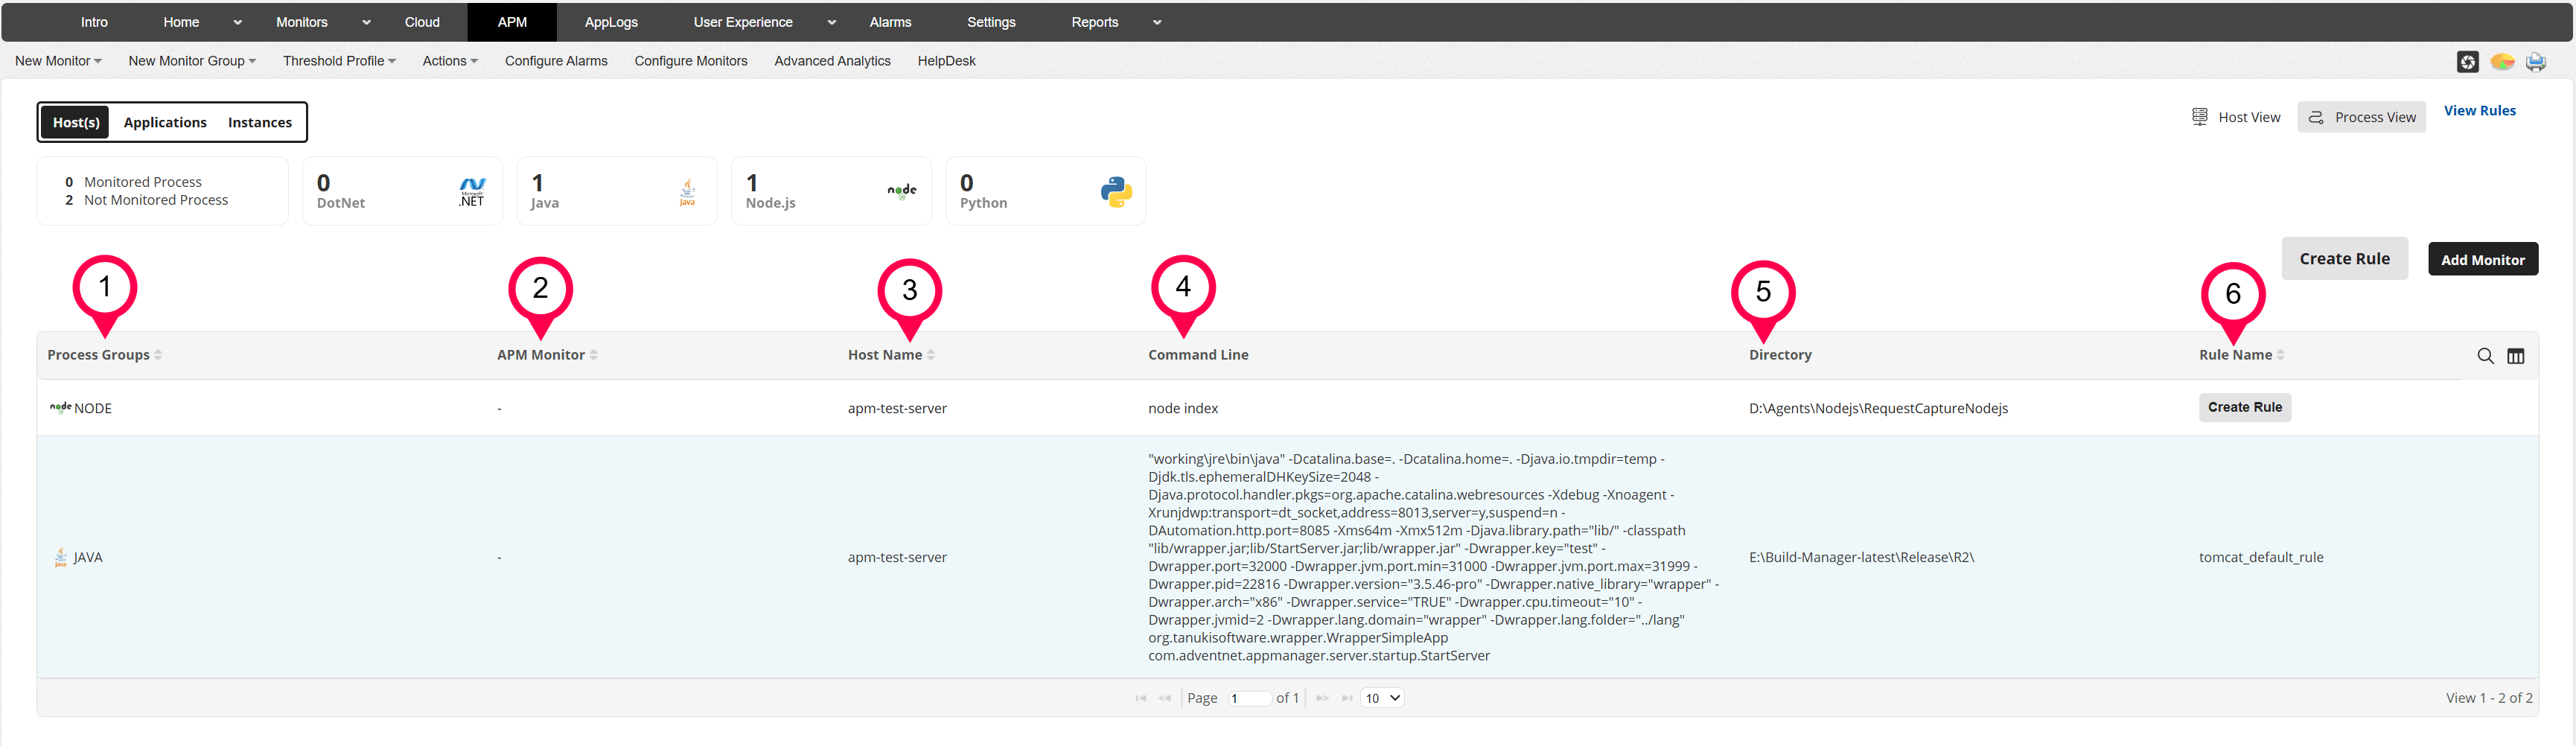
The table includes the following columns:
| # | Field Name | Description |
|---|---|---|
| 1 | Technology | Displays the application process technologies such as Java, .NET, Node.js, and Python. |
| 2 | APM Monitor | Shows the monitor associated with the detected application. AutoProfiler automatically identifies and generates a suitable monitor name. You can customize the monitor name by specifying a Custom Application Name in the APM Process Monitoring Rules screen. The Custom Application Name is set at the rule level - any application process that matches this rule will use the same custom name as the monitor name. Clicking the monitor name takes you to the corresponding APM monitor, where you can view performance metrics. Note: Restart the application after modifying the rules on the APM Process Monitoring Rules screen. |
| 3 | Host Name | The machine where the application process is running. |
| 4 | Command Line | Displays the command used to start the application process. |
| 5 | Directory | The application's working directory. |
| 6 | Rule Name | If a default rule matches, its name is displayed. If no rule matches, the Add Rule button is shown. Clicking Add Rule lets you create a rule to monitor the selected process group (application). You will be redirected to the Rules page, where you can modify the rule details if needed and click Create to finalize it. |
