Forecast Alerts
Overview
Forecast Alerts in Applications Manager help predict potential performance issues by analyzing historical metric data and identifying trends. It makes use of archived data to estimate future values of monitored attributes and helps notify/alert the users in advance before an issue could possibly occur. Instead of reacting only to current threshold breaches, forecast alerts proactively notify you when a metric is expected to cross a defined threshold in the near future. This enables teams to take preventive action before an actual performance degradation or outage occurs.
How forecast alerts work
Applications Manager uses historical performance data of a selected attribute and applies forecasting algorithms to estimate future values. Based on this prediction:
- If the forecasted value is expected to breach a defined threshold, an alert is generated.
- Alerts are triggered even before the actual threshold violation occurs.
- This helps in identifying gradual performance degradation trends.
Working with Forecast Alerts
Browse through the following topics to learn how to configure Forecast Alerts:
Configuring forecast alerts
To configure Forecast Alerts in Applications Manager, follow the steps given below:
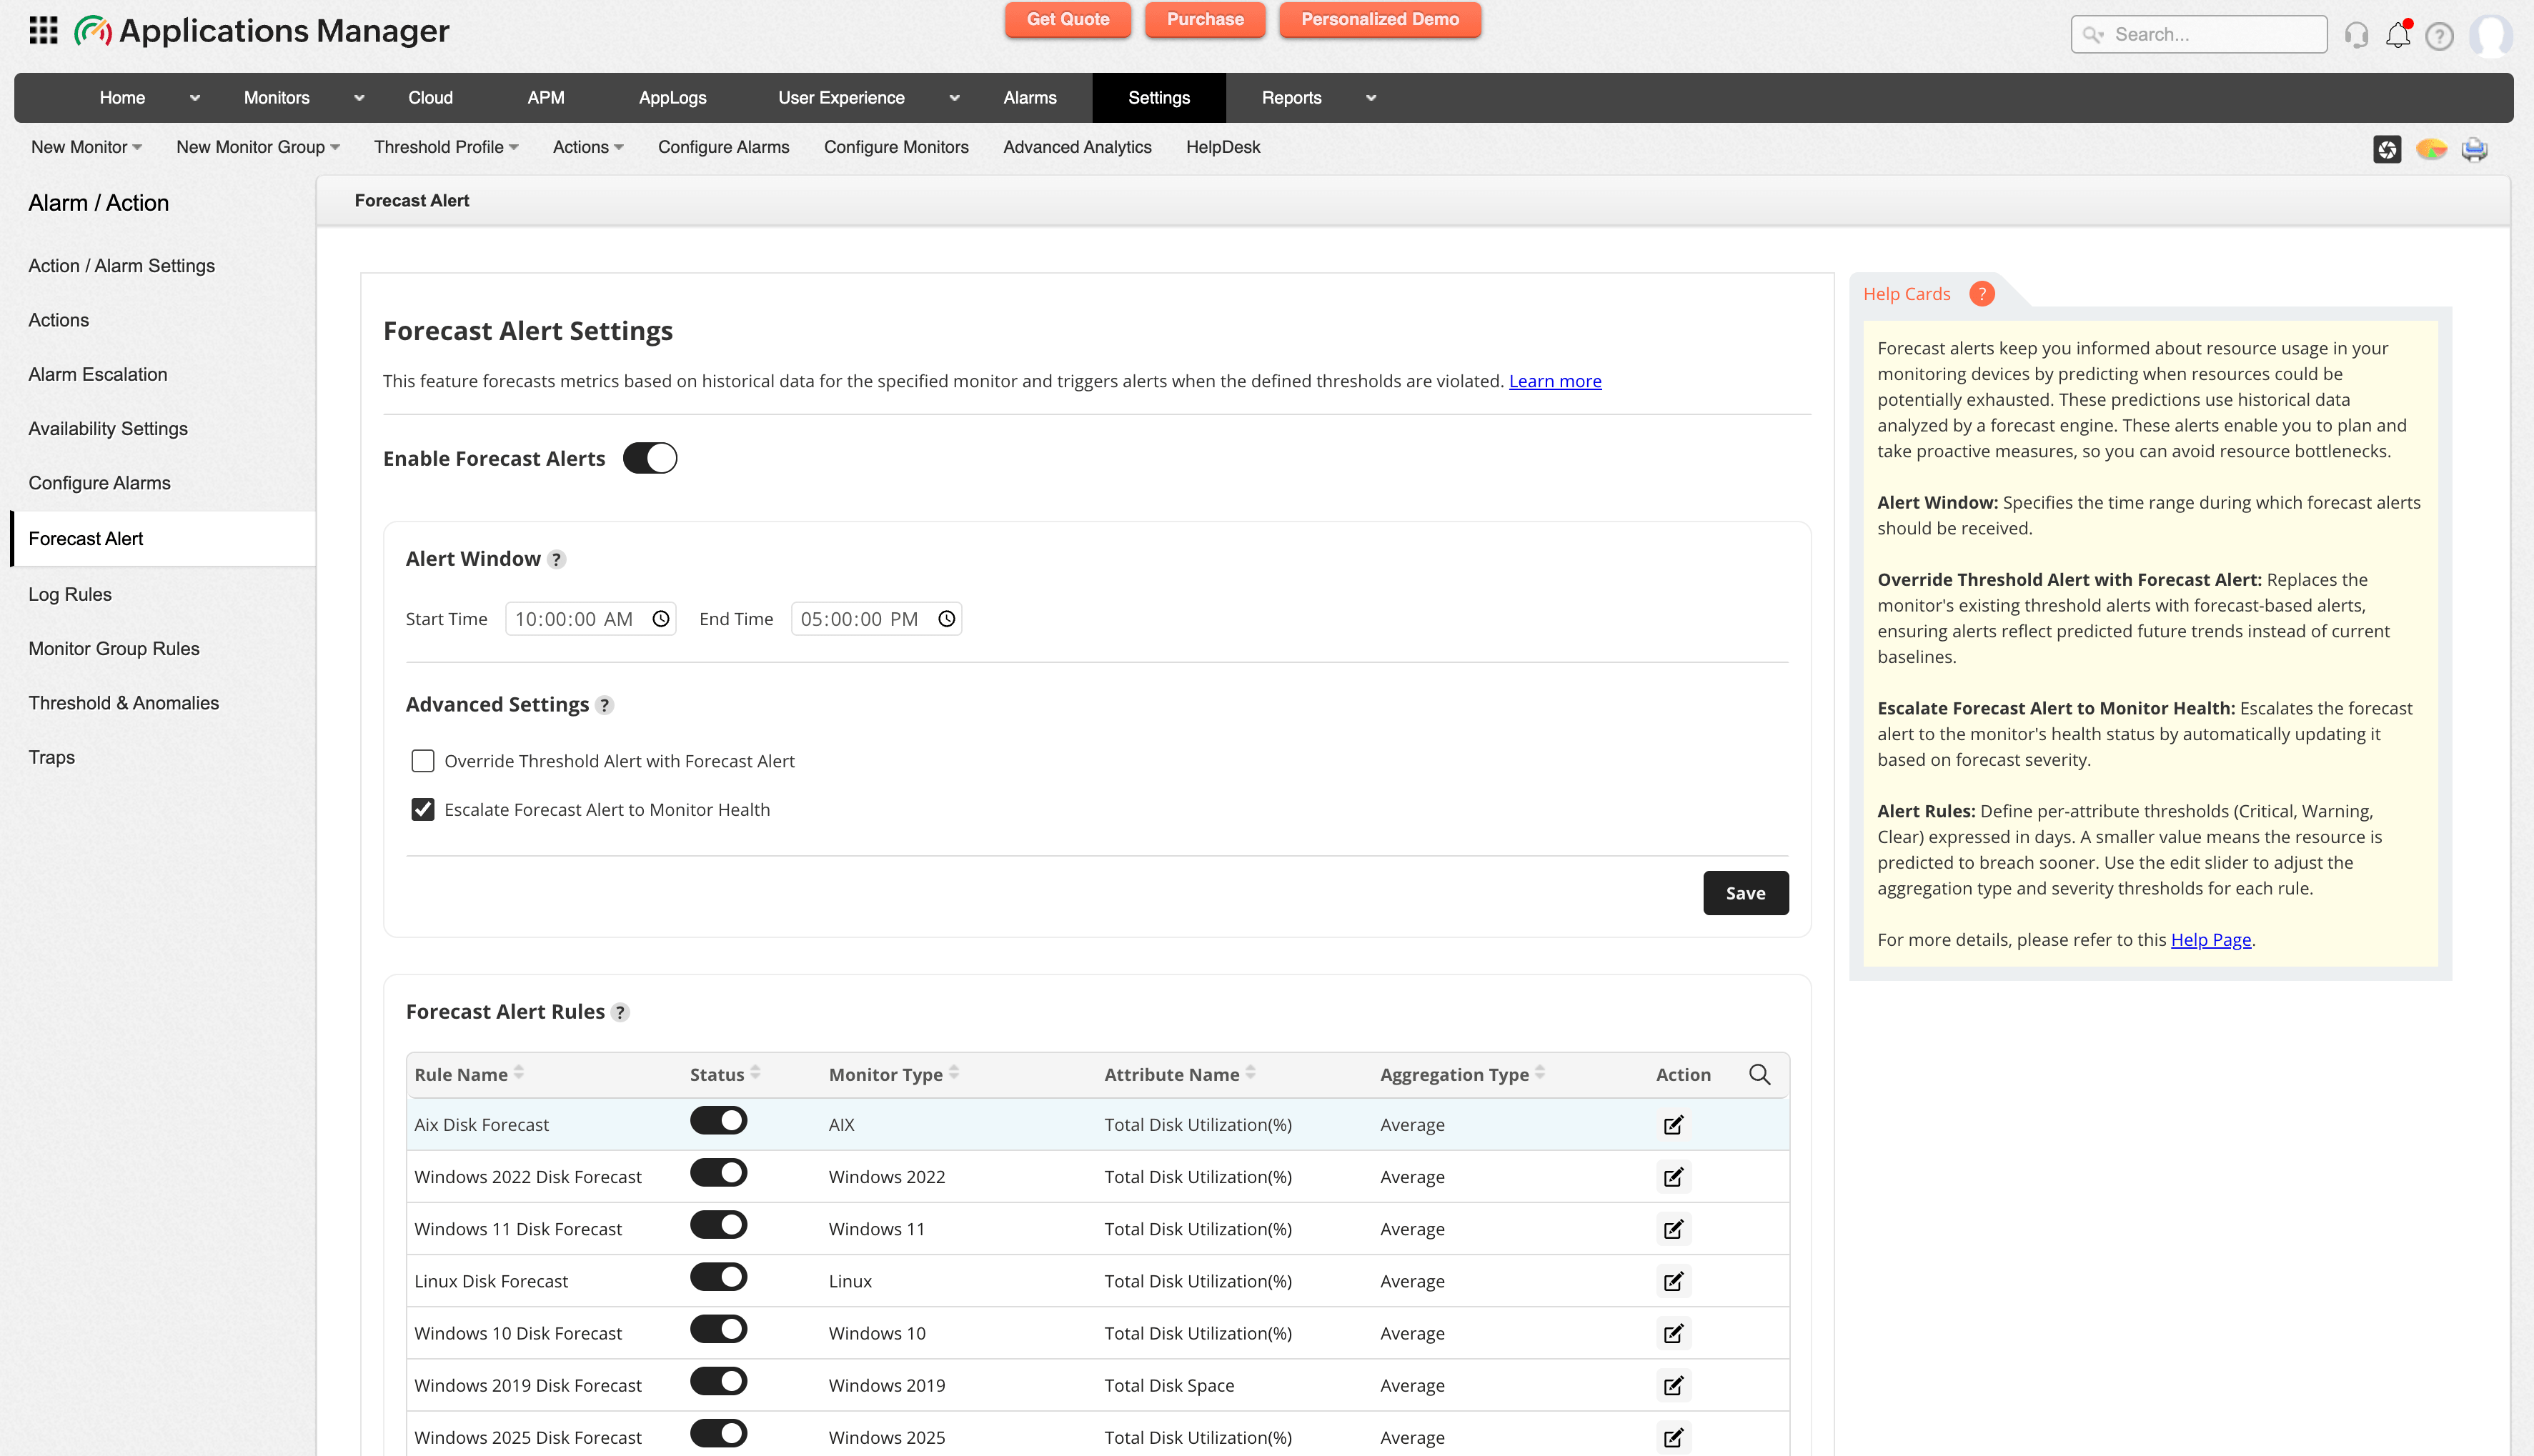
- In the Applications Manager web client, navigate to Settings -> Alarm / Action -> Forecast Alerts.
- Enable Forecast Alerts using the toggle button. By default, this option is enabled.
- Once enabled, configure the following options:
- Alert Window: Specify the time range during which forecast alerts should be evaluated and received. Learn more
- Override Threshold Alert with Forecast Alert: Replaces the monitor's existing threshold alerts with forecast-based alerts, ensuring alerts reflect predicted future trends instead of current baselines.
- Escalate Forecast Alert to Monitor Health: Escalates the forecast alert to the monitor's health status by automatically updating it based on forecast severity. By default, this option is enabled.
- Alert Rules: Define per-attribute thresholds (Critical, Warning, Clear) expressed in days. A smaller value means the resource is predicted to breach sooner. Use the edit slider to adjust the aggregation type and severity thresholds for each rule. Learn more
- Once all the above options are configured, save the configuration using the Save button.
Alert Window
Applications Manager periodically polls the monitors associated with alert rules and collects performance data over time. Using this historical data, the forecast engine runs daily during non-business hours (01:30 AM) to analyze trends and predict future metric behavior, including when a threshold breach is likely to occur. These predictions are not immediately generated as alerts. Instead, they are evaluated against a configured time period known as the alert window, which defines when you want to receive forecast-based notifications.
Typically, forecast alerts are triggered at the start time of the alert window. However, if the Applications Manager server is unavailable at that time (for example, due to maintenance or an unexpected shutdown), the alerts will be generated once the server is back online and operational. For this reason, it is important to configure an appropriate end time for the alert window to ensure that alerts are not missed.
Example:
If the alert window is configured from 10:00 AM to 05:00 PM, forecast alerts are normally generated at 10:00 AM. However, if the Applications Manager server is down at that time and comes back online at 11:00 AM, the alerts will be triggered at 11:00 AM, provided the time still falls within the configured alert window.
Alert Rules
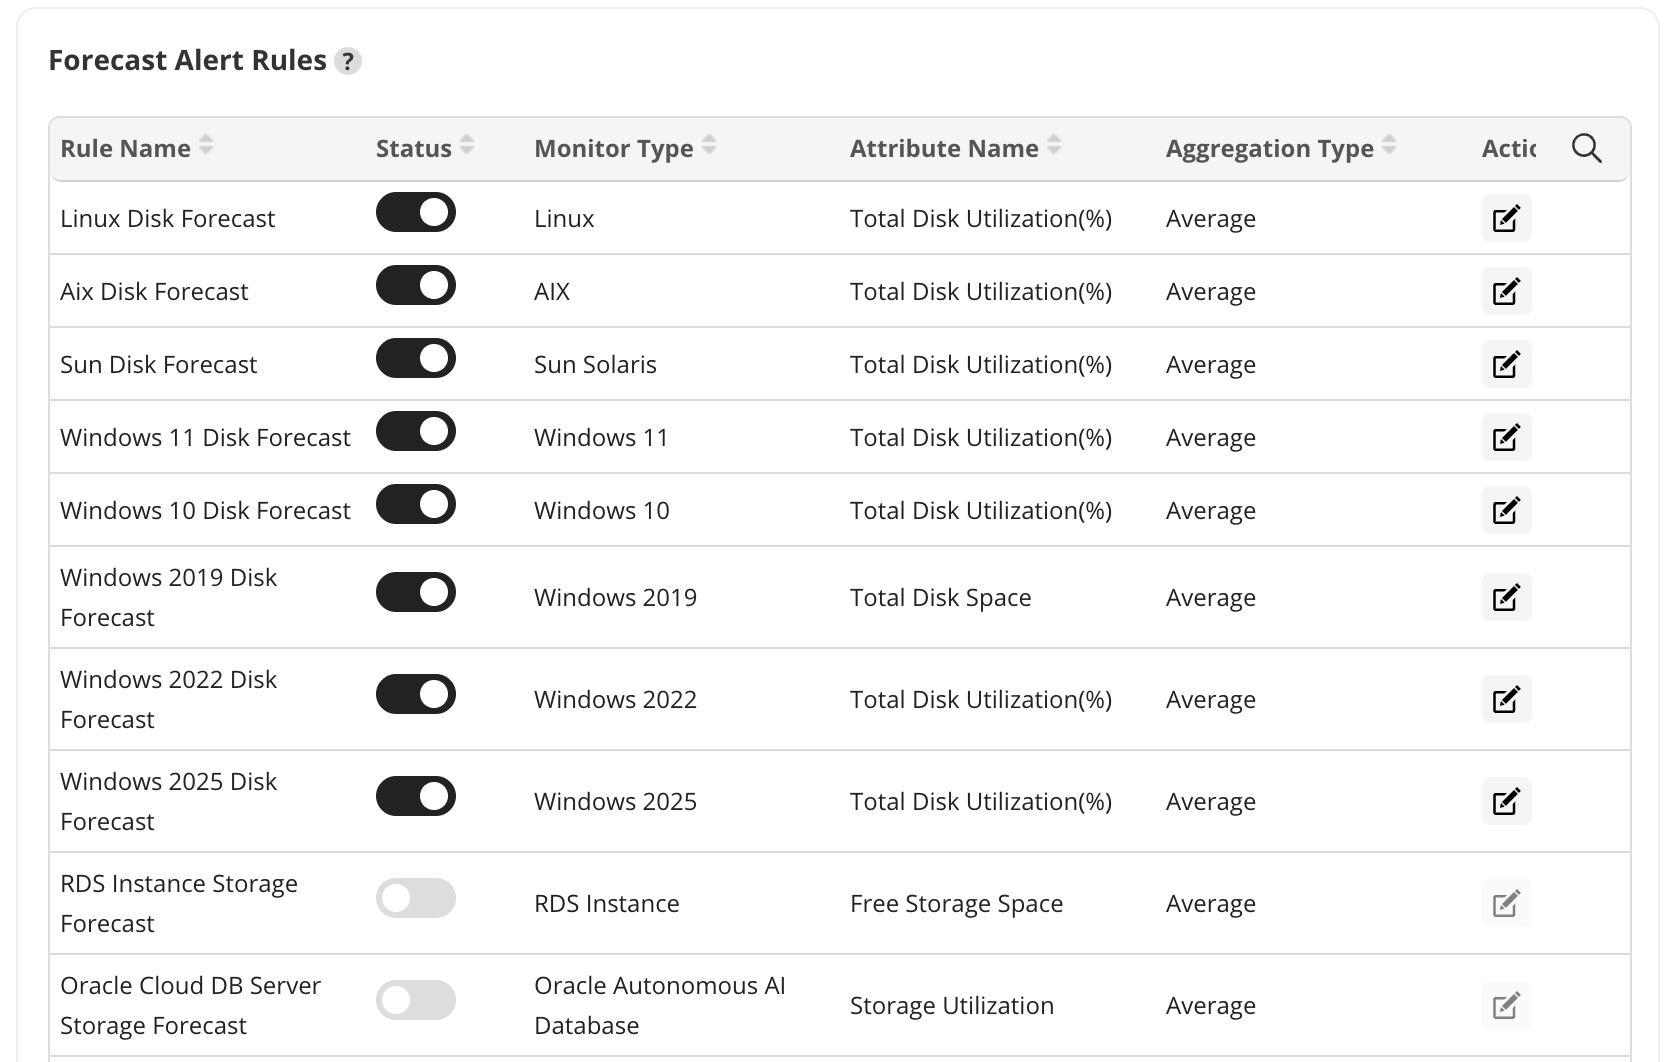
Forecast Alerts in Applications Manager are driven by alert rules, which define the resources to be monitored (for example, Disk Forecast, Memory Forecast, etc.). Each rule is associated with specific monitors that collect data for the corresponding resource. For instance, Disk Utilization monitors for disk forecasting, Memory Utilization monitors for RAM forecasting, and so on.
These predefined rules can be modified to suit your monitoring requirements. The following parameters can be configured:
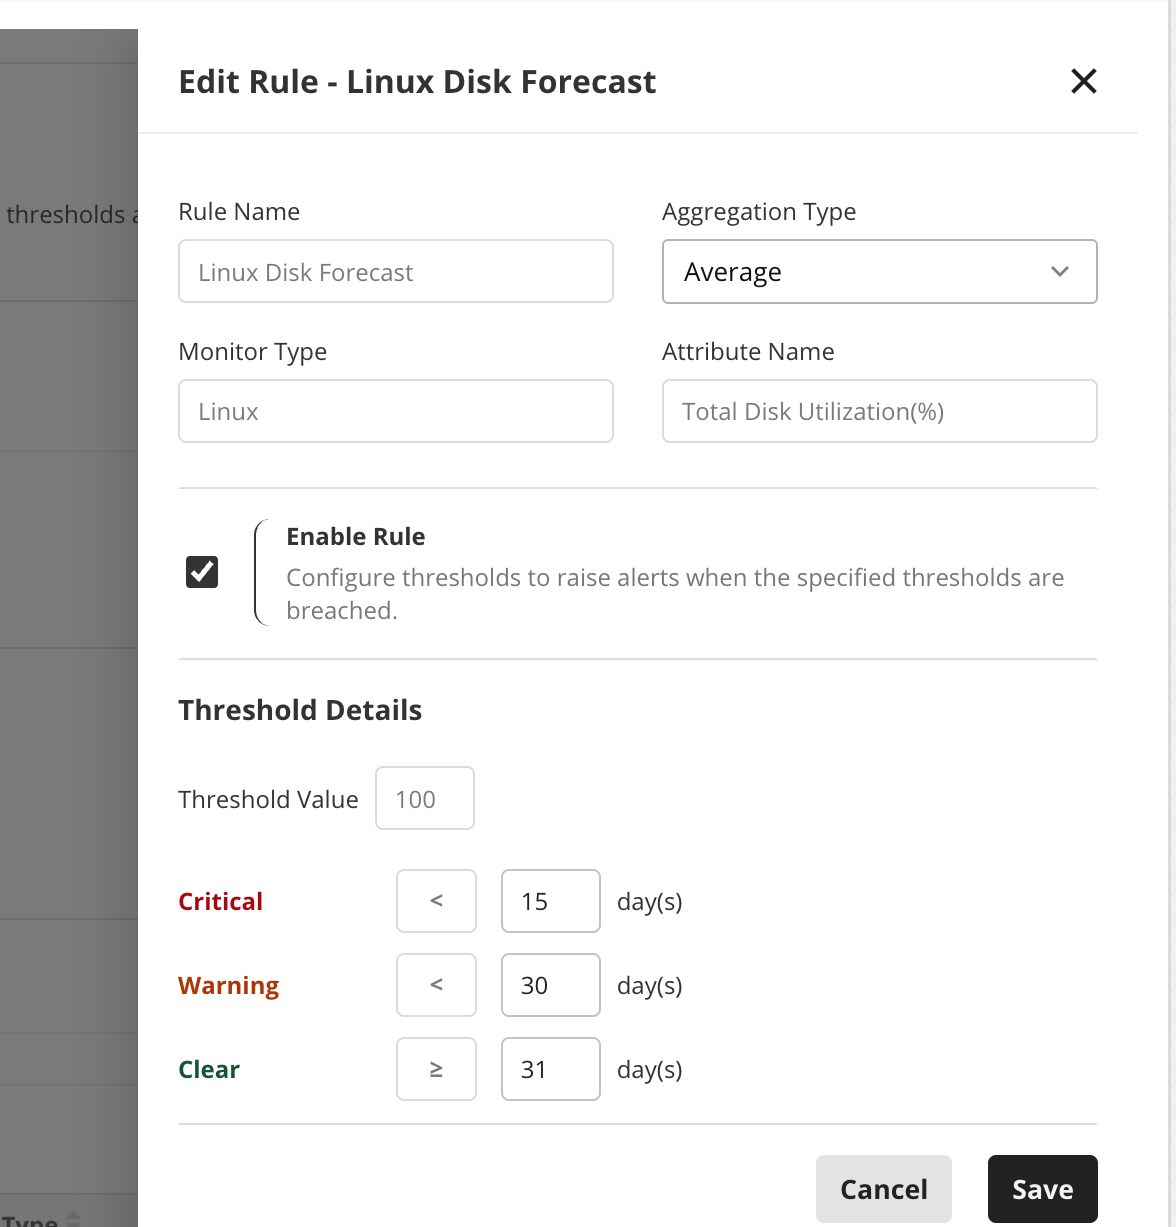
- Data Aggregate: Select the data aggregate to be used for forecasting. Applications Manager stores polled monitor data as MIN, MAX, and AVG values, and you can choose the appropriate aggregate based on your requirement.
- Enable Rule: Select this option if you wish to configure thresholds and raise alerts when the specified thresholds are breached.
- Threshold Details: Define the number of days corresponding to each alert severity. For example, configure a WARNING alert if a resource is expected to run out in 30 days and a CRITICAL alert if it is expected to run out in 15 days. You can also configure avalue to reset the alert severity to CLEAR when the predicted exhaustion duration exceeds the defined threshold (for example, beyond 31 days).
Once all the above parameters are specified, click Save to configure the alert rule for the required attribute for the monitor.
