Manage FSO Agents
The Applications Manager FSO Agent is a lightweight, unified agent that enables full-stack observability by monitoring both the performance and health of your servers and applications. It collects key performance metrics such as CPU usage, memory utilization, disk I/O, and network traffic. Log monitoring capabilities are provided through sub-agents such as AppLogs. Together, metrics and logs deliver real-time visibility, intelligent alerting, and faster troubleshooting across your infrastructure.
Note: The FSO Agent (Manage Server Monitoring Agent) feature is supported from Applications Manager version 175500 and later.
How to Deploy Monitoring Agents
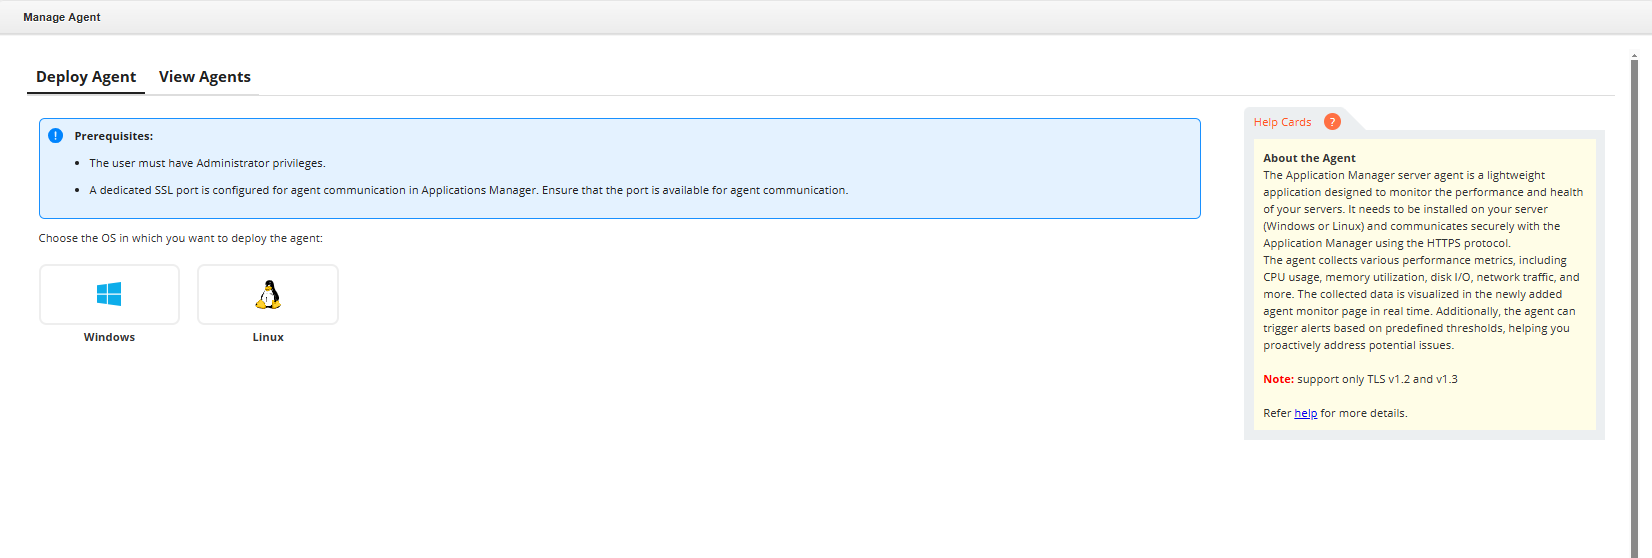
To deploy a new FSO Agent, follow the steps below:
- Go to Settings → Discovery & Data Collection → FSO Agent.
- Under the Deploy Agent section, choose the desired server type (Windows/Linux) and click Deploy.
- Follow the on-screen instructions to download, extract, and execute the installation script.
- Once installed, the agent automatically starts communicating with Applications Manager, and server monitoring begins.
Data Collection and Polling:
- Performance Data: Collected every 5 minutes by default.
- Configuration and Inventory Data: Collected hourly or whenever configuration changes occur. Inventory data is also sent within 5 minutes of an agent restart.
View Agents and Agent Actions
After successful installation, navigate to:
Settings → Discovery & Data Collection → FSO Agent → View Agents
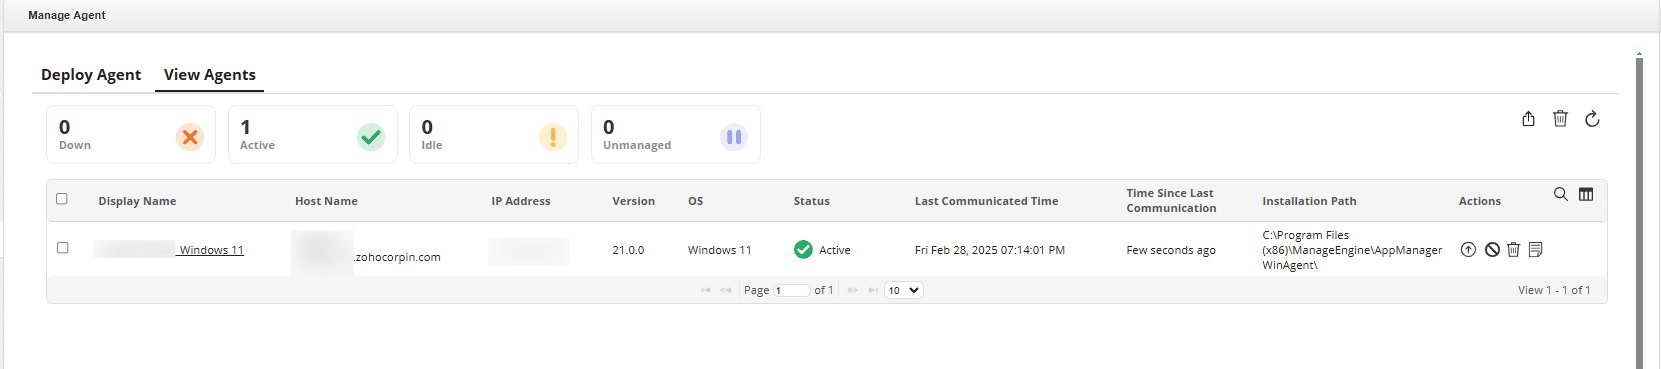
The View Agents page displays the following details:
- Display Name: Name of the server monitor.
- Host Name: Host machine where the agent runs.
- IP Address: Host machine IP address.
- Version: Installed agent version.
- OS: Operating system of the host.
- Status: Current communication state (e.g., Agent Communicating).
- Time Since Last Communication: Time elapsed since last contact.
- Installation Path: Directory where the agent is installed.
Supported Agent Actions
- Upgrade Agents: Upgrade selected agents to the latest available version.
- Manage/Unmanage Monitoring: Enable or disable monitoring without uninstalling the agent.
- Delete: Removes the agent from the Applications Manager console along with its associated monitors. This action does not uninstall the agent from the target machine.
- Export: Export agent details in PDF or Excel format.
- Agent Logs: Opens the Log Report page for troubleshooting communication and processing issues.
- SubAgents: Opens the Sub Agent Management panel to manage AppLogs and other supported sub-agents.
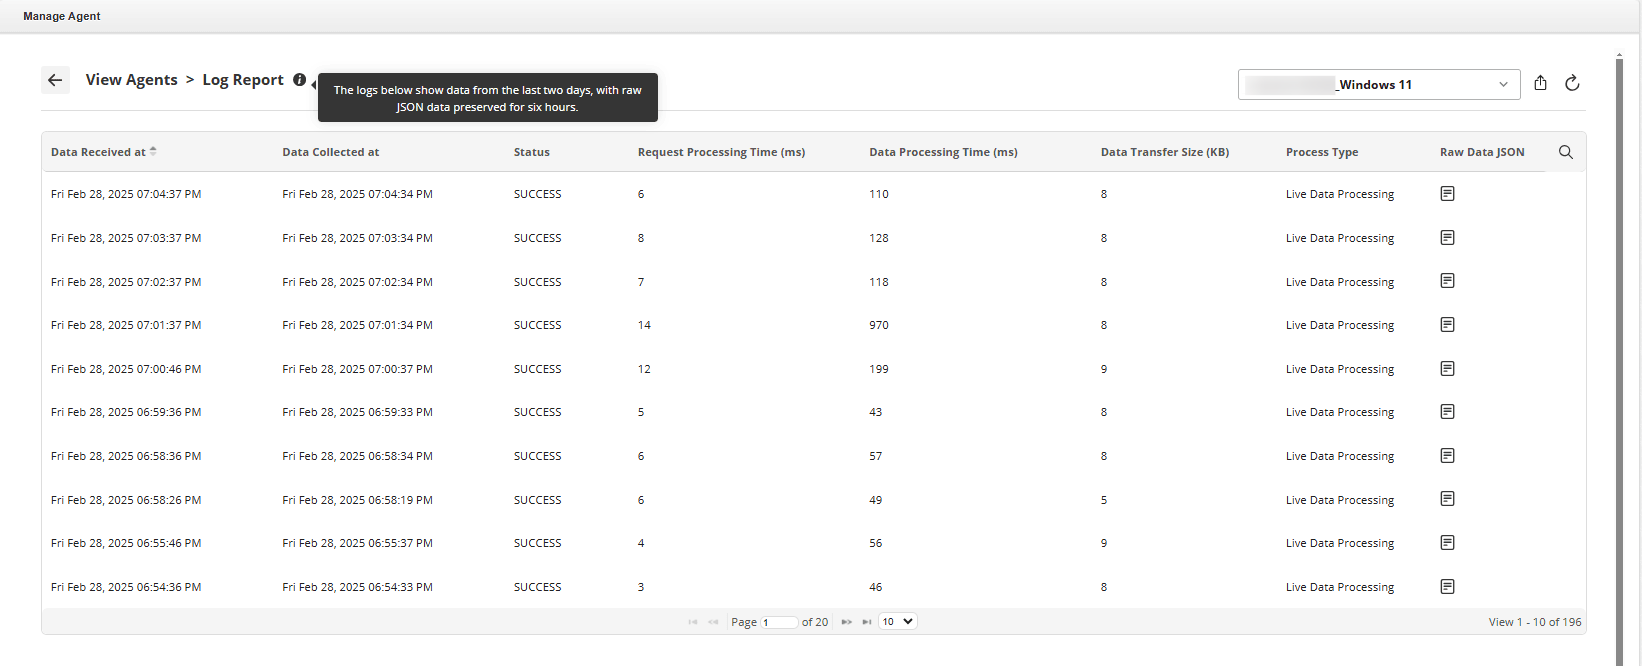
Note:
- The Log Report retains 2 days of log data and 6 hours of raw JSON data.
- Data Received Time is highlighted if delayed by more than 5 minutes.
After deploying and verifying the FSO Agent, you can enable the AppLogs sub-agent for centralized log monitoring.
How to Deploy AppLogs
AppLogs is a sub-agent of the FSO Agent that enables centralized log collection and monitoring for applications running on the server.
Note: The AppLogs feature is supported from Applications Manager v179400 and above.
You can enable the AppLogs sub-agent in either of the following ways:
Option 1: Enable During FSO Agent Installation
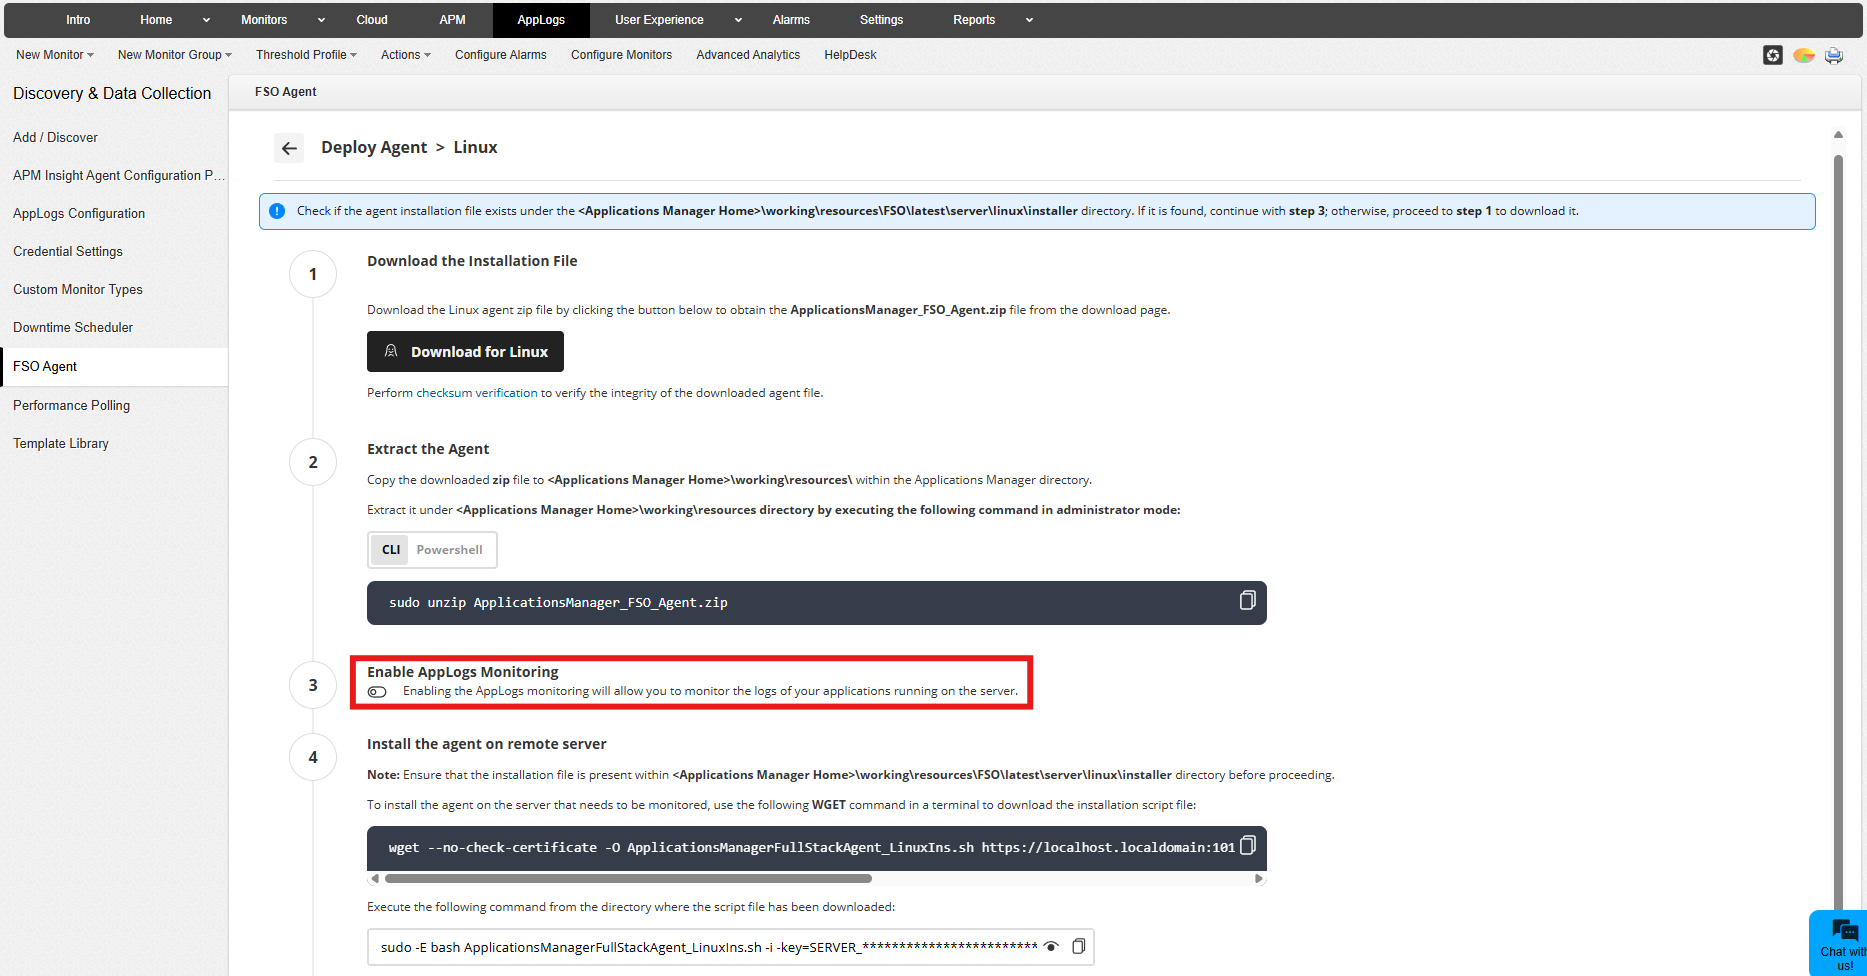
Enable AppLogs during the FSO Agent installation to activate log monitoring immediately after deployment.
- Windows: During FSO Agent installation, select the Enable AppLogs Monitoring Agent checkbox in the Windows InstallShield wizard.
- Linux: While installing the FSO Agent, enable the AppLogs sub-agent using the Enable AppLogs Monitoring Agent toggle option provided in the Linux installation steps within the Applications Manager UI.
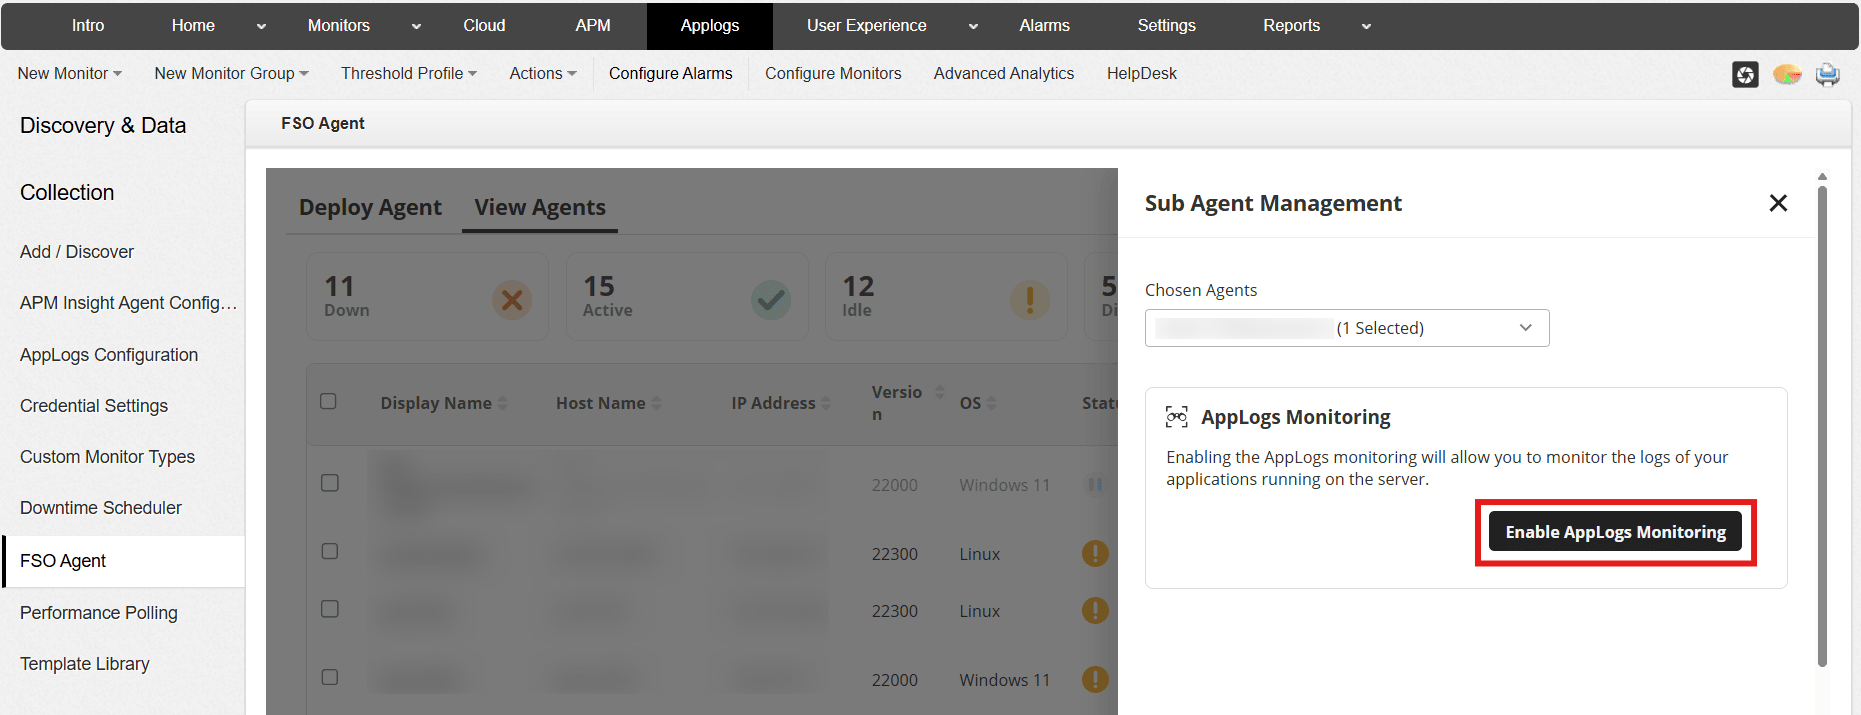
Option 2: Enable After Installation
- Navigate to Settings → Discovery & Data Collection → FSO Agent.
- Click on the View Agents tab.
- Select the required server.
- Open the Sub Agent Management panel.
- Under AppLogs Monitoring, click Enable.
- Confirm in the dialog box.
Note: Once installed, performance monitoring begins automatically. Log monitoring requires configuring the appropriate Log Type and Log Profile. Refer to the AppLogs Configuration page for detailed instructions.
Verify AppLogs Sub Agent Status
- Status is displayed as Enabled.
- Last Communicated Time indicates the most recent heartbeat from the AppLogs sub-agent.
Supported Actions in AppLogs Sub Agent
The following actions are available from the Sub Agent Management panel:
- Enable: Activates log collection from configured applications and system log sources on the server.
- Disable: Stops log collection without affecting performance monitoring by the main FSO Agent.
- Restart: Restarts the AppLogs service to resolve temporary communication or ingestion issues.
- Upgrade: Updates the AppLogs sub-agent to the latest compatible version without reinstalling the FSO Agent.
- Report: Displays a table with recent AppLogs activity, including Log Type, Data Received Time, Log Indexed Time, Request Processing Time, Log Processing Time, Logs Indexed, and Data Transfer (KB). The report can be exported in PDF or Excel format for troubleshooting connectivity or log ingestion issues.
Upgrading the FSO Agent
Applications Manager allows you to upgrade the FSO (Full-stack Observability) Agent directly from the Applications Manager console. Before initiating the upgrade, the latest agent package must be downloaded and placed in the appropriate directory on the Applications Manager server.
Applications Manager will send the upgrade request to the FSO Agent. The agent will then download and apply the update automatically. The FSO agent upgrade can be performed using the following methods:
- Global upgrade: Allows you to upgrade the entire agent framework along with all its associated sub-agent modules, including servers and application logs (applogs) by clicking on the FSO Upgrade button located at the top right corner of the table, under Settings -> FSO Agent -> View Agents tab.
- Sub-agent upgrade: Allows you to upgrade the required sub-agent modules alone in the FSO agent. This can be performed by navigating to Sub-agents option and clicking on Upgrade for the required modules to be updated. For server sub-agent upgrade, clicking on the Upgrade option located adjacent to the respective agent hosts will initiate the upgrade process.
- To upgrade a single server agent, click the Upgrade option available next to the respective agent host.
- To upgrade multiple server agents, select the required hosts and click the Upgrade option located next to the Deploy Agent button in the top-right corner of the table.
The server-based agent upgrade will be performed based on the files available in the following directory for respective OS-based agents based on the operating system of the monitored server:
For Windows-based agents:
<Applications Manager Home>\working\resources\FSO\latest\server\windows\upgrade
For Linux-based agents:
<Applications Manager Home>/working/resources/FSO/latest/server/linux/upgrade
Note: The path to place the downloaded agent package remains the same as specified in the FSO agent upgrade steps.
Follow the steps below to upgrade the FSO Agent in Applications Manager:
Step 1: Download and extract the agent package
- Navigate to the Settings -> FSO Agent -> View Agents page in Applications Manager.
- In the Actions column corresponding to the agent you want to upgrade, click the Upgrade icon.
- A prerequisite pop-up message will appear instructing you to download the latest agent package and place it in the Applications Manager-installed directory.
- Download the latest FSO Agent (ApplicationsManager_FSO_Agent.zip) package from the agent download page.
- Place the downloaded zip file in the <Applications Manager Home>/working/resources directory and extract the package.
Step 2: Initiate the Agent Upgrade
- Return to the View Agents page.
- Click the FSO Upgrade button available at the top right corner of the table to initiate the agent upgrade process.
- A confirmation message "Agent upgrade action initiated" will be displayed.
Step 3: Verify the Upgrade
Once FSO agent upgrade is completed, verify whether the Agent Version displayed on the View Agents page matches the newly upgraded version.
Note:
- Refer to the FSO Agent Release History page to select the appropriate agent version for upgrade.
- Ensure that the latest agent package is downloaded and extracted in the correct directory before initiating the upgrade.
- The upgrade process may take a few minutes depending on the agent connectivity and system resources.
- The agent must be running and reachable from the Applications Manager server for the upgrade to complete successfully.
