Microsoft Azure Kubernetes Service (AKS) Monitoring
Overview
Azure Kubernetes Service (AKS) offers server-less Kubernetes, an integrated continuous integration and continuous delivery (CI/CD) experience and enterprise-grade security and governance. Azure Kubernetes Service (AKS) simplifies deploying a managed Kubernetes cluster in Azure by offloading the operational overhead to Azure. As a hosted Kubernetes service, Azure handles critical tasks, like health monitoring and maintenance.
Since Kubernetes masters are managed by Azure, you only manage and maintain the agent nodes. Thus, AKS is free; you only pay for the agent nodes within your clusters, not for the masters. It allows you to rapidly build, deliver and scale applications. Applications Manager's Azure Kubernetes Service monitoring tool provides visibility into the health, performance, and behavior of Kubernetes clusters, enabling administrators to ensure the reliability and efficiency of containerized applications running on AKS.
Creating a new Microsoft Azure Kubernetes Service monitor
To learn how to create a new Microsoft Azure Kubernetes Service monitor click here.
Monitored Parameters
Navigate to the Category View by clicking the Monitors tab. Hover over 'Child Monitors' under Microsoft Azure in the Cloud Apps table, and then select the Kubernetes Service monitor from the displayed tooltip. This action will display the bulk configuration view for Azure Kubernetes Service in three tabs:
- Availability tab gives the availability history for the past 24 hours or 30 days.
- Performance tab gives the health status and events for the past 24 hours or 30 days.
- List view tab enables you to perform bulk admin configurations.
The Microsoft Azure monitor provides a brief detail of the Azure Kubernetes Service under the given subscription. Following are the list of metrics monitored in Azure Kubernetes Service Monitoring in their corresponding tabs:
- If a node is not in the 'Ready' state, the availability of the node will be automatically affected. Also, the health of the node in the monitor is dependent on the following parameters by default and alerts can be configured for the same under Settings → Performance Polling → Optimize Data Collection → Azure Kubernetes Service:
- AKS Node Memory Pressure
- AKS Node Disk Pressure
- AKS Node PID Pressure
- AKS Node Out of Disk
- AKS Node Network Unavailable
- From Applications Manager Version 178200, data collection via Container Insight is not supported due to metrics deprecation.
- For successful data collection, ensure performing all the required prerequisites.
Overview
| Parameter | Description | Data Collection Method | ||
|---|---|---|---|---|
Kubectl | Azure Monitor | |||
| CLUSTER INFORMATION | ||||
| Cluster Status | Current status of the cluster. (Running, Stopped) |  |  | |
| Cluster FQDN | The Azure Resource Name (ARN) of the cluster. | | | |
| Cluster Location | Location where the cluster resides. | | | |
| Cluster Kubernetes Version | Kubernetes version of the cluster server. | | | |
| CLUSTER DETAILS | ||||
| Git Version | Git version of the cluster. | | | |
| Build Date | Build date of the cluster. | | | |
| Compiler | Name of the compiler used. | | | |
| Platform | OS Platform of the cluster. | | | |
| NAMESPACE DETAILS | ||||
| Namespace UUID | UUID of the namespace. | | | |
| Namespace Name | Name of the namespace | | | |
| Pods Count | Number of pods count in the namespace at the time of polling. | | | |
| Running pods in namespace | Number of running pods under the namespace at the time of polling. | | | |
| Pending Pods | Number of pending pods under the namespace at the time of polling. | | | |
| Succeeded Pods | Number of succeeded pods under the namespace at the time of polling. | | | |
| Failed Pods | Number of failed pods under the namespace at the time of polling. | | | |
| Unknown Pods | Number of unknown pods under the namespace at the time of polling. | | | |
| Restarting Container Count | Number of containers restarted count in the namespace at the time of polling. | | | |
| OOMKilled Container Count | Total number of OOMKilled containers by namespace. | | | |
| Pods Ready | Percentage of the number of pods that are in ready stage at the time of polling. | | | |
| Namespace Resource Version | The version number of Namespace | | | |
| Namespace Availability | Availability of Namespace | | | |
| Namespace Created Time | Timestamp at which the Namespace was created | | | |
| CLUSTER AUTOSCALER DETAILS (Applicable only when cluster autoscaler is enabled) | ||||
| Cluster Scaledown Cooldown | Determines if the scale down is in cooldown. No nodes will be removed during this timeframe at the time of polling. | | | |
| Cluster UnNeeded Nodes | Cluster autoscaler marks those nodes as candidates for deletion and are eventually deleted at the time of polling | | | |
| Cluster UnSchedulable Pods | Number of pods that are currently unschedulable in the cluster at the time of polling. | | | |
| Cluster Health | Determines the health of the autoscaler at the time of polling. | | | |
| CLUSTER CPU & MEMORY DETAILS | ||||
| Available Cluster CPU Cores | Total number of available CPU cores in the cluster at the time of polling. | | | |
| Available Cluster Memory | Total number of available Memory in the cluster at the time of polling. | | | |
| NODE DETAILS | ||||
| Master Nodes | Number of master nodes available in the cluster. | | | |
| Worker Nodes | Number of worker nodes available in the cluster. | | | |
| CLUSTER USAGE DETAILS | ||||
| Avg. CPU Usage | Average amount of CPU used by the cluster (in %). | | | |
| Avg. Memory Usage | Average amount of memory used by the cluster (in %). | | | |
| NODE COUNT DETAILS | ||||
| Nodes Ready | Number of nodes that are in ready stage at the time of polling. | | | |
| Nodes Not Ready | Number of nodes that are not in ready stage at the time of polling. | | | |
| Top 5 Nodes by Used Pods - Displays a graphical representation of top 5 nodes with respect to the number of pods used. | ||||
| PODS | ||||
| Used pods in cluster % | Percentage of the number of pods used. | | | |
| Used pods in cluster | Number of pods used in the cluster. | | | |
| Maximum pods in cluster | Maximum number of pods available in the cluster. | | | |
| Pods Ready in cluster | The average number of pods in the ready state at the time of polling. | | | |
| PODS PHASE | ||||
| Total Failed Pods | Total number of pods failed in the cluster at the time of polling. | | | |
| Total Pending Pods | Total number of pods pending in the cluster at the time of polling. | | | |
| Total Running Pods | Total number of pods running in the cluster at the time of polling. | | | |
| Total Unknown Pods | Total number of pods unknown in the cluster at the time of polling. | | | |
| Total Succeeded Pods | Total number of pods succeeded in the cluster at the time of polling. | | | |
| API SERVER INFLIGHT REQUESTS | ||||
| API Server Inflight Requests | The average of the maximum number of currently used inflight requests on the API server between the poll interval. | | | |
| API SERVER USAGE (%) | ||||
| API Server CPU Usage | The average of maximum CPU percentage (based off current limit) used by the API server pod across instances at the time of polling (in %). | | | |
| API Server Memory Usage | The average of maximum memory percentage (based off current limit) used by the API server pod across instances at the time of polling (in %). | | | |
| ETCD USAGE (%) | ||||
| ETCD CPU Usage | The average of maximum CPU percentage (based off current limit) used by the ETCD pod across instances at the time of polling (in %). | | | |
| ETCD Memory Usage | The average of maximum memory percentage (based off current limit) used by the ETCD pod across instances at the time of polling (in %). | | | |
| ETCD Database Usage | The average of maximum utilization percentage of the ETCD database across instances at the time of polling (in %). | | | |
*Note: API SERVER INFLIGHT REQUESTS, API SERVER USAGE (%) and ETCD USAGE (%) group metrics are mapped under Performance Polling. To adjust the polling interval, navigate to Settings → Performance Polling. In the Optimize Data Collection tab, select Azure Kubernetes Service as the Monitor Type and Component Metrics as the Metric Name. Then set Default Polling Status as required, by default opted as Never collect data.
Node Pool
| Parameter | Description | Data Collection Method | ||
|---|---|---|---|---|
Kubectl | Azure Monitor | |||
| Node Pool Details* | ||||
| Name | Name of the node pool. | | | |
| Status | The current status of the managed node pool. Possible values: Running/Stopped. | | | |
| VM Size | The size of the agent pool VMs. VM size availability varies by region. | | | |
| Kubernetes Version | The version of Kubernetes running on the agent pool. | | | |
| Image Version | The version of node pool image. | | | |
| Minimum Node Size (Auto-Scaling) | The minimum number of nodes for auto-scaling. | | | |
| Maximum Node Size (Auto-Scaling) | The maximum number of nodes for auto-scaling. | | | |
| Maximum Pods Count | The maximum number of pods that can run on a node. | | | |
| Node Pool Utilization* | ||||
| Name | Name of the node pool. | | | |
| OS Type | The operating system type. Default value: Linux. | | | |
| OS SKU | Specifies an OS SKU. This value must not be specified if OS type is Windows. | | | |
| OS Disk Type | The OS disk type to be used for machines in the agent pool. | | | |
| OS Disk Size | Size of the OS Disk to be used to specify the disk size for every machine in the master/agent pool (in GB). | | | |
| CPU Usage | Average CPU utilization measured across the node pool over a specified poll interval (in %). | | | |
| Disk Usage | Disk space used for node pool over a specified poll interval (in %). | | | |
| Memory RSS Usage | Container RSS memory used for node pool over a specified poll interval (in %). | | | |
| Memory WS Usage | Container working set memory used for node pool over a specified poll interval (in %). | | | |
*Note: Azure Monitor metrics are not available for Windows node pool.
Node
| Parameter | Description | Data Collection Method | |
|---|---|---|---|
Kubectl | Azure Monitor | ||
| Top 5 Nodes by Memory Details - Displays a graphical representation of top 5 nodes with respect to their corresponding memory details (in %). | |||
| Top 5 Nodes by CPU Details - Displays a graphical representation of top 5 nodes with respect to their corresponding CPU details (in %). | |||
| Node Usage Details* | |||
| Node Name | Name of the node. | | |
| CPU Usage Millicores | Average CPU utilization in millicores across the node over a specified poll interval. | | |
| CPU Usage (%) | Average CPU utilization measured across the node over a specified poll interval (in %). | | |
| Disk Usage (GB) | Disk space used for node over a specified poll interval (in GB). | | |
| Disk Usage (%) | Disk space used for node over a specified poll interval (in %). | | |
| Memory RSS Usage (GB) | Container RSS memory used for node over a specified poll interval (in GB). | | |
| Memory RSS Usage (%) | Container RSS memory used for node over a specified poll interval (in %). | | |
| Memory WS Usage (GB) | Container working set memory used for node over a specified poll interval (in GB). | | |
| Memory WS Usage (%) | Container working set memory used for node over a specified poll interval (in %). | | |
| Network In Usage | Amount of data received by the network for the node over a specified poll interval (in MB). | | |
| Network Out Usage | Amount of data transmitted by the network for the node over a specified poll interval (in MB). | | |
| Node Pod Details | |||
| Node Name | Name of the node. | | |
| Pod Usage | Number of pods available for usage with used and free pods split-up. | | |
| Used Pods | Number of pods that are used in the node. | | |
| Free Pods | Number of pods that are free in the node. | | |
| Allocatable Pods | Number of pods that are allocatable in the node. | | |
| Kube-system Pod Count | Number of Kube state pods in the node. | | |
| Non-Kube-system Pod Count | Number of non-Kube state pods in the node. | | |
| Images | Number of images present in the node. | | |
| NODE DETAILS | |||
| Node Name | Name of the node. | | |
| OS Image | OS Image name of the node. | | |
| OS | Name of the OS in which the container is deployed. | | |
| Architecture | Architecture details of the node. | | |
| Type | Type of node used. | | |
| Kubelet Version | The version of Kubelet used. | | |
| Allocatable Ephemeral Storage | Size of temporary memory available (in GiB). | | |
| Created Time | Timestamp at which the node was created. | | |
*Note: Azure Monitor metrics are not available for Windows node.
Pods
| Parameter | Description | Data Collection Method | |||||||||
|---|---|---|---|---|---|---|---|---|---|---|---|
Kubectl | Azure Monitor | ||||||||||
| Pod Details | |||||||||||
| Pod UUID | Universal unique ID of the pod. | | | ||||||||
| Pod Name | Name of the pod. | | | ||||||||
| Pod Namespace | Namespace in which the pod resides. | | | ||||||||
| Pod CPU Used (millicores) | The amount of CPU consumed by the pod (in millicores). | | | ||||||||
| Pod CPU Usage (%) | The percentage of CPU utilized by the pod. | | | ||||||||
| Pod Memory Used (MiB) | The amount of memory used by the pod (in MiB). | | | ||||||||
| Pod Memory Usage (%) | The percentage of memory utilized by the pod. | | | ||||||||
| Pod Node Name | Name of the pod-node. | | | ||||||||
| Pod Application | Name of the pod application. | | | ||||||||
| Pod Type | Type of pod used. | | | ||||||||
| Pod created | Medium by which the pod was created. | | | ||||||||
| Pod Status | Status of the pod. Possible values:
| | | ||||||||
| Pod Age | Amount of time elapsed since the pod was created (in days). | | | ||||||||
| Pod Start Time | Timestamp at which the pod was started. | | | ||||||||
| Pod Created Time | Timestamp at which the pod was created. | | | ||||||||
| Top 10 Pods by Memory Details - Displays a graphical representation of top 10 pods with respect to their corresponding memory details (in %). | |||||||||||
| Top 10 Pods by CPU Details - Displays a graphical representation of top 10 pods with respect to their corresponding CPU details (in %). | |||||||||||
| Pod Usage Details | |||||||||||
| Pod UUID | Universal unique ID of the pod. | | | ||||||||
| Pod Name | Name of the pod. | | | ||||||||
| Pod Namespace | Namespace in which the pod resides. | | | ||||||||
| Pod Containers Count | The number of containers run by the pod. | | | ||||||||
| Pod CPU Limit(millicores) | The maximum amount of CPU resources that all containers in a Pod are allowed to use collectively (in millicores). If 0, no limit is set, then pod can use CPU upto the node capacity. | | | ||||||||
| Pod CPU Limit(%) | The maximum amount of CPU resources that all containers in a Pod are allowed to use collectively (in %). It is the sum of the CPU limits set on each container within the Pod. The Kubernetes kubelet enforces this limit to ensure the Pod does not exceed the specified CPU usage on the node. If a container tries to use more CPU than its limit, it will be throttled. | | | ||||||||
| Pod CPU Request (millicores) | The guaranteed minimum amount of CPU resources that all containers in a Pod collectively request (in millicores). If 0, no CPU is guaranteed and it can use CPU only if the node has free capacity. | | | ||||||||
| Pod CPU Request(%) | The guaranteed minimum amount of CPU resources that all containers in a Pod collectively request (in %). It is the sum of the CPU requests of all containers in the Pod. Kubernetes uses this value to schedule the Pod onto a node that has enough CPU capacity to meet the request. | | | ||||||||
| Pod Memory Limit(in MiB) | The maximum amount of memory (RAM) that all containers in a Pod can use collectively (in MiB).If 0, no limit is set, then pod can use memory upto the node capacity. | | | ||||||||
| Pod Memory Limit(in %) | The maximum amount of memory (RAM) that all containers in a Pod can use collectively (in %). It is the sum of the memory limits of all containers in the Pod. The kubelet enforces this limit; if a container exceeds its memory limit, it may be terminated. | | | ||||||||
| Pod Memory Request (in MiB) | The minimum amount of memory that all containers in a Pod request collectively (in MiB). If 0, no CPU is guaranteed and it can use memory only if the node has free capacity. | | | ||||||||
| Pod Memory Request (in %) | The minimum amount of memory that all containers in a Pod request collectively (in %). It is the sum of the memory requests of all containers in the Pod. Kubernetes uses this value to schedule the Pod onto a node that has enough available memory to satisfy the request.. | | | ||||||||
| Pod created | Medium by which the pod was created. | | | ||||||||
| Pod Persistent Volumes Claim | Name of the Claim through which a pod can access the persistent volume. | | | ||||||||
| Container Details | |||||||||||
| Container ID | ID of the container. | | | ||||||||
| Container Name | Name of the container. | | | ||||||||
| Container Image | Name of the container image. | | | ||||||||
| Container Pod Name | Name of the container pod. | | | ||||||||
| Container Restarts | The number of times the container has restarted. | | | ||||||||
| Container Status | Status of the container. Following are the list of possible values that are shown for each status:
| | | ||||||||
| Container Age | Amount of time elapsed since the container was started (in days). | | | ||||||||
| Container Start Time | Timestamp at which the container was started. | | | ||||||||
Services
| Parameter | Description | Data Collection Method | |
|---|---|---|---|
Kubectl | Azure Monitor | ||
| Service Details | |||
| Service UUID | Universal unique ID of the service. | | |
| Service Name | Name of the service. | | |
| Service Namespace | Name of the Namespace in which the service resides. | | |
| Application | Name of the service application. | | |
| Service Type | Type of the service. | | |
| Service Protocol | Name of the service protocol. | | |
| Host IP Address | IP address of the service host. | | |
| Service Target Port | Name of the port that connects with the service. | | |
| Created Time | Timestamp at which the service was created. | | |
| Deployment Details | |||
| Deployment UUID | Universal unique ID of the deployment. | | |
| Deployment Name | Name of the deployment. | | |
| Deployment Namespace | Namespace where the deployment exists. | | |
| Deployment Replicas | The number of replicas in a deployment. | | |
| Deployment Available Replicas | Number of available replicas in a deployment. | | |
| Deployment Availability | Availability of the deployment. | | |
Persistent Volumes
| Parameter | Description | Data Collection Method | |
|---|---|---|---|
Kubectl | Azure Monitor | ||
| PERSISTENT VOLUMES (PV) DETAILS | |||
| PV UUID | Universal unique ID of the Persistent Volume. | | |
| PV Name | Name of the Persistent Volume. | | |
| PV Status | Status of the Persistent Volume. Possible values:
| | |
| PV Claim | Name of the Persistent Volume Claim. | | |
| PV Access Mode | The mode through which you can access the Persistent Volume. | | |
| PV Storage Class | Name of the Persistent Volume storage class. | | |
| PV Capacity | The capacity of the Persistent Volume (in GiB). | | |
| PV Created Time | Timestamp at which the Persistent Volume was created. | | |
| PERSISTENT VOLUMES CLAIM (PVC) DETAILS | |||
| PVC UUID | Universal unique ID of the Persistent Volume Claim. | | |
| PVC Name | Name of the Persistent Volume Claim. | | |
| PVC Namespace | Name of the Namespace in which the Claim exists. | | |
| PVC Status | Status of the Persistent Volume Claim. Possible values:
| | |
| PV Name | Name of the Persistent Volume. | | |
| PVC Access Mode | The mode through which you can access the Persistent Volume Claim. | | |
| PVC Storage Class | Name of the Persistent Volume Claim storage class. | | |
| PVC Requests | Number of Persistent Volume Claim requests (in GiB). | | |
| PVC Created Time | Timestamp at which the Persistent Volume Claim was created. | | |
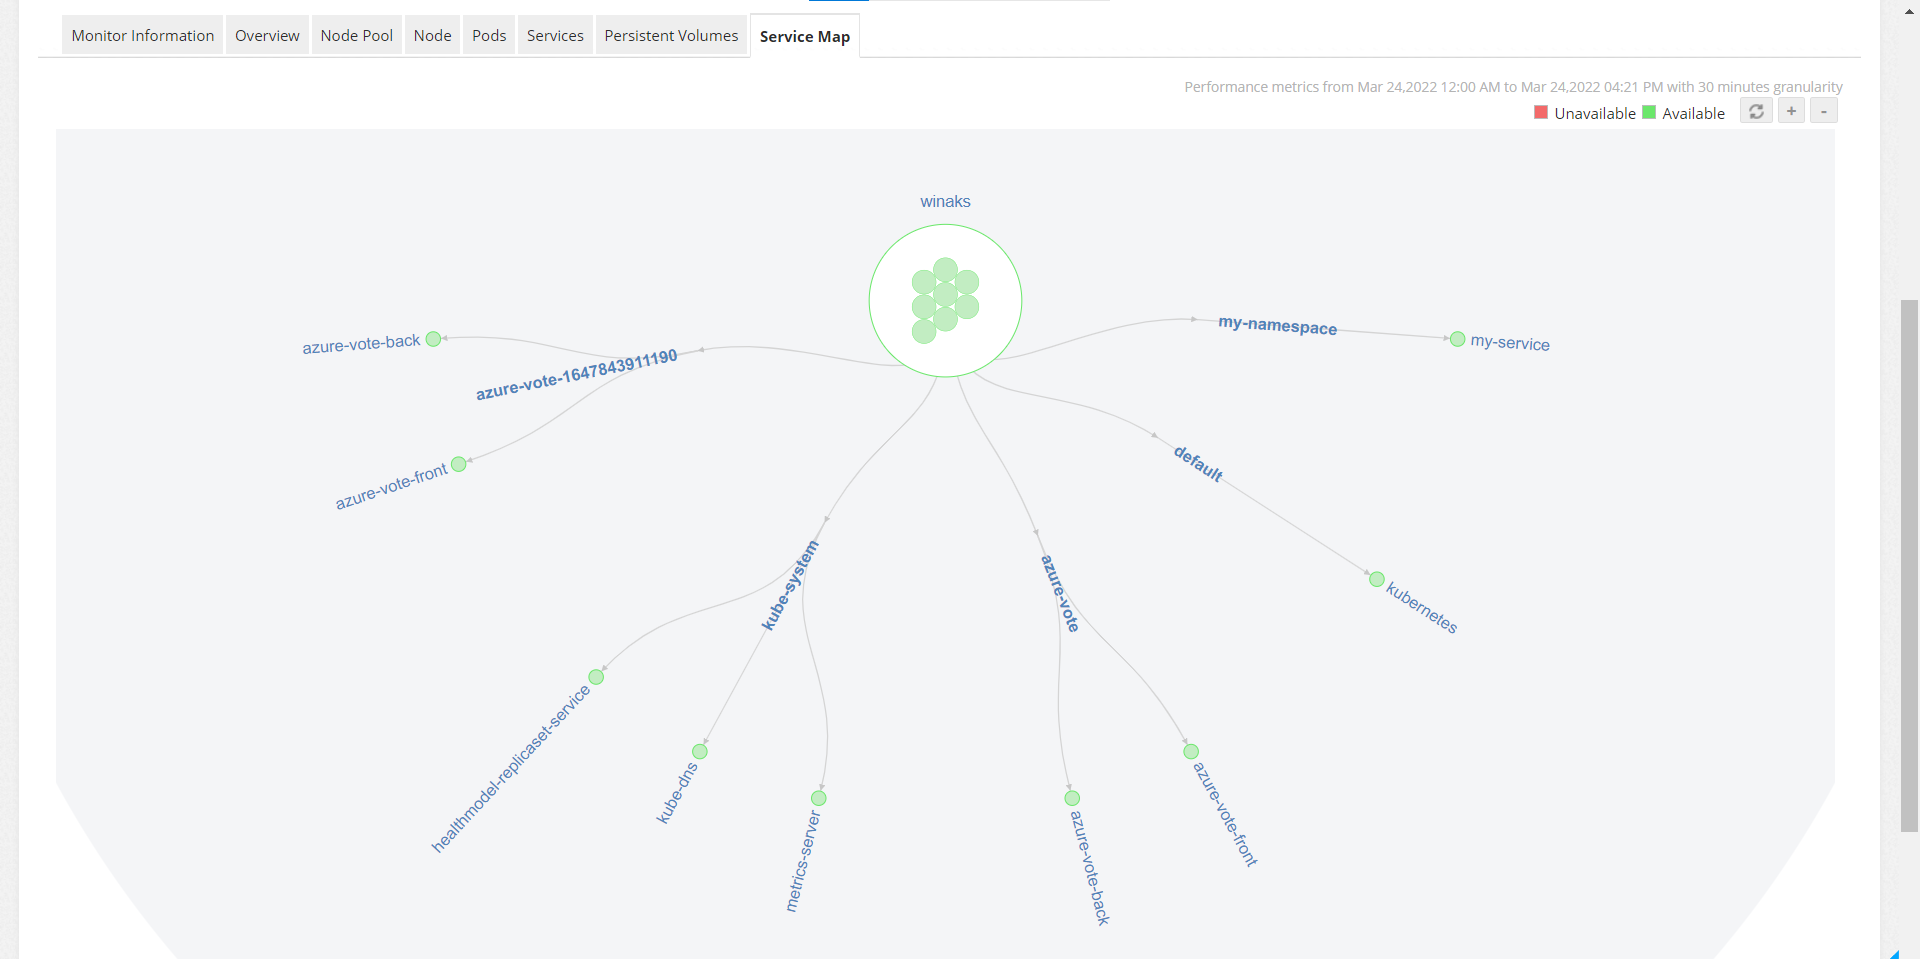
Service Map
- Displays a graphical map view containing namespace and service details.
- All the namespace with its status and pods count for each phase will be seen inside cluster circle.
- Green color indicates that the namespace is UP and red color indicates it is DOWN.
- The cluster services under a namespace can be seen branching as a tree.
- Each service contains its host IP address and port details.