
Trusted by leading enterprises across the globe


Why ManageEngine Applications Manager?
Multi-vendor support
Monitor a wide range of databases (on premises, virtualized or cloud) from a single console.
Proactive performance insights
Leverage AI-powered anomaly detection and predictive analytics to identify potential database issues before they impact performance.
Application-aware database monitoring
Correlate database performance with application health, queries, and infrastructure metrics for faster root cause analysis.
Optimize query performance
Identify slow queries, analyze execution plans, and optimize database performance with detailed query-level insights.
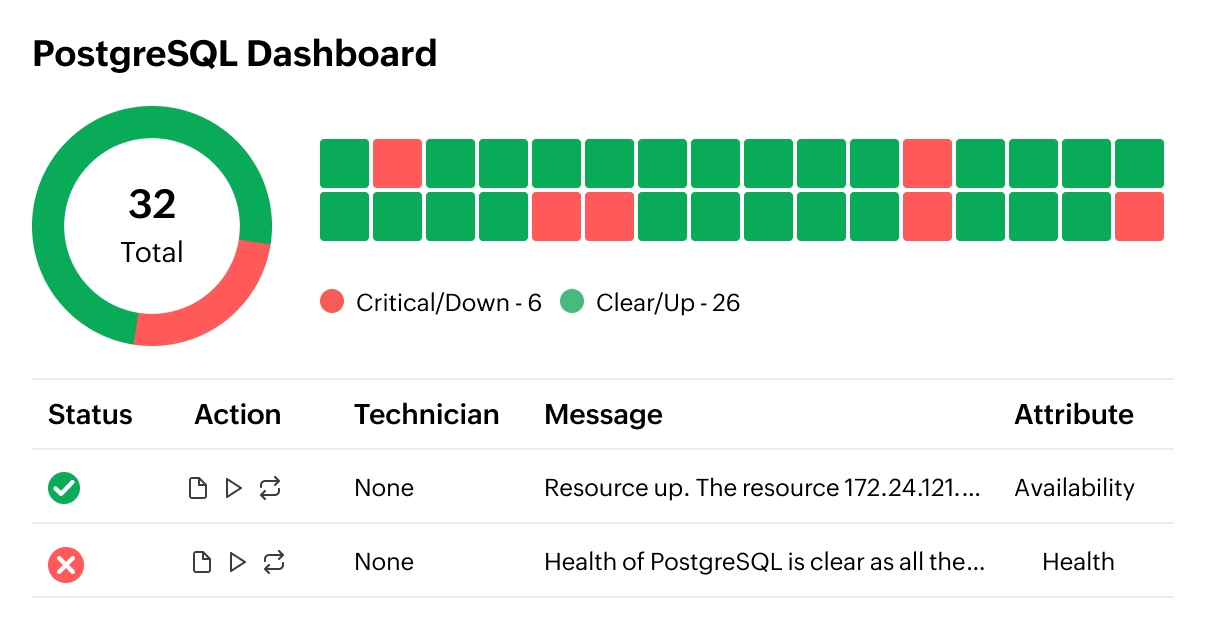
Comprehensive PostgreSQL monitoring for seamless operations
Monitor critical PostgreSQL performance indicators such as transaction rates, active sessions, buffer cache hit ratio, and replication status. Identify performance bottlenecks in real time and ensure PostgreSQL database availability to prevent disruptions to business operations.

Replication and failover tracking for high availability
Ensure database resilience by continuously monitoring replication lag, streaming replication status, and failover events. Detect synchronization delays between primary and replica servers to minimize downtime and maintain data integrity.
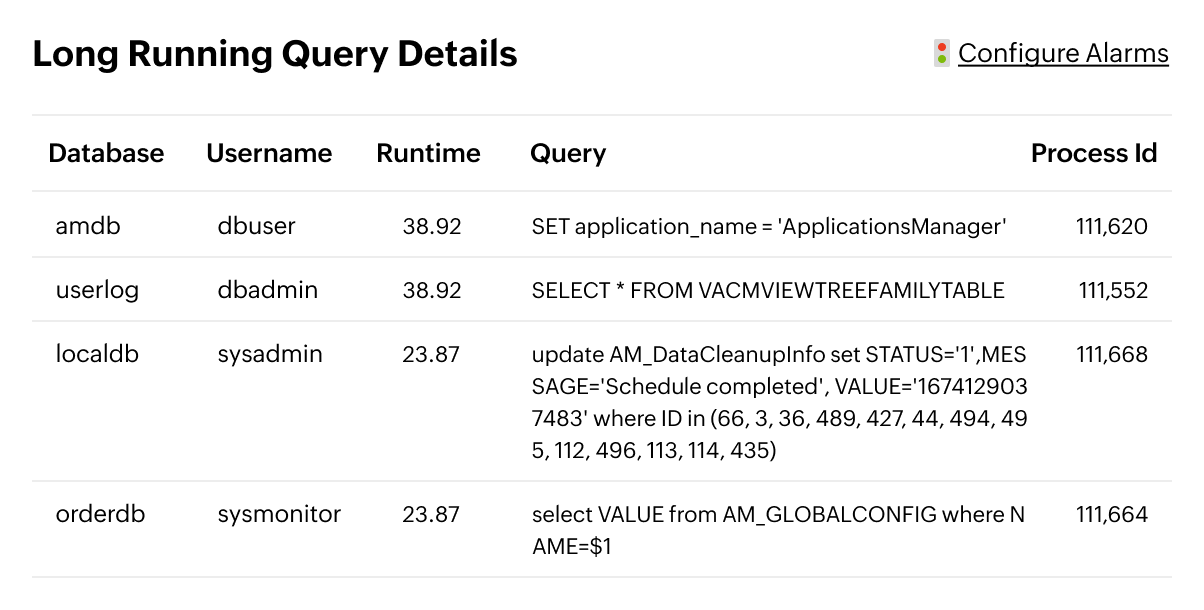
Deep query analysis for enhanced database efficiency
Monitor slow queries, lock statistics, and response times to detect PostgreSQL inefficiencies. Gain visibility into query performance trends, detect blocking queries, and make data-driven optimizations for faster application performance.

Index and vacuum monitoring to optimize storage and performance
Track index usage statistics, detect index bloat, and monitor auto-vacuum processes to prevent unnecessary storage consumption. Ensure PostgreSQL databases remain efficient by fine-tuning indexing strategies and preventing query slowdowns.
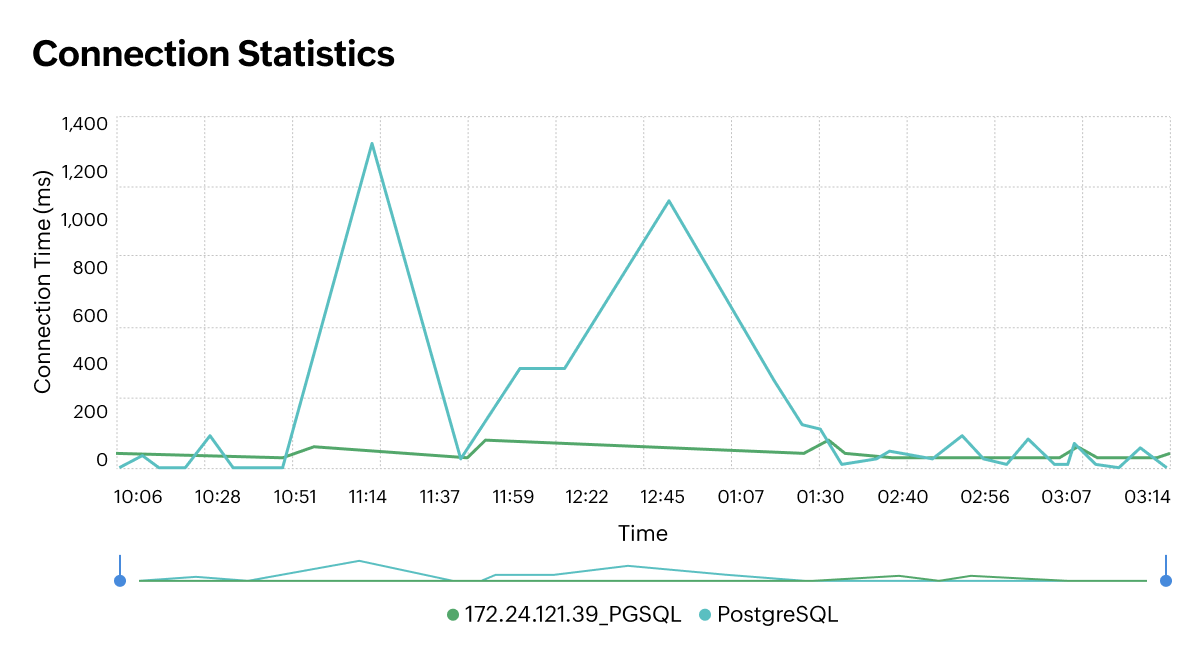
Customizable PostgreSQL dashboards for actionable insights
Build interactive, real-time dashboards tailored to PostgreSQL-specific performance metrics. Monitor database connections, cache hit ratios, and query execution trends from a centralized interface to improve decision-making.
Gain complete visibility into your PostgreSQL environment
Monitor your PostgreSQL databases alongside application performance, server health, and infrastructure metrics—all from a single console. Get real-time insights to optimize database efficiency and ensure seamless operations.
