SAP MaxDB Monitoring
The SAP MaxDB database (formerly SAP DB), developed and supported by SAP AG, is a compliant relational enterprise database system. Applications Manager's SAP Monitoring aims to help database admins with tuning their SAP MaxDB, ensuring the availability and performance of production databases, and gathering operating system level data to understand performance issues from your infrastructure and applications to your end-user experience.
Let’s take a look at what you need to see for SAP MaxDB database administration from a high availability viewpoint, the performance metrics to gather and how you can ensure that your MaxDB is operating as expected with Applications Manager:
Plan Capacity With System And Memory Details
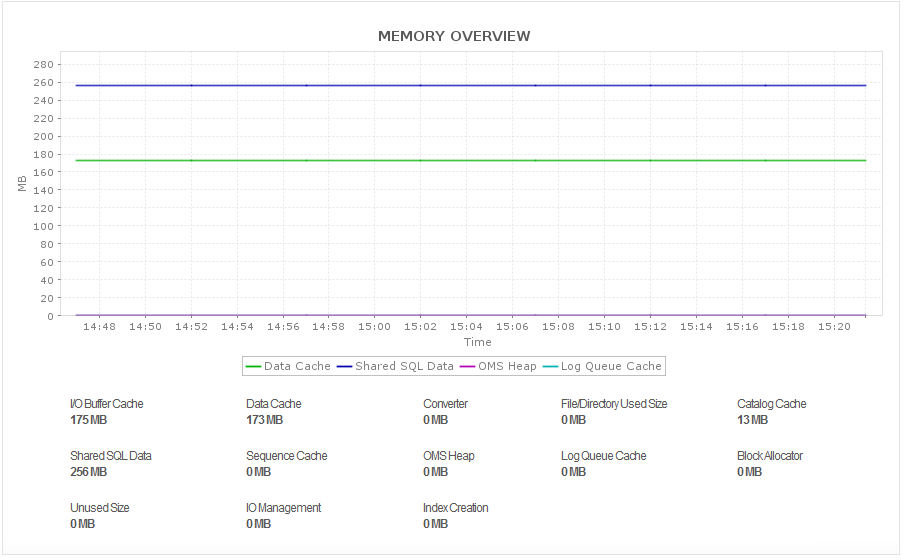
Perform administrative tasks for high availability, while checking which operational state the database is in. In the Memory overview, gather information about the size and general efficiency of the caches of the database. You can view, among other things, the sizes of the most important caches, the number of accesses to these caches, and the cache hit rates since the last time the Database Monitor was started. Gain insight into what size the data cache should be configured so that it is large enough to store the amount of data you require for normal operation of your SAP system.
Ensure your database system is running all critical transactions
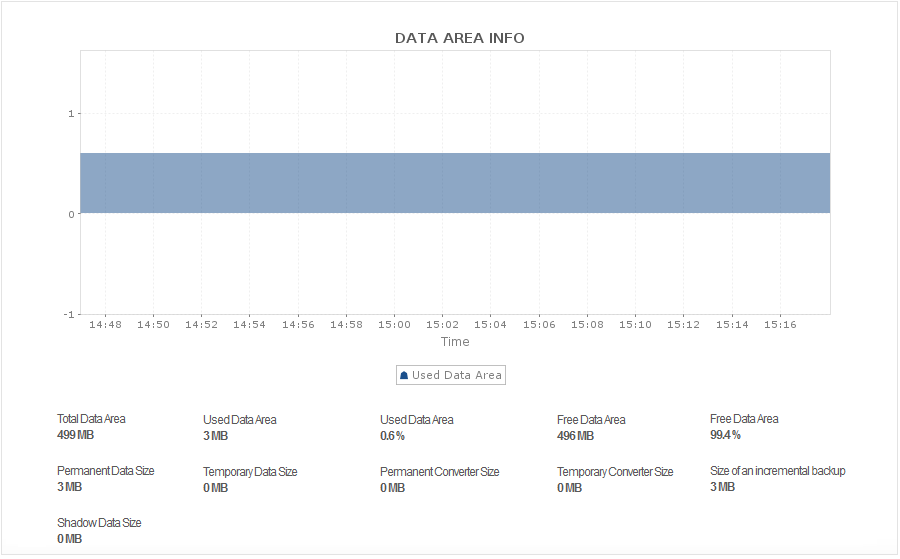
If the data area is full, the database system stops all running transactions. If the log area is full, the database system cannot write any further redo log entries to the log area and stops all running transactions. Both the scenarios result in your database being unavailable for users. If the maximum number of database sessions has been reached, no further users can log on to the database. To avoid this, Application Manager ensures you regularly check data and log volume and confirms that there is sufficient free space in the data and log areas and the number of sessions.
Analyze the Data Cache with Hit-rate metrics and OMS Heap Usage
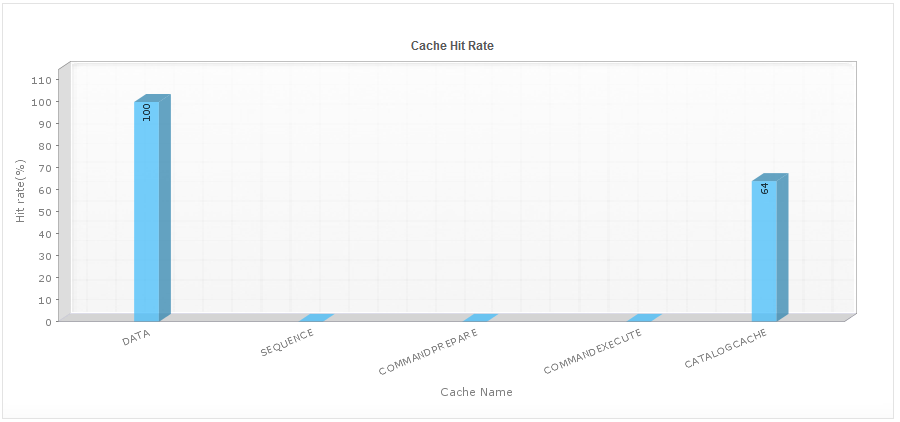
You can gauge the performance of the database system by retrieving as much information as possible from the caches (high hit rate), since access to hard discs is considerably slower. To analyze SAP MaxDB‘s performance, you must first analyze the main memory area’s data cache and OMS heap consumption. Make sure your data cache is dimensioned so that it can hold all OMS data, Undo Log information and all the SQL data in the cache. Otherwise, the data is written to the data area, negatively affecting MaxDB performance.
Stay on top of Lock Activity Management
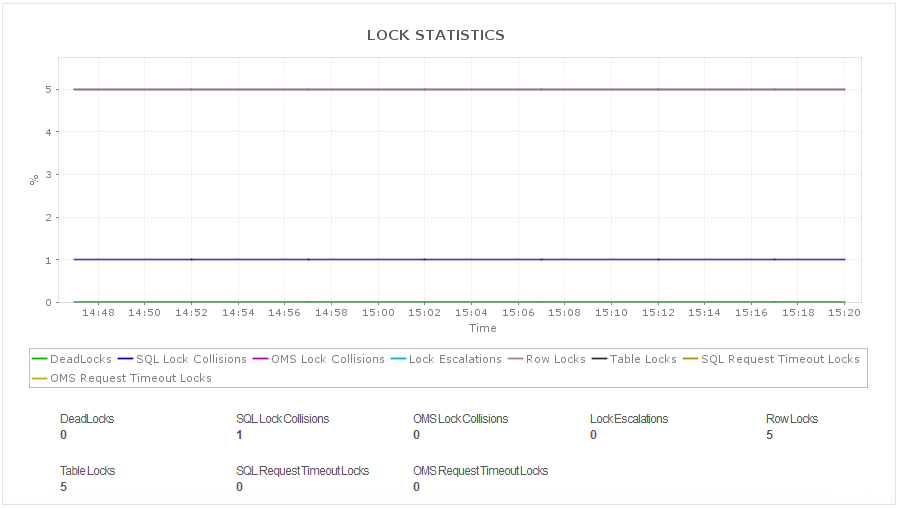
Get information about the maximum number of available database locks (entries) so you can raise the value of maximum locks allowed when the set number approaches the number of available locks. View the total number of rows locked by a single user session. If more than a certain percentage of the rows of a table are locked by a single user session, the database system locks the entire table. Set thresholds for escalations and lock conflicts (if a locked object is requested again). Assess if a specific lock is being held too long or if multiple users are trying to access the same part of the database too often by the number of collisions. Monitor Schema Statistics like table sizes and growth. Identify the top tables in MaxDB query.
Make sure your backups and backup templates are intact
Regularly check whether your backups are intact and have not failed. For example, the directory that you used for backup does not exist anymore and the backup therefore fails. Generate the backup history to display backups have been carried out and whether they were successful. Check the backup history regularly, in particular if you use the automatic log backup function or have automated the backup process using scripts. Monitor the log backup and the archiving for the backup files. Check regularly that automatic log backup is activated.
Detect real-time performance issues and fix them faster
Get a jumpstart on monitoring the SAP MaxDB database in your environment. Get instant notifications of performance issues and bottlenecks. Take quick remedial action before your end-users experience issues.
With Applications Manager, you gain system-wide visibility into resource utilization, application performance, and operational health of your SAP MaxDB infrastructure and application performance. Quickly get started with SAP MaxDB Monitoring with Applications Manager’s full-fledged, 30-day free trial edition.


