If you run SQL Server in production, you have lost time chasing a slowdown in the wrong layer. A backup job saturating shared storage, a hypervisor reclaiming memory from the guest, or a deployment that slipped a network call inside a transaction can all surface as database slowness, and none of them is visible to a monitor watching only the database.
That's the gap this article is about. Not missing metrics, because most SQL Server monitoring setups have plenty of those. The gap is the framing: treating SQL Server telemetry as a standalone signal when almost every real performance incident is the product of at least two layers interacting. This guide covers what to measure, how to read wait statistics accurately, and how to connect database signals to the infrastructure and application layers producing them. Each section builds toward the same conclusion: SQL Server health is a full-stack signal, and your monitoring stack needs to treat it that way.
1. Why SQL Server Monitoring Breaks Down in Practice
SQL Server monitoring breaks down because threshold alerts answer the wrong question. A monitor tells you a counter crossed a line; it cannot tell you why, or what else moved at the same time. That is the line between monitoring (point-in-time counters and alerts, reactive by design) and observability (asking arbitrary questions about system state by correlating metrics, logs, and traces across every contributing layer). It is why a SQL Server dashboard can be green on every counter while the system is on fire: the failure lives in the relationship between signals, not in any one of them.
Wait statistics are the clearest example. A single wait type can point to a problem inside the database or to something a layer below it, and the wait alone never tells you which, so the same reading can call for opposite fixes.
You need those database signals correlated with what's happening in the OS, on the storage tier, and in the application making the requests.
Three scenarios make that concrete, and they run as a through-line for the rest of this guide:
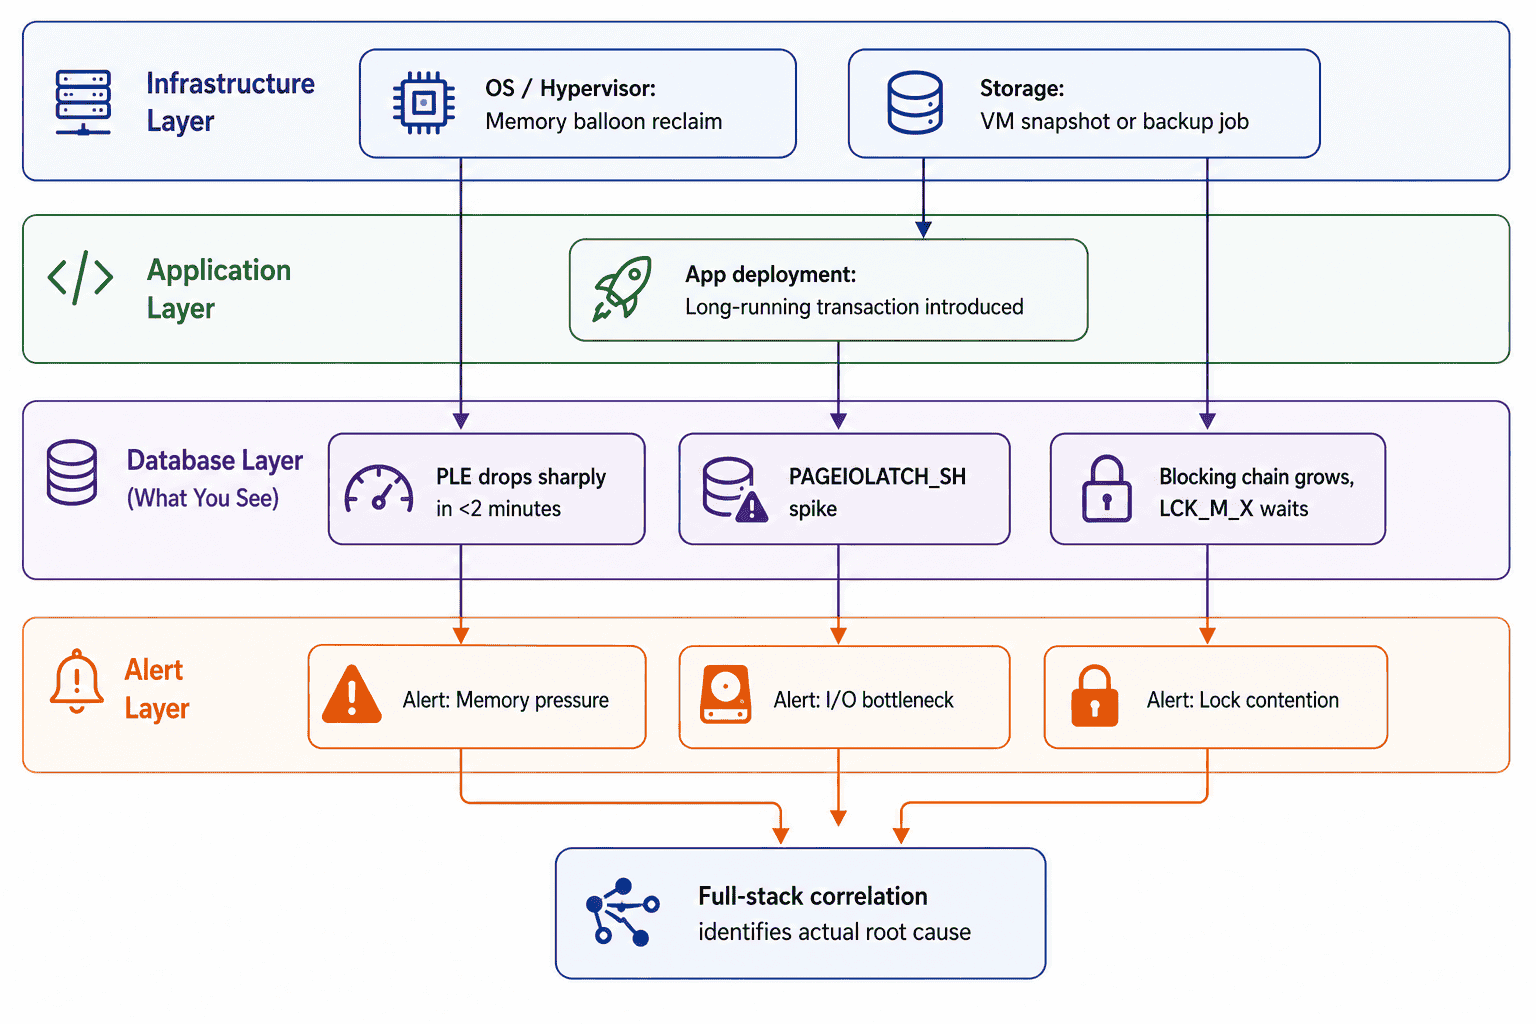
- An OS-level memory reclaim from a hypervisor balloon driver drops Page Life Expectancy sharply in under two minutes. It looks like a memory configuration problem. It's an infrastructure event.
- A concurrent storage snapshot or host-level backup job spikes PAGEIOLATCH_SH waits and slows read-intensive queries. It looks like an index problem. It's an I/O contention event.
- An application deployment introduces a long-running transaction that accumulates an open lock on a hot table. Blocked sessions pile up. It looks like a lock contention problem. It's an application code problem.
Sections 2 through 4 build the signal literacy to recognize each one; Section 5 shows how to correlate them across layers.
2. The SQL Server Signals That Drive Incidents, and How to Baseline Them
Correlation needs raw material. Before you can tie a database symptom to a cause in another layer, you need a short list of signals you trust and a sense of what each looks like when nothing is wrong. This section is that foundation: the counters worth watching, why each earns its place, and how to turn them into alerts that fire on real deviation instead of an arbitrary number.
You collect them through sys.dm\_os\_performance_counters :
-- Collect key SQL Server counters via sys.dm_os_performance_counters


SELECT

    object_name,

    counter_name,

    instance_name,

    cntr_value

FROM sys.dm_os_performance_counters

WHERE counter_name IN (

    'Buffer cache hit ratio',

    'Page life expectancy',

    'Batch Requests/sec',

    'SQL Compilations/sec',

    'SQL Re-Compilations/sec',

    'Lock Waits/sec',

    'Active Transactions'

);
The same counters live under PerfMon objects ( SQLServer:Buffer Manager\* , SQLServer:SQL Statistics\* , and SQLServer:Locks(_Total)\* ) when you want them charted next to OS-level metrics on the same host; for a named instance, replace SQLServer with MSSQL$\<InstanceName\> .
Memory pressure: Buffer Cache Hit Ratio and Page Life Expectancy. These are the earliest warning that the buffer pool can no longer hold the working set, and what matters is the shape of the change, not the absolute number. A large-memory server routinely runs BCHR well above 99% and PLE in the tens of thousands of seconds, so the old fixed floors of 90% and 300 seconds tell you nothing. A drop against the instance's own baseline does: a gradual PLE decline means the working set is outgrowing memory, while a cliff in under two minutes is almost always something external dumping the cache, the exact signature of the hypervisor-reclaim scenario from Section 1.
Locking and long-running transactions: Lock Waits/sec, Deadlocks/sec, and Active Transactions. These mean something only when read against application events, which is exactly why they belong in an observability layer rather than a standalone dashboard. Deadlocks spiking right after a deployment point to a lock-ordering change in new code; lock waits climbing in a batch window point to OLTP and reporting contending for one instance; active transactions rising without a matching rise in batch requests point to an application holding a connection open across a slow external call. The counter alone is never the answer, you need the deployment timestamp or job schedule beside it. Log file usage belongs here too, as a hard stop: approaching capacity means an imminent transaction log full event that halts writes entirely.
Throughput and plan health: Batch Requests/sec and SQL Recompilations/sec. Batch requests falling while CPU stays high is the signature of plan instability. Either recompilations are climbing, with queries forfeiting plan reuse, or the cache is serving bad plans, including parameter-sniffing degradation where a plan optimal for the sniffed value is catastrophic for others, through bad reuse rather than recompilation. Read together, the two counters separate "the server is busy" from "the server is busy doing the wrong work."
Other counters refine the picture (latch wait times for in-memory contention, pending memory grants and plan cache hit ratio for executor-side pressure), but those three groups are the ones that announce incidents.
Each of these signals raises the same question: what value counts as abnormal? Static thresholds answer it badly, for the same reason a single blood-pressure reading doesn't diagnose hypertension. A PLE threshold of 1,000 is meaningless on a 256 GB server, and a single batch-requests threshold can't be right for both a busy weekday afternoon and a quiet Sunday night: set it for the peak and off-hours anomalies never fire, set it for the quiet hours and every normal afternoon pages you. The fix is to baseline: collect the key counters over a representative two-week window covering month-end loads, business-hours peaks, and maintenance windows, then alert on deviation (mean ± 2σ, segmented by peak versus off-peak) rather than on a fixed line. Done manually, that means either PerfMon Data Collector Sets or a scheduled job snapshotting sys.dm\_os\_performance_counters into a staging table, trading binary BLG files that need a separate tool against immediately queryable rows.
That manual baselining doesn't scale across a fleet. ManageEngine Applications Manager establishes a per-instance baseline automatically and uses ML-based adaptive thresholds to alert on deviation, so a significant PLE drop fires against that instance's own history instead of an absolute value someone set a year ago, which cuts alert noise sharply on mixed or variable workloads.
Baselined signals tell you when something is abnormal. The next question is what the engine is stuck waiting on, and for that you read wait statistics.
3. Wait Statistics: Reading What SQL Server Is Actually Waiting For
Baselines tell you when a counter has gone abnormal; wait statistics tell you what the engine is actually stuck waiting on. They are the most direct diagnostic signal SQL Server provides. Every worker thread records what it waited for and for how long before completing each operation. sys.dm\_os\_wait_stats accumulates these totals at the instance level since the last service restart, or since the last manual reset via DBCC SQLPERF('sys.dm_os_wait_stats', CLEAR) . That distinction matters when writing monitoring queries: delta calculations based on a snapshot interval are more useful than raw cumulative totals, and your delta logic needs to handle both reset paths, not just restart.
The raw DMV contains hundreds of wait types, most of which are background noise. The critical step is filtering out benign waits (idle wait types that accumulate because SQL Server is simply waiting for work) before calculating percentages. Here's a focused query that categorizes actionable waits and surfaces them by relative share:
-- Actionable wait statistics by category

-- Run twice with a collection interval, or use cumulative totals as a trend


WITH WaitStats AS (

    SELECT

        wait_type,

        wait_time_ms,

        waiting_tasks_count,

        CASE

            WHEN wait_type LIKE 'LCK%' THEN 'Lock'

            WHEN wait_type LIKE 'PAGEIOLATCH%' THEN 'I/O'

            WHEN wait_type IN ('ASYNC_IO_COMPLETION',

                'IO_COMPLETION') THEN 'Disk I/O'

            WHEN wait_type IN ('WRITELOG', 'LOGBUFFER')

                THEN 'Log Write'

            WHEN wait_type LIKE 'LATCH_%' THEN 'Latch'

            WHEN wait_type = 'CXPACKET' THEN 'Parallelism'

            WHEN wait_type IN ('SOS_SCHEDULER_YIELD', 'THREADPOOL')

                THEN 'CPU'

            WHEN wait_type IN ('ASYNC_NETWORK_IO', 'NET_WAITFOR_PACKET')

                THEN 'Network'

            ELSE 'Other'

        END AS wait_category

    FROM sys.dm_os_wait_stats

    WHERE wait_type NOT IN (

        -- Benign background and idle waits - filter these out

        'SLEEP_TASK', 'BROKER_TO_FLUSH',

        'BROKER_EVENTHANDLER', 'CHECKPOINT_QUEUE',

        'DBMIRROR_EVENTS_QUEUE', 'DISPATCHER_QUEUE_SEMAPHORE',

        'FT_IFTS_SCHEDULER_IDLE_WAIT', 'HADR_WORK_QUEUE',

        'LAZYWRITER_SLEEP', 'LOGMGR_QUEUE',

        'REQUEST_FOR_DEADLOCK_SEARCH', 'RESOURCE_QUEUE',

        'SERVER_IDLE_CHECK', 'SLEEP_DBSTARTUP',

        'SLEEP_DCOMSTARTUP', 'SLEEP_MASTERDBREADY',

        'SLEEP_MASTERMDREADY', 'SLEEP_MASTERUPGRADED',

        'SLEEP_MSDBSTARTUP', 'SLEEP_SYSTEMTASK',

        'SLEEP_TEMPDBSTARTUP', 'SNI_HTTP_ACCEPT',

        'SP_SERVER_DIAGNOSTICS_SLEEP', 'SQLTRACE_BUFFER_FLUSH',

        'WAITFOR', 'XE_DISPATCHER_WAIT',

        'XE_TIMER_EVENT', 'BROKER_TRANSMITTER',

        'DBMIRROR_SEND',

        -- CXCONSUMER is benign (consumer side of parallel exchange)

        -- Introduced in SQL Server 2017 CU3, backported to 2016 SP2

        -- Do NOT treat this as a parallelism problem

        'CXCONSUMER'

    )

)


SELECT

    wait_category,

    SUM(wait_time_ms) AS total_wait_ms,

    SUM(waiting_tasks_count) AS total_waits,

    CAST(

        100.0 * SUM(wait_time_ms)

        / NULLIF(SUM(SUM(wait_time_ms)) OVER (), 0)

        AS DECIMAL(5,2)

    ) AS wait_pct

FROM WaitStats

GROUP BY wait_category

ORDER BY total_wait_ms DESC;
The earlier version of this query filtered out the Other category, which silently discarded high-impact waits like WRITELOG and IO_COMPLETION that hadn't been mapped. Categorizing those explicitly and leaving Other in the result set means an unexpected wait that's significant on your specific instance still shows up instead of vanishing.
Cumulative totals are fine for a first read, but for active diagnosis you want the delta between two snapshots, which also has to survive a counter reset between captures:
-- Delta pattern: capture two snapshots, compute the interval difference

-- Handles both service restarts and manual DBCC SQLPERF resets


SELECT wait_type, wait_time_ms, waiting_tasks_count

INTO #WaitSnapshot1

FROM sys.dm_os_wait_stats;


WAITFOR DELAY '00:01:00';  -- adjust interval as needed


SELECT

    s2.wait_type,

    CASE WHEN s2.wait_time_ms >= s1.wait_time_ms

        THEN s2.wait_time_ms - s1.wait_time_ms

        ELSE s2.wait_time_ms  -- counter was reset between snapshots

    END AS delta_wait_ms

FROM sys.dm_os_wait_stats s2

LEFT JOIN #WaitSnapshot1 s1 ON s2.wait_type = s1.wait_type

ORDER BY delta_wait_ms DESC;
The CASE branch treats a decrease in the cumulative total as a reset event and uses the post-reset value as the delta, so neither a service restart nor a manual DBCC SQLPERF clear corrupts your interval math.
The output points you to the right problem class before you start touching anything. Here's how to read the three most operationally significant categories:
PAGEIOLATCH (I/O waits). When PAGEIOLATCH_SH or PAGEIOLATCH_EX tops the list, the database is stalled on storage, and the trap is reading that as a missing index. The saturation is just as often something outside SQL Server, so check read latency and queue depth, and whether a backup or snapshot overlaps the spike window, before you touch an index (Section 5 works the storage-event case in full). Index fragmentation becomes the prime suspect only once the storage layer comes back clean.
LCK_M (lock waits). Lock waits tell you sessions are queued behind locks other sessions hold, but the wait type itself is where the trail goes cold. The actionable move is to find the head of the blocking chain (Section 4), and the root cause is almost always in how the application scopes its transactions, not in a database setting.
CXPACKET (parallelism). CXPACKET is the parallelism wait worth acting on, and the canonical mistake is to treat it as a server-tuning problem and drop MAXDOP for the whole instance. Start in the query plan instead: uneven CXPACKET usually traces to skewed row distribution across parallel threads, which statistics updates, filtered indexes, or a query hint resolve without penalizing every other query on the box. Its lookalike CXCONSUMER is benign ( added in SQL Server 2017 CU3 and backported to 2016 SP2 ), so a wait list dominated by it is noise to filter, not a problem to fix.
4. Query Performance: Finding What's Slowing the Database Down
Wait statistics tell you what category of problem you're dealing with. Query-level analysis tells you which specific queries are responsible. These are two separate questions, and answering both requires sys.dm\_exec\_query_stats joined to sys.dm\_exec\_sql_text and optionally sys.dm\_exec\_query_plan .
A common mistake when building a "top queries" list is sorting only by total elapsed time. Total elapsed time favors high-execution-count queries: a query running in 2ms that executes 500,000 times a day accumulates 1,000 seconds of elapsed time, but it's not the source of your incident. Sorting by average elapsed time surfaces the slow individual executions. Sorting by total logical reads surfaces the I/O hogs regardless of latency. Run both lists, because they often identify completely different problems:
-- Top 5 queries by total elapsed time (long-running absolutes)

SELECT TOP 5

    qs.total_elapsed_time / qs.execution_count AS avg_elapsed_us,

    qs.total_elapsed_time AS total_elapsed_us,

    qs.total_logical_reads,

    qs.execution_count,

    SUBSTRING(

        st.text,

        (qs.statement_start_offset / 2) + 1,

        ((CASE qs.statement_end_offset

            WHEN -1 THEN DATALENGTH(st.text)

            ELSE qs.statement_end_offset

        END - qs.statement_start_offset) / 2) + 1

    ) AS query_text

FROM sys.dm_exec_query_stats AS qs

CROSS APPLY sys.dm_exec_sql_text(qs.sql_handle) AS st

ORDER BY qs.total_elapsed_time DESC;


-- Top 5 queries by total logical reads (I/O pressure drivers)

SELECT TOP 5

    qs.total_logical_reads / qs.execution_count AS avg_logical_reads,

    qs.total_logical_reads,

    qs.total_elapsed_time,

    qs.execution_count,

    SUBSTRING(

        st.text,

        (qs.statement_start_offset / 2) + 1,

        ((CASE qs.statement_end_offset

            WHEN -1 THEN DATALENGTH(st.text)

            ELSE qs.statement_end_offset

        END - qs.statement_start_offset) / 2) + 1

    ) AS query_text

FROM sys.dm_exec_query_stats AS qs

CROSS APPLY sys.dm_exec_sql_text(qs.sql_handle) AS st

ORDER BY qs.total_logical_reads DESC;
For query-level tracing in production environments, Extended Events replaces the deprecated SQL Server Profiler. An XE session capturing sql\_statement\_completed events with a duration above a threshold (say, 5,000 ms) adds minimal overhead compared to the old trace approach and gives you the same statement text, execution plan handle, and resource consumption data. XE sessions are asynchronous and buffer-based, so they won't consume foreground thread resources the way a synchronous trace would under load. A minimal session looks like this:
-- Minimal XE session: capture slow statements (>5 seconds) in production


CREATE EVENT SESSION [SlowQueryCapture] ON SERVER

ADD EVENT sqlserver.sql_statement_completed (

    WHERE duration > 5000000  -- microseconds; 5,000 ms

    ACTION (

        sqlserver.sql_text,

        sqlserver.query_hash,

        sqlserver.plan_handle,

        sqlserver.database_name,

        sqlserver.username

    )

)

ADD TARGET package0.ring_buffer (

    SET max_memory = 51200  -- 50 MB ring buffer

)

WITH (

    MAX_DISPATCH_LATENCY = 5 SECONDS,

    TRACK_CAUSALITY = OFF

);


ALTER EVENT SESSION [SlowQueryCapture] ON SERVER STATE = START;Thering_buffer target is in-memory and non-persistent, which is fine for live troubleshooting; switch to an event_file target when you need capture to survive restarts, and read the results through sys.dm\_xe\_session_targets .
Finding the Head Blocker
Blocking chains are deceptively simple to misread. When 15 sessions are blocked, the instinct is to kill the one with the longest wait time. That's usually the wrong session: it's a victim, not the source. The head blocker is the session with blocking\_session\_id = 0 that has at least one other session blocked behind it. Find it first:
-- Identify the active blocking chain


SELECT

    r.session_id,

    r.blocking_session_id,

    r.wait_type,

    r.wait_time / 1000.0 AS wait_seconds,

    r.status,

    SUBSTRING(

        st.text,

        (r.statement_start_offset / 2) + 1,

        ((CASE r.statement_end_offset

            WHEN -1 THEN DATALENGTH(st.text)

            ELSE r.statement_end_offset

        END - r.statement_start_offset) / 2) + 1

    ) AS current_statement

FROM sys.dm_exec_requests AS r

CROSS APPLY sys.dm_exec_sql_text(r.sql_handle) AS st

WHERE r.blocking_session_id > 0

ORDER BY r.wait_time DESC;
Killing a victim session releases its own locks but doesn't touch the head blocker's locks. The chain re-forms as other sessions try to acquire the same resources. If the head blocker is an idle session (status = sleeping with an open transaction), the relevant question is why the application isn't committing. That points to application code, not database configuration.
Where Applications Manager Fits
The baseline automation covered in Section 2 is one half of what Applications Manager does for SQL Server; the other half addresses the queries above di rectly. Running them manually on every shift, correlating output across multiple instances, and tracking trends over time is the work that burns on-call engineers out. The same platform surfaces CPU utilization, I/O metrics, buffer cache hit ratios, and query execution data across its monitoring interface without requiring DMV queries on every login. Active sessions and session-level resource consumption are tracked continuously in the Sessions Tab, while blocked-query data surfaces in the Performance Tab, so when an incident fires, the blocking session IDs and wait duration are already populated rather than requiring you to run a query the moment you receive the page. Top queries by CPU, I/O, and total execution time are identified automatically as the workload runs, giving you the same two-list comparison described above without manual collection.
That's the friction point where a unified monitoring tool earns its place: not replacing the DMV knowledge, but making it continuously available rather than requiring manual queries during incidents.
5. Full-Stack SQL Server Observability: Connecting Database Telemetry to Infrastructure and Application Data
The three scenarios from Section 1 describe a specific failure pattern: a database signal fires an alert, but the cause lives in a different layer. Resolving these incidents correctly requires correlated visibility, not just more database metrics.
Scenario 1: PLE Drop and OS Memory Pressure
A PLE drop that unfolds in under two minutes is almost never a database tuning problem. Buffer pool eviction at that rate happens because memory was physically reclaimed at the OS or hypervisor level: a balloon driver on a VMware host, an Azure host rebalancing memory allocations, or a competing process on the same guest suddenly consuming available RAM. The database signal alone looks like memory misconfiguration. Correlated with a host-level memory pressure event at the same timestamp, it's an infrastructure problem that SQL Server has no ability to control. The fix is a conversation with the virtualization team, not a change to max server memory.
Scenario 2: PAGEIOLATCH_SH and Storage I/O
VM snapshot jobs, host-level backup operations, and storage array processes that run on maintenance schedules produce sudden I/O saturation that lands directly in SQL Server's PAGEIOLATCH wait counters. The timing correlation is the diagnostic: when a PAGEIOLATCH_SH spike lines up to the minute with a scheduled storage snapshot or backup on the same host, you have your answer. Without the storage-layer signal available in the same monitoring view, most teams spend an incident window tuning indexes on queries that were fine the day before and will be fine again tomorrow.
Scenario 3: Blocking Chain and Application Deployments
A sudden blocking cascade after a scheduled deployment means the new code introduced a transaction that holds locks longer than the old version did, usually because a network call, file I/O, or external service call was moved inside a transaction boundary. The database monitoring shows a blocking chain starting at a specific session. When the application deployment timestamp and the blocking chain start timestamp align, the cause is almost certainly the new code. Without that deployment event in the same observability view, it takes a manual conversation between the DBA and the deployment team to surface the correlation.
Always On Availability Groups Monitoring
For SQL Server environments with Always On Availability Groups, the correlation problem extends to replication lag and failover readiness. Replica health is a separate signal that needs to live alongside instance-level metrics: a replica falling behind in synchronization while write throughput is high means failover would cause data loss, not just downtime.
Applications Manager monitors Availability Groups, Availability Replicas, and Availability Databases through a dedicated Always On Availability Groups view. It surfaces synchronization mode (synchronous versus asynchronous), data delivery speed, replication lag, and failover readiness state for each replica, in the same platform monitoring instance-level CPU, memory, and wait statistics. Reading these signals takes only minimal permissions on the monitoring account, not sysadmin or database ownership rights (the specific server-level grants are in Section 6).
Having replication lag, failover readiness, and instance-level wait statistics in a single view matters operationally. A PAGEIOLATCH_SH spike on the primary combined with replication lag on the secondary is a different problem from either signal in isolation. The primary may be generating log records faster than the replica's storage can apply them, which changes your remediation priority entirely.
End-to-End Distributed Tracing
When the Applications Manager APM layer captures a slow application request, that trace can be followed down to the specific database query responsible. Instead of manually correlating timestamps between an APM tool and a database monitor (opening two browser tabs, aligning time ranges, guessing at causality), the trace shows you the application call, the SQL statement it generated, and the duration. A 4-second API response that is slow because it's waiting on a database query that's slow because a blocking chain is holding the relevant table becomes visible end to end, not assembled from three separate tools after the fact. This correlation requires the Applications Manager APM agent installed on the application servers making database calls; the agent instruments the application runtime (Java, .NET, and Node.js among others) and propagates trace context into the database call. The SQL Server monitor and the APM monitor must both run in the same Applications Manager instance for the correlated view to appear, and the supported runtime list and agent installation steps are documented per language.
6. Getting Your First SQL Server Monitor Running in Applications Manager
The setup is agentless: there's no agent to deploy on the database host. You'll need network access from the Applications Manager server to the SQL Server instance on port 1433 (or the named instance port), valid credentials, and a monitoring account with the right server-level permissions.
Grant those permissions first. A least-privilege monitoring account that lacks VIEW SERVER STATE will fail to collect most DMV-based metrics, and it will fail silently:
-- Minimum server-level permissions for the monitoring account

-- Run on each SQL Server instance to be monitored


-- Required for DMV access (sys.dm_os_wait_stats, sys.dm_exec_requests, etc.)

GRANT VIEW SERVER STATE TO [monitoring_account];


-- Required for Always On Availability Groups catalog views

GRANT VIEW ANY DEFINITION TO [monitoring_account];
If you're using SQL Authentication, create the login before granting:
CREATE LOGIN [monitoring_account] WITH PASSWORD = '<strong_password>';


GRANT VIEW SERVER STATE TO [monitoring_account];


GRANT VIEW ANY DEFINITION TO [monitoring_account];
With the account in place, add the monitor:
- Log in to Applications Manager and navigate to New Monitor > Add New Monitor .
- Under the Database Servers category, select Microsoft SQL Server .
- Fill in a display name, the hostname or IP address, and the port number (default 1433). For named instances, enter the instance name in the provided field.
- Choose the authentication type: SQL Authentication , Windows Authentication (NTLM) , Kerberos , or Native (jTDS driver). SQL Authentication uses a SQL login; Windows Authentication uses a domain account. Select the JDBC driver to match: the Microsoft JDBC driver is the default and is appropriate for SQL Server 2012 and later, while the jTDS driver (labeled Native in the UI) is only needed for SQL Server 2008 or 2008 R2.
- Set Force Encryption to true if the SQL Server instance requires encrypted connections.
- Set the polling interval. The default is 5 minutes, which suits most production monitoring; reduce it to 1 minute for critical instances during incident response if needed.
- Click Test to verify the connection, then click Add Monitor(s) to save.
Once the monitor is created, open the instance's performance views for immediate visibility into CPU utilization, memory usage, disk I/O, and buffer cache metrics. Review the database-level view for log file usage percentage and data file growth trends for each database on the instance. If the instance participates in an Availability Group, open the Always On Availability Groups view to confirm replica synchronization states and failover readiness.
Actionable first step: After the monitor is created, open the Performance Tab, where blocked-query data surfaces, and look for any session with a non-zero blocking\_session\_id . If one appears, you have a live blocking chain on this instance right now: the view shows the blocked session, the blocking session ID, the wait type, and how long the block has been active, the same information the sys.dm\_exec\_requests query in Section 4 returns, surfaced without a query prompt. It gives you an immediate read on active blocking on any instance you've just started monitoring.
Final Thoughts
SQL Server performance problems rarely live in a single layer, and the teams that resolve them fastest read the database signal as one input among several rather than the whole story. The metrics and wait statistics in this guide are the vocabulary the database uses to describe what's wrong; correlating them with the infrastructure and application events around them is what turns that vocabulary into a root cause.
Applications Manager exists to make that correlation the default rather than a manual exercise: it monitors the SQL Server tier in the same platform as the infrastructure and application layers above it, so the context you need during an incident is already in one view instead of spread across three tools.
Start monitoring your SQL Server instances alongside your full infrastructure stack. Learn more about ManageEngine Applications Manager database monitoring at https://www.manageengine.com/products/applications_manager/database-monitoring.html .

