Ticketing Tool configuration
With EventLog Analyzer, you can efficiently manage security incidents by raising tickets and assigning them to administrators for alerts that are generated. You can easily manage the incident within the EventLog Analyzer console itself or use an external help desk software for raising tickets. Under Alert Configurations, click on ticketing tool integration to configure an external help desk - ServiceNow, ManageEngine ServiceDesk Plus, ManageEngine ServiceDesk Plus On-Demand, ManageEngine ServiceDeskPlus MSP, ManageEngine AlarmsOne, Jira Service Desk, Jira Service Desk On-Demand, Zendesk, Freshservice, Kayako, or BMC Remedy Service Desk.
Manage Ticketing Tool Configuration
To configure incident management with ticketing tools, click on ticketing tool integration under Alert Configuration. From the Ticketing Tool drop-down list, select the ticketing tool that you want to configure EventLog Analyzer with. Then, follow the following steps based on the ticketing tool used.
For ManageEngine ServiceDesk Plus On-Demand:
Note: Only users with permissions to view and edit requests can proceed with the configuration.
In EventLog Analyzer, navigate to the Alerts tab and click Ticketing Tool Integration under Alert Configuration. From the Ticketing Tool drop-down list, select ManageEngine ServiceDesk Plus On-Demand.
- Choose the Data Center where your ServiceDesk Plus account is hosted. Kindly refer to the table below to find the corresponding Data Center for your ServiceDesk Plus account.
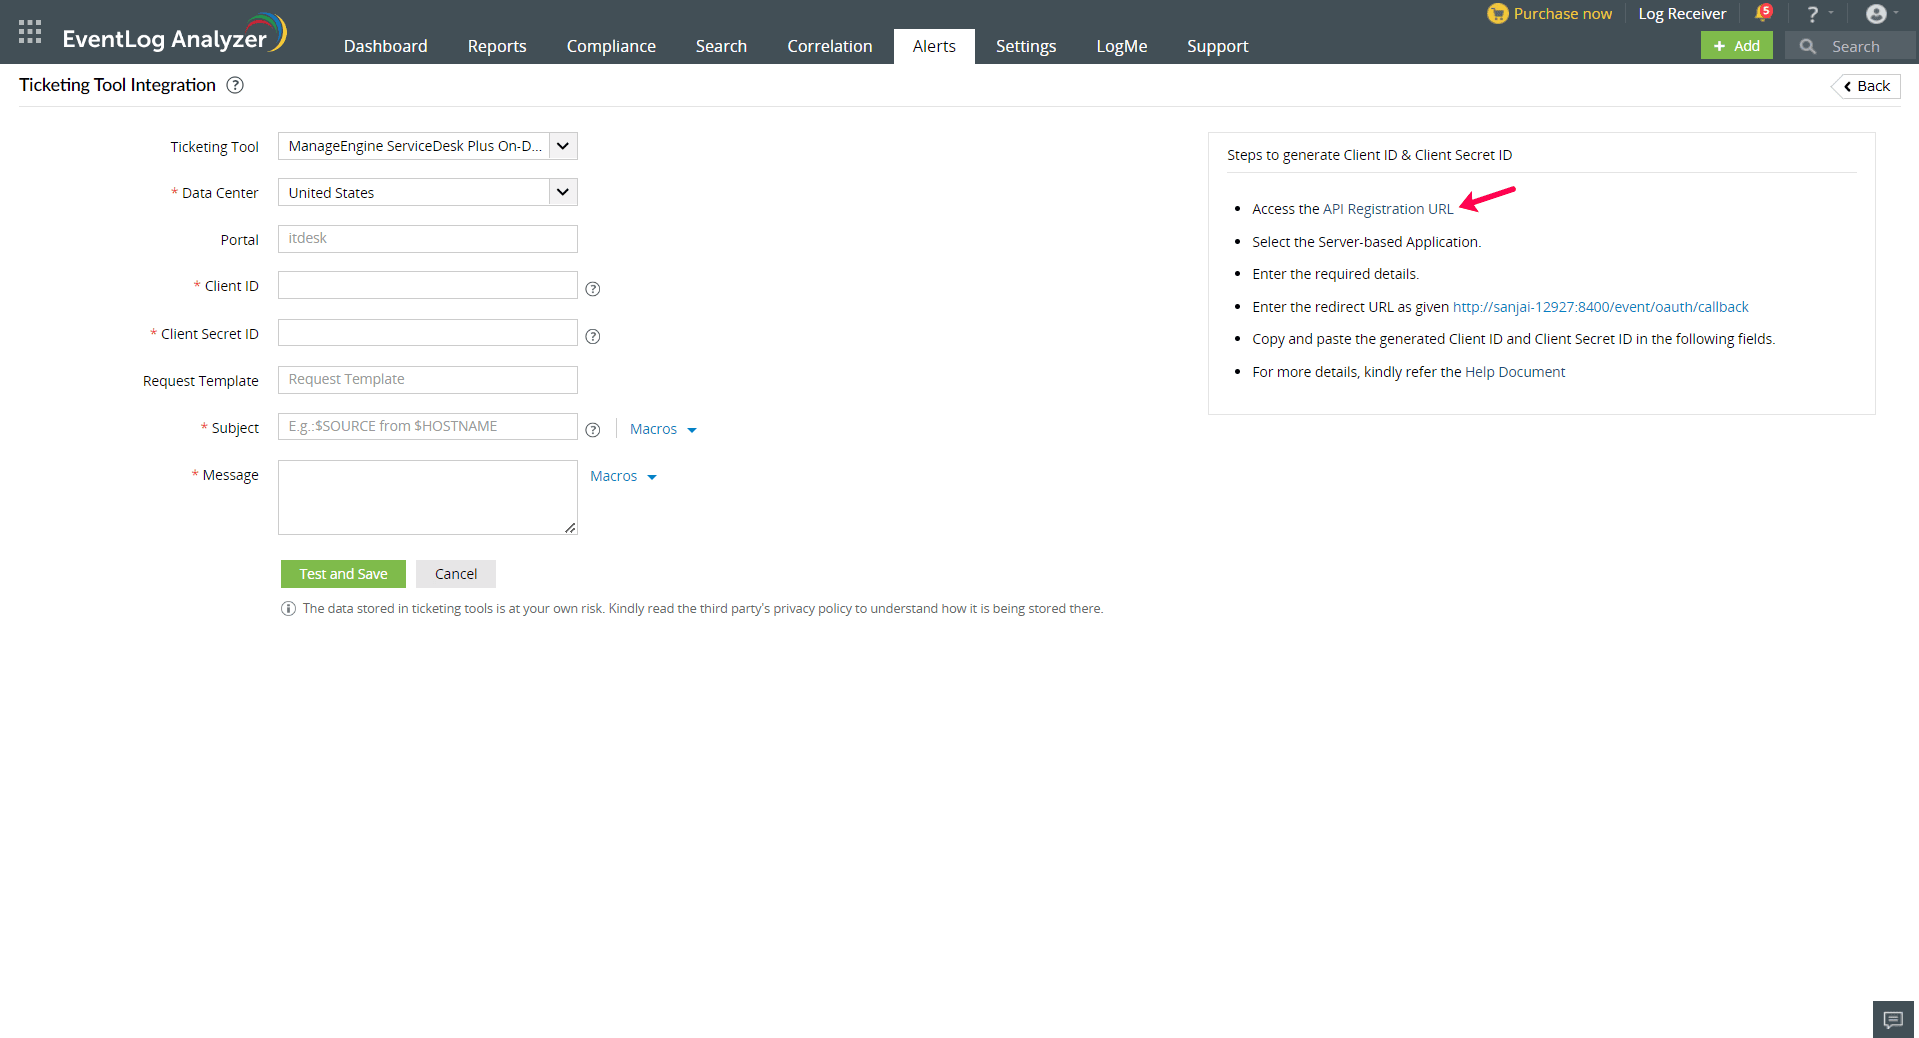
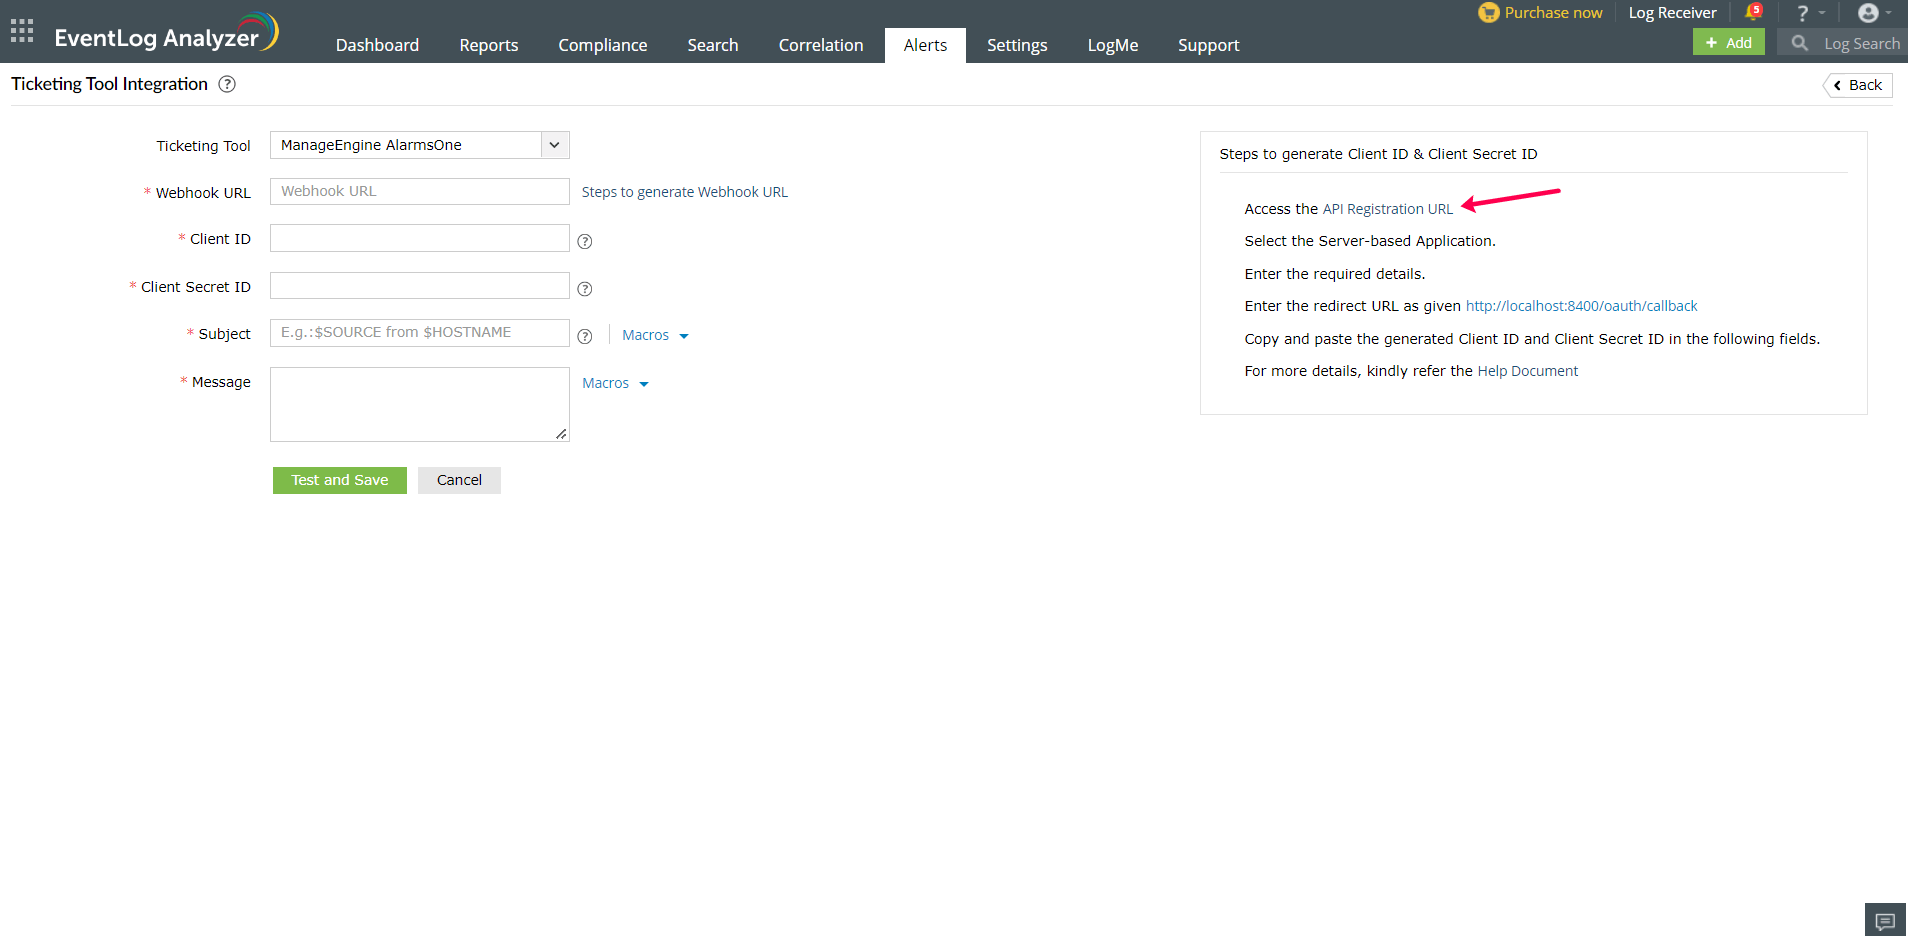
- Click the API Registration URL to generate the Client ID and Client Secret ID.
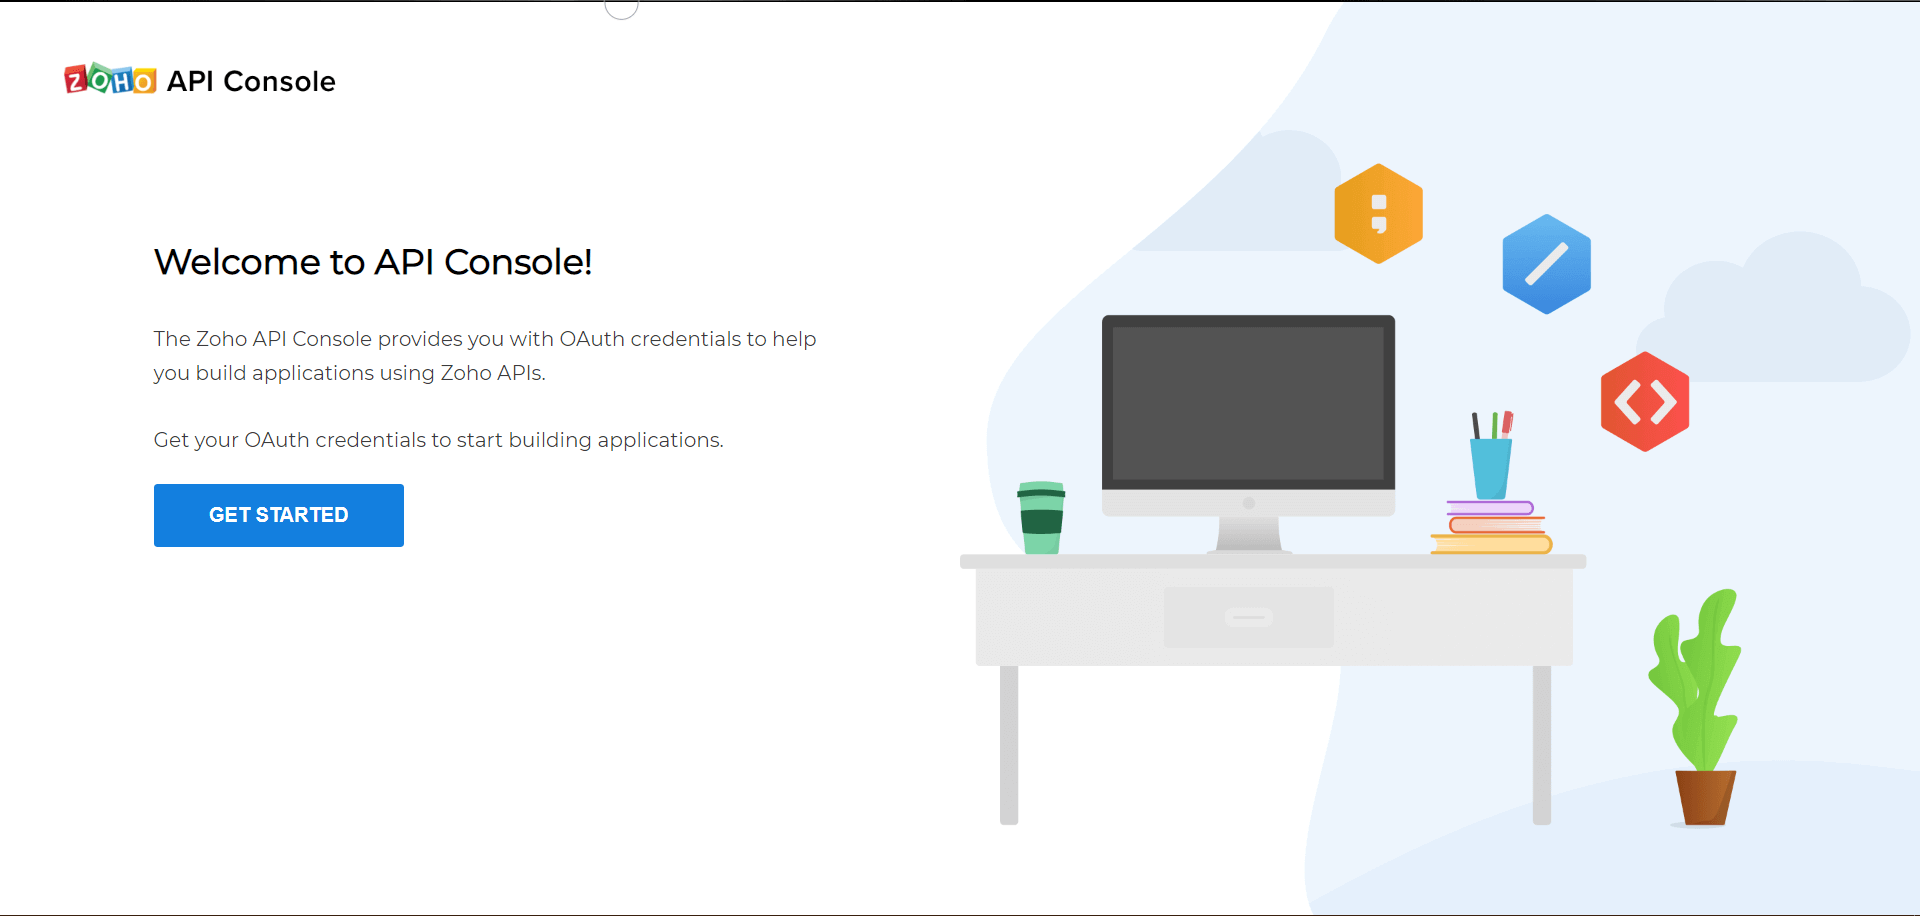
- Once the Zoho API Console is opened, click GET STARTED.
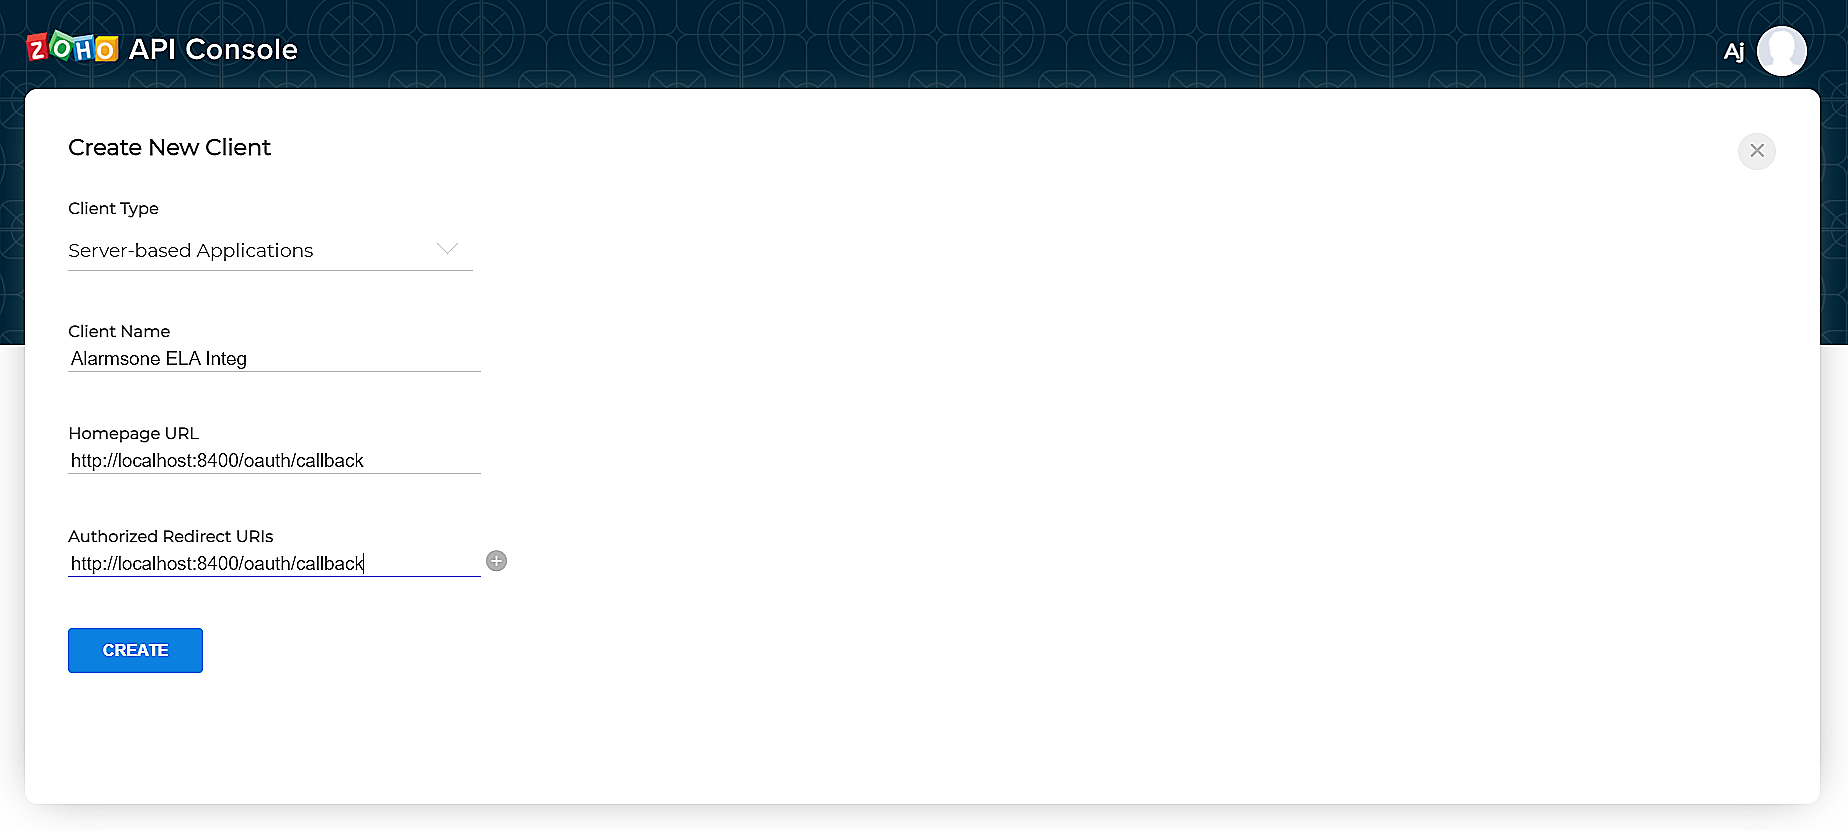
- Select the Server-based Applications tile.
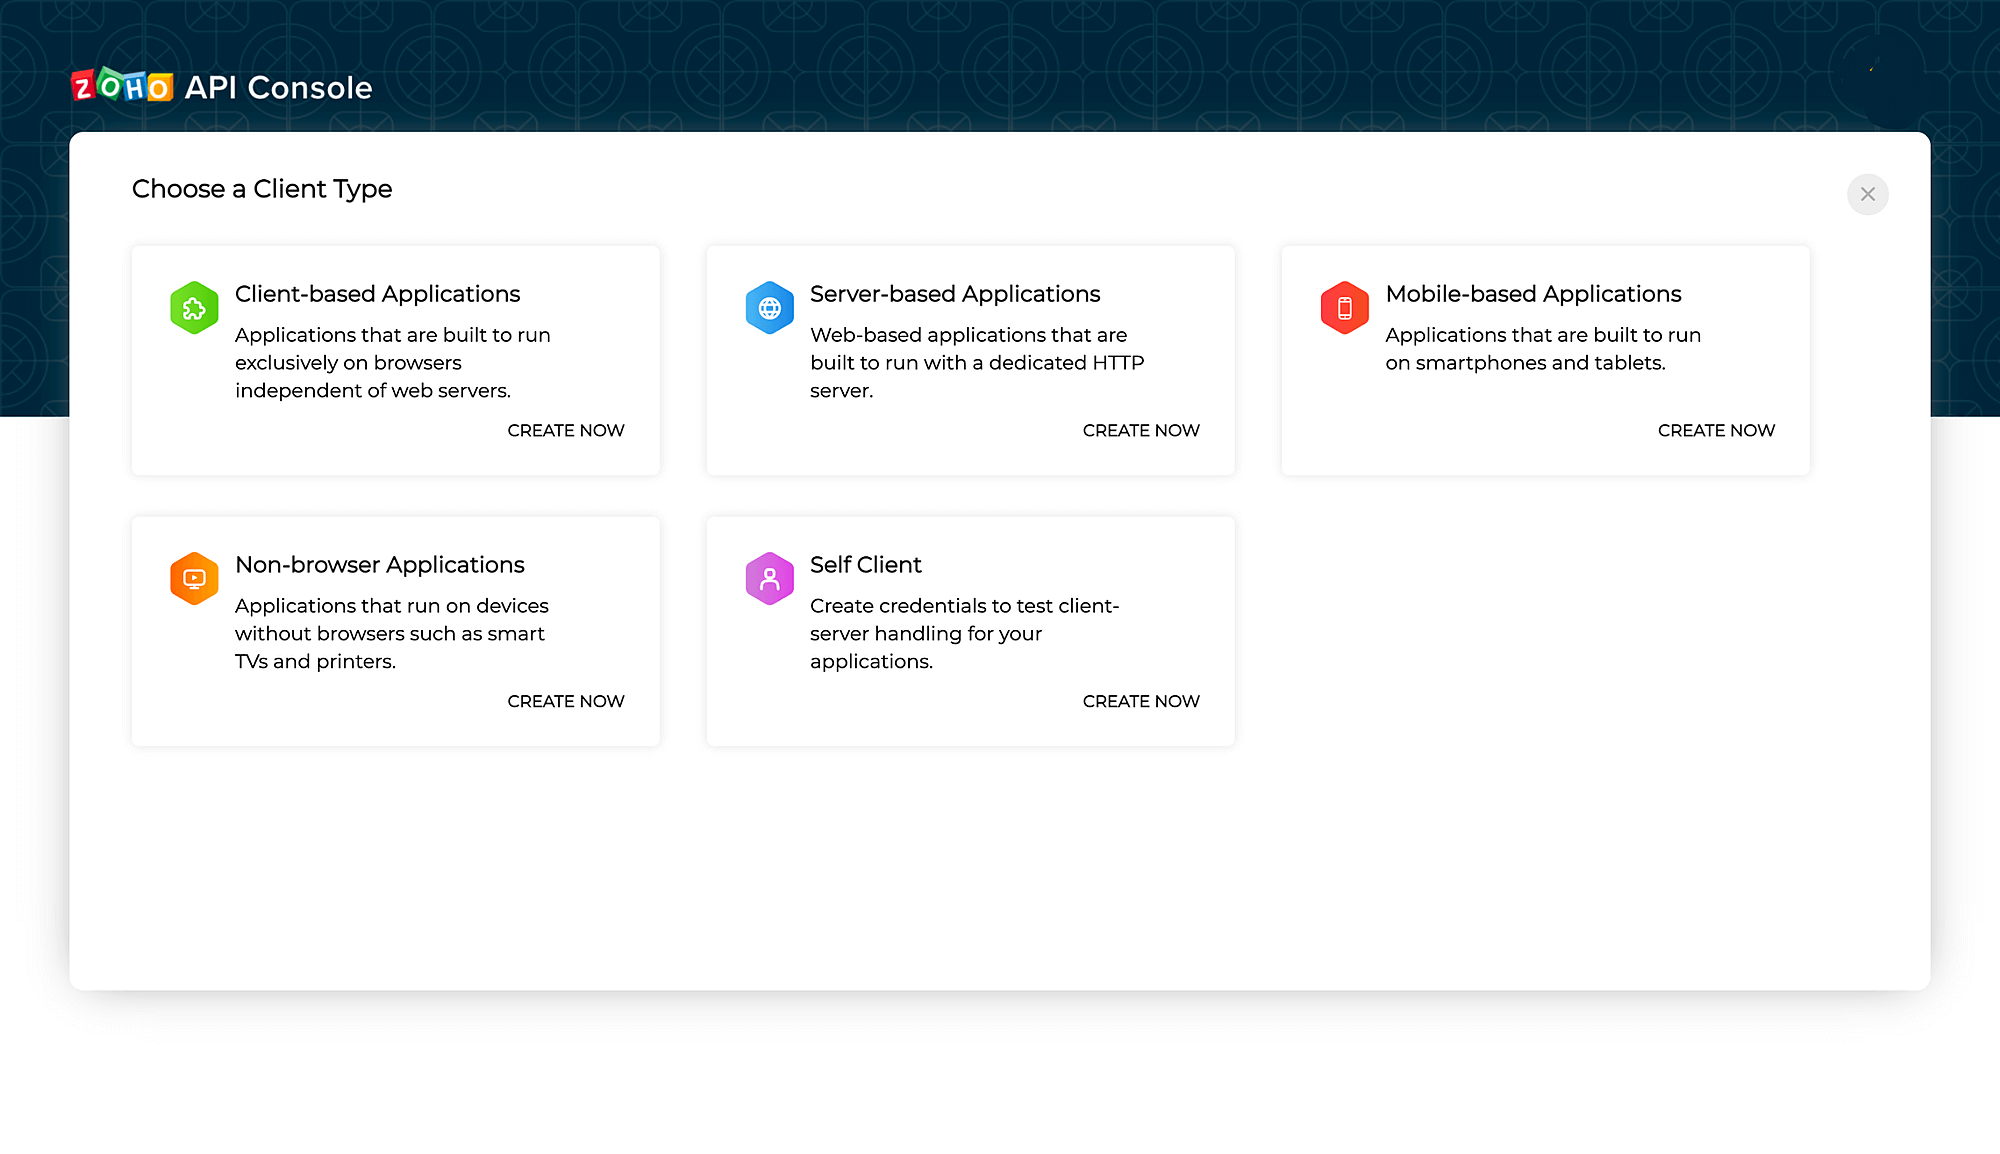
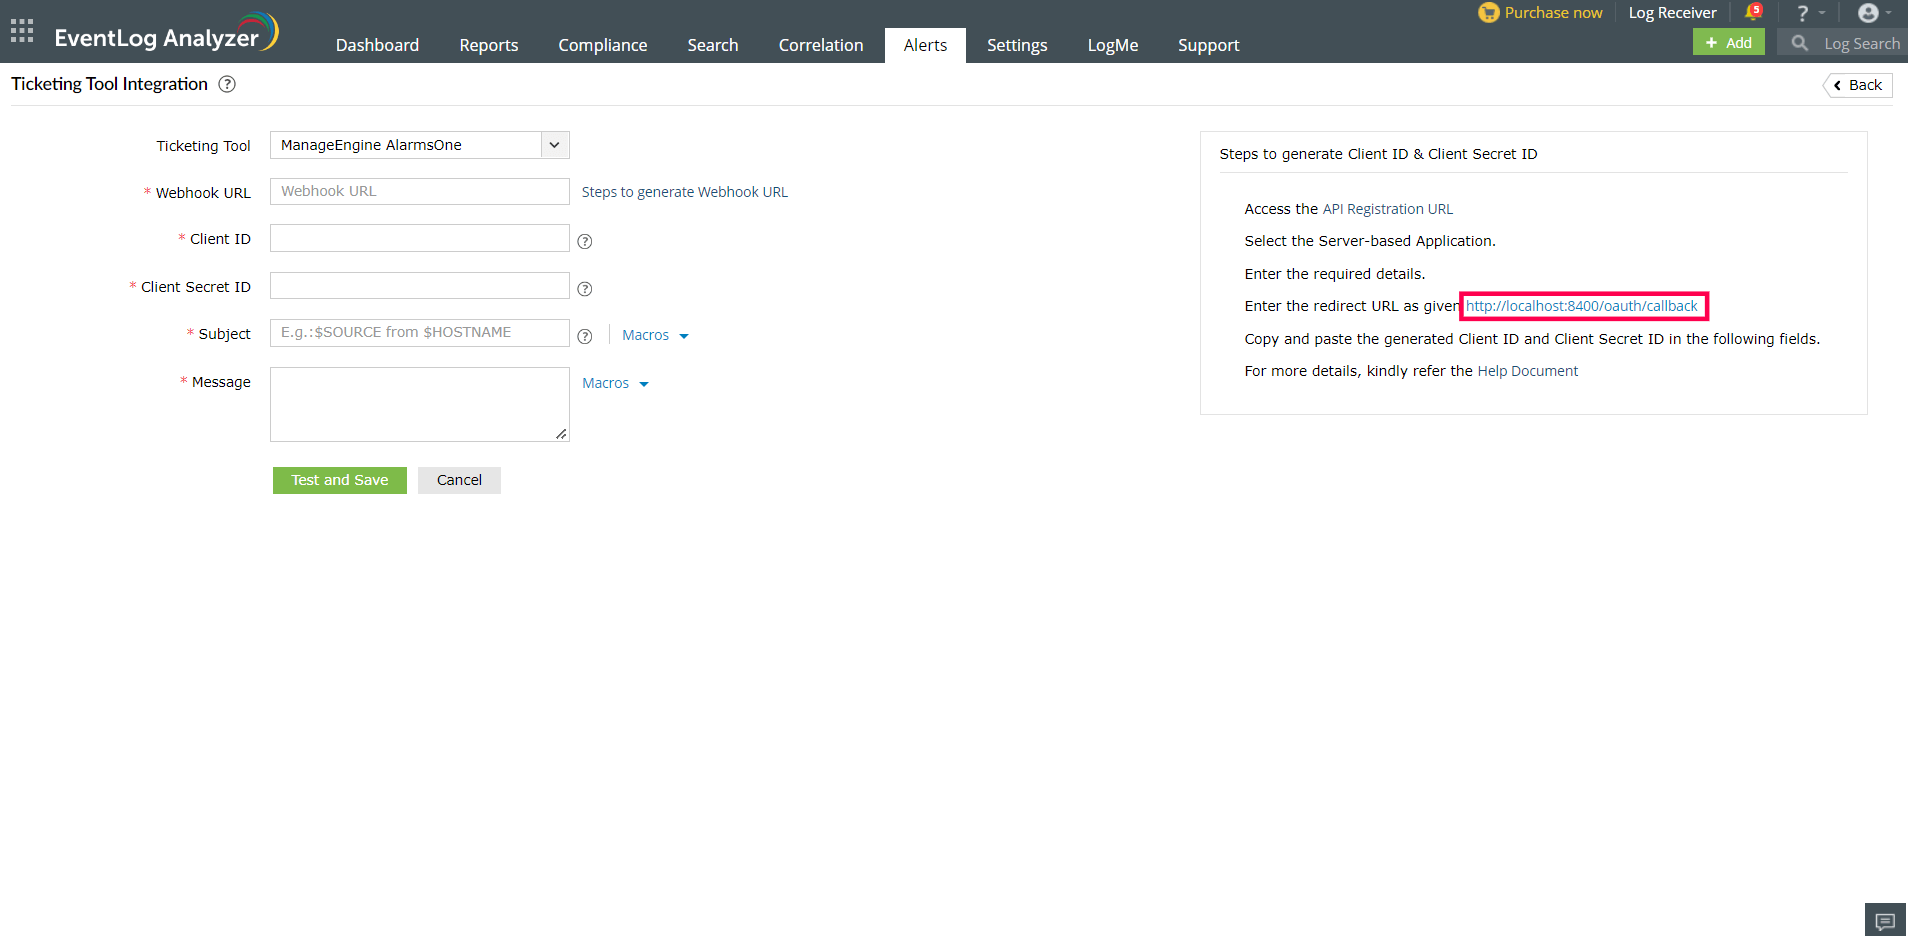
- To create a new client, enter the required details. Enter the redirect URL as given in the EventLog Analyzer console and click Create.
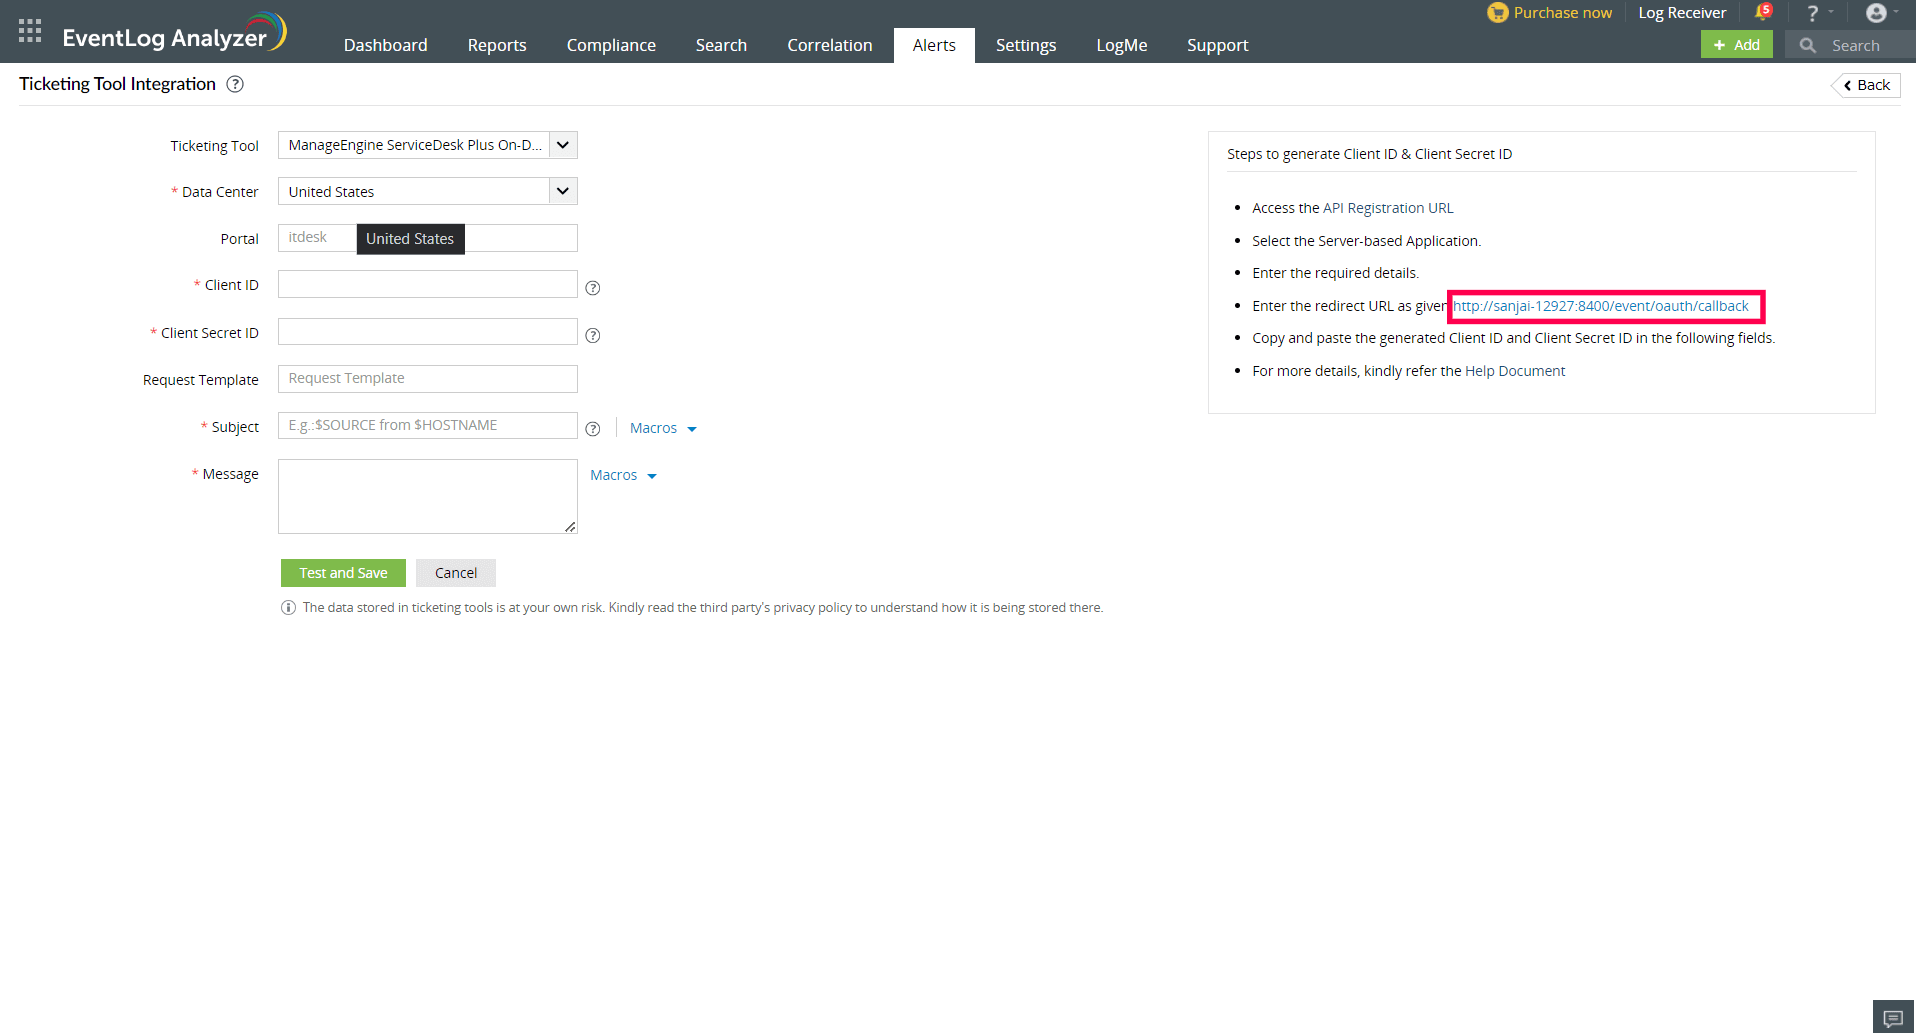
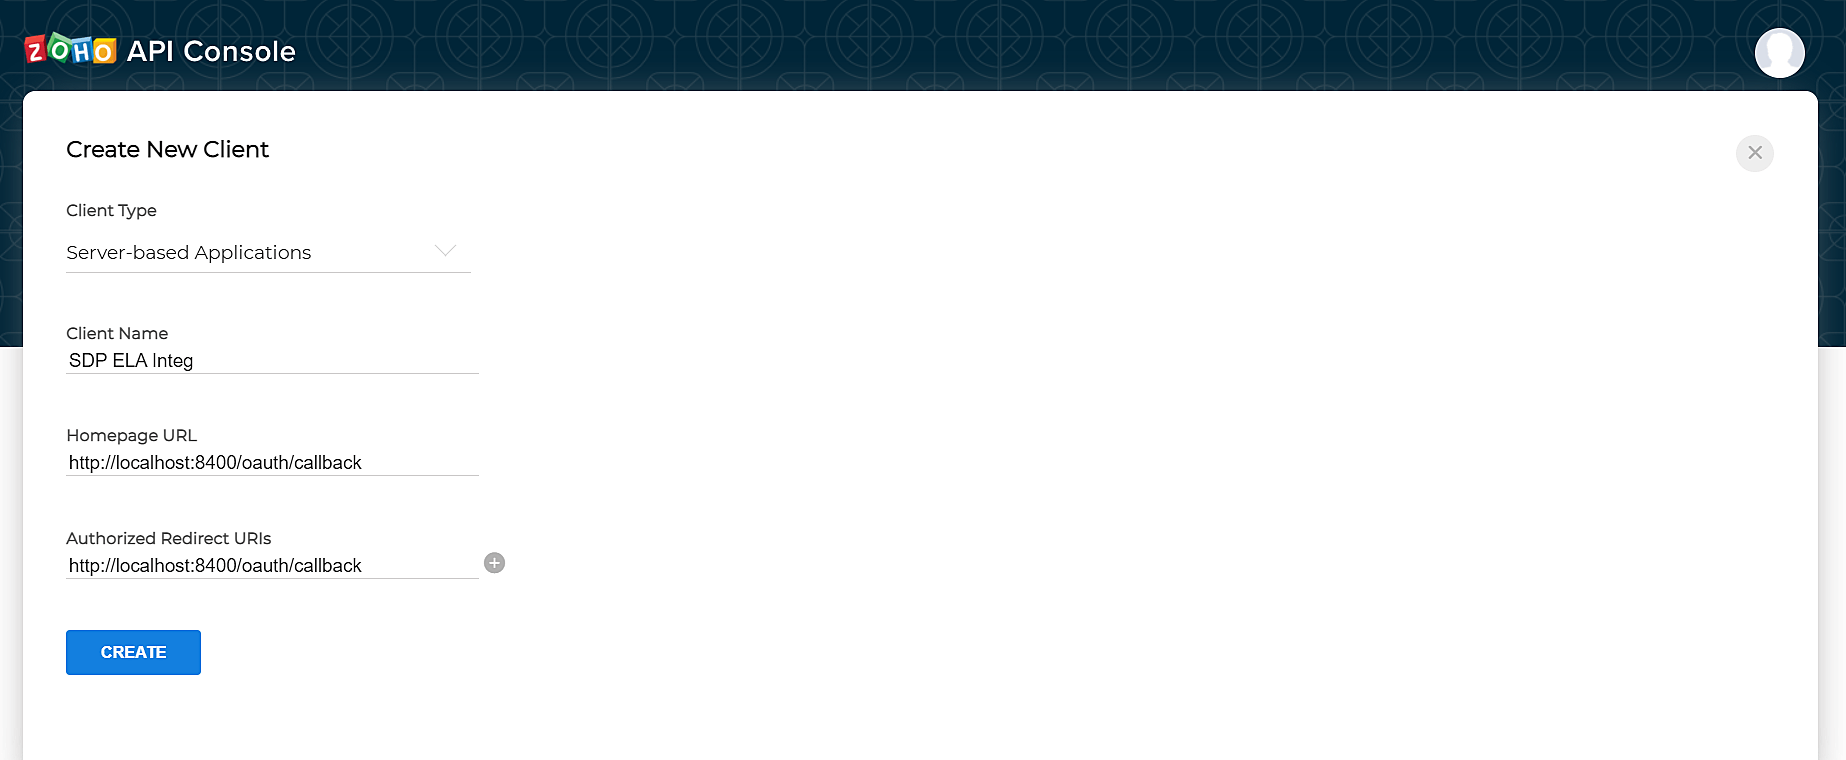
- Copy the generated Client ID and Client Secret ID.
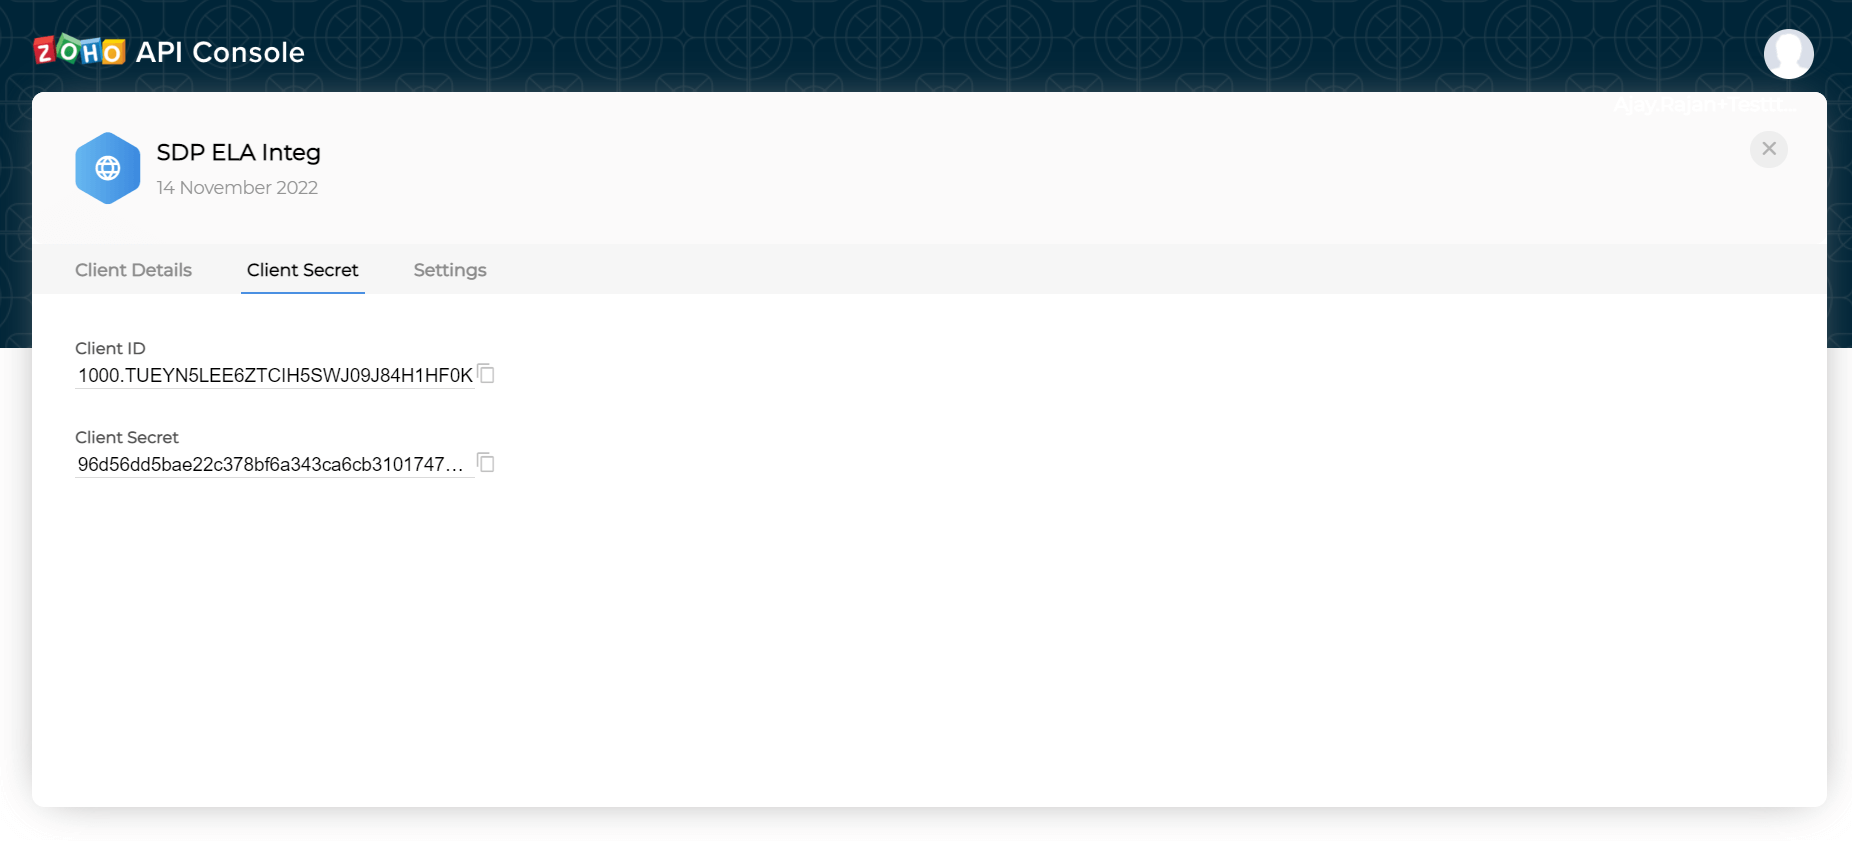
- Back in the ELA console, paste the Client ID and Client Secret ID in the corresponding fields.
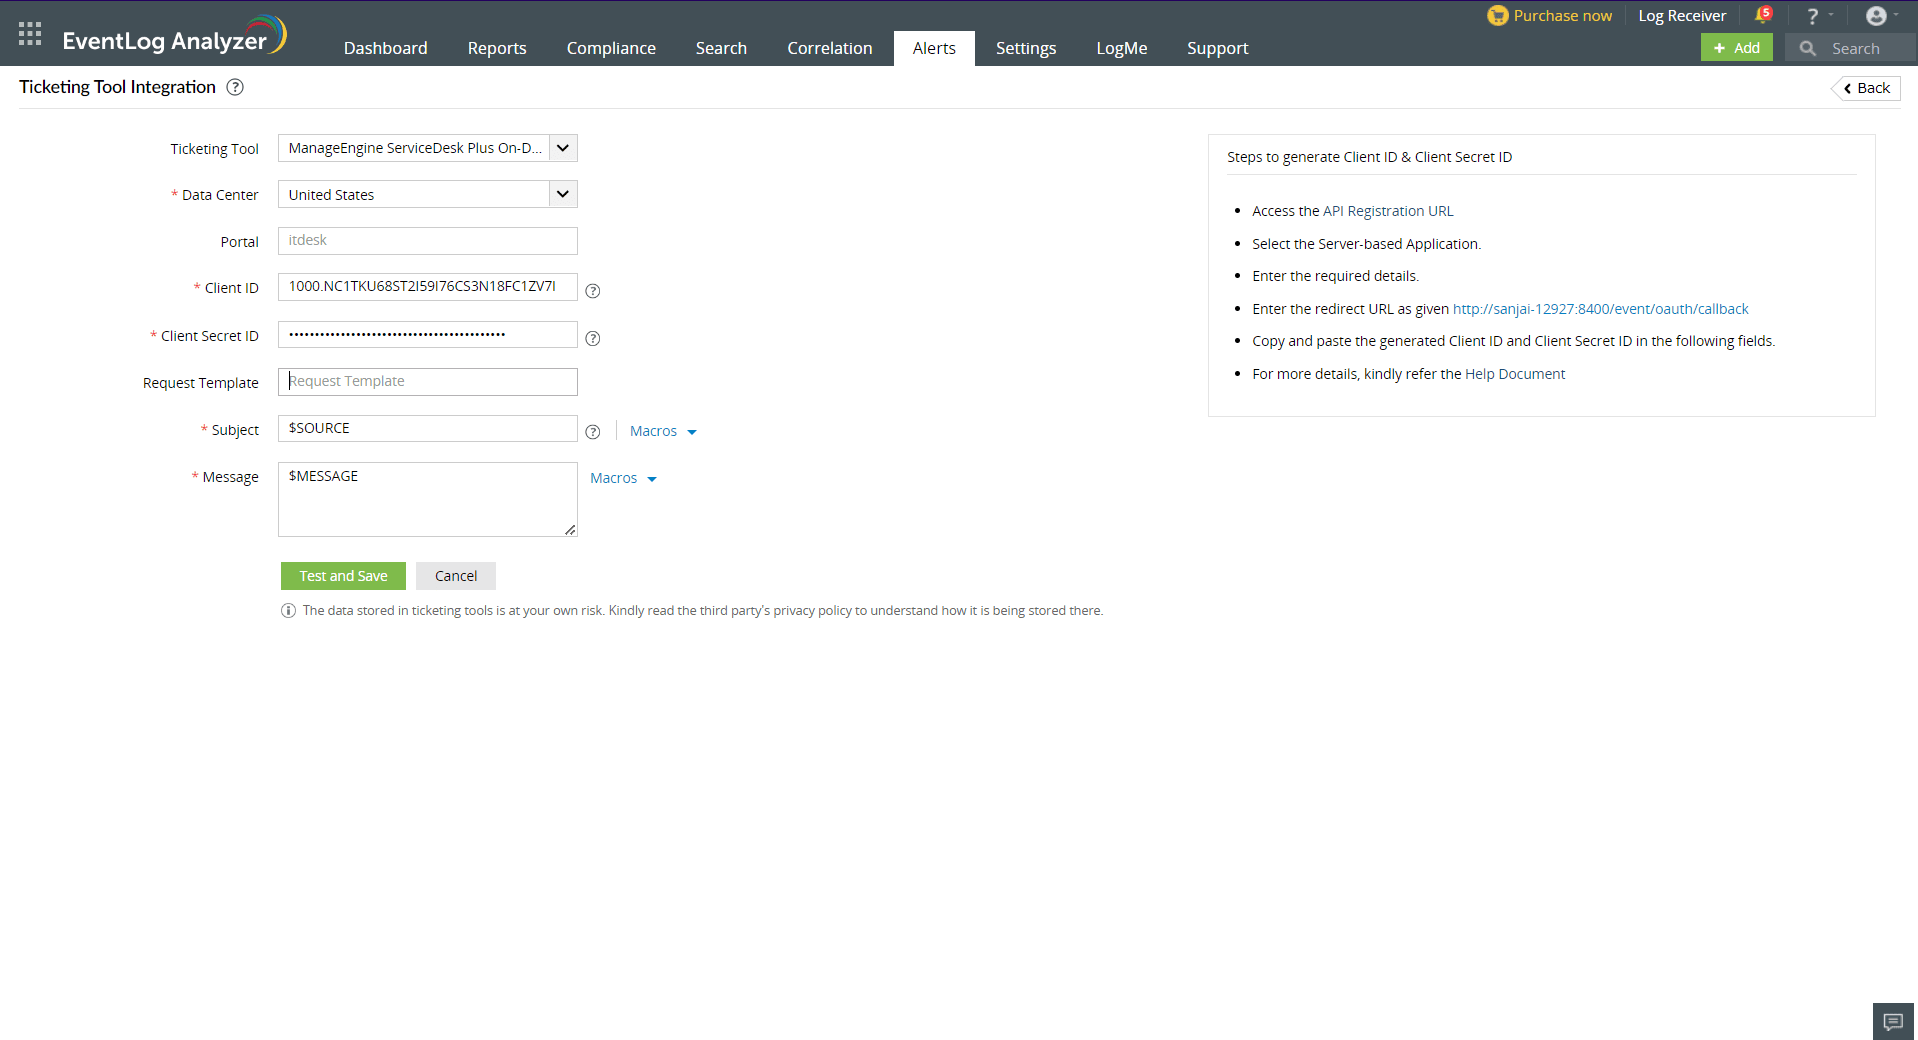
- Please specify the Request Template you want to use for creating tickets in ServiceDeskPlus OnDemand. Leaving it empty would raise tickets using the Default Template.
- Provide the Subject and Message for the alert—these can be selected from a predefined list under Macros or entered manually as per your requirements. Click the Test and Save button to proceed. Upon clicking, a verification popup will appear—click the URL provided to approve the integration with ServiceDesk Plus On-Demand clients.
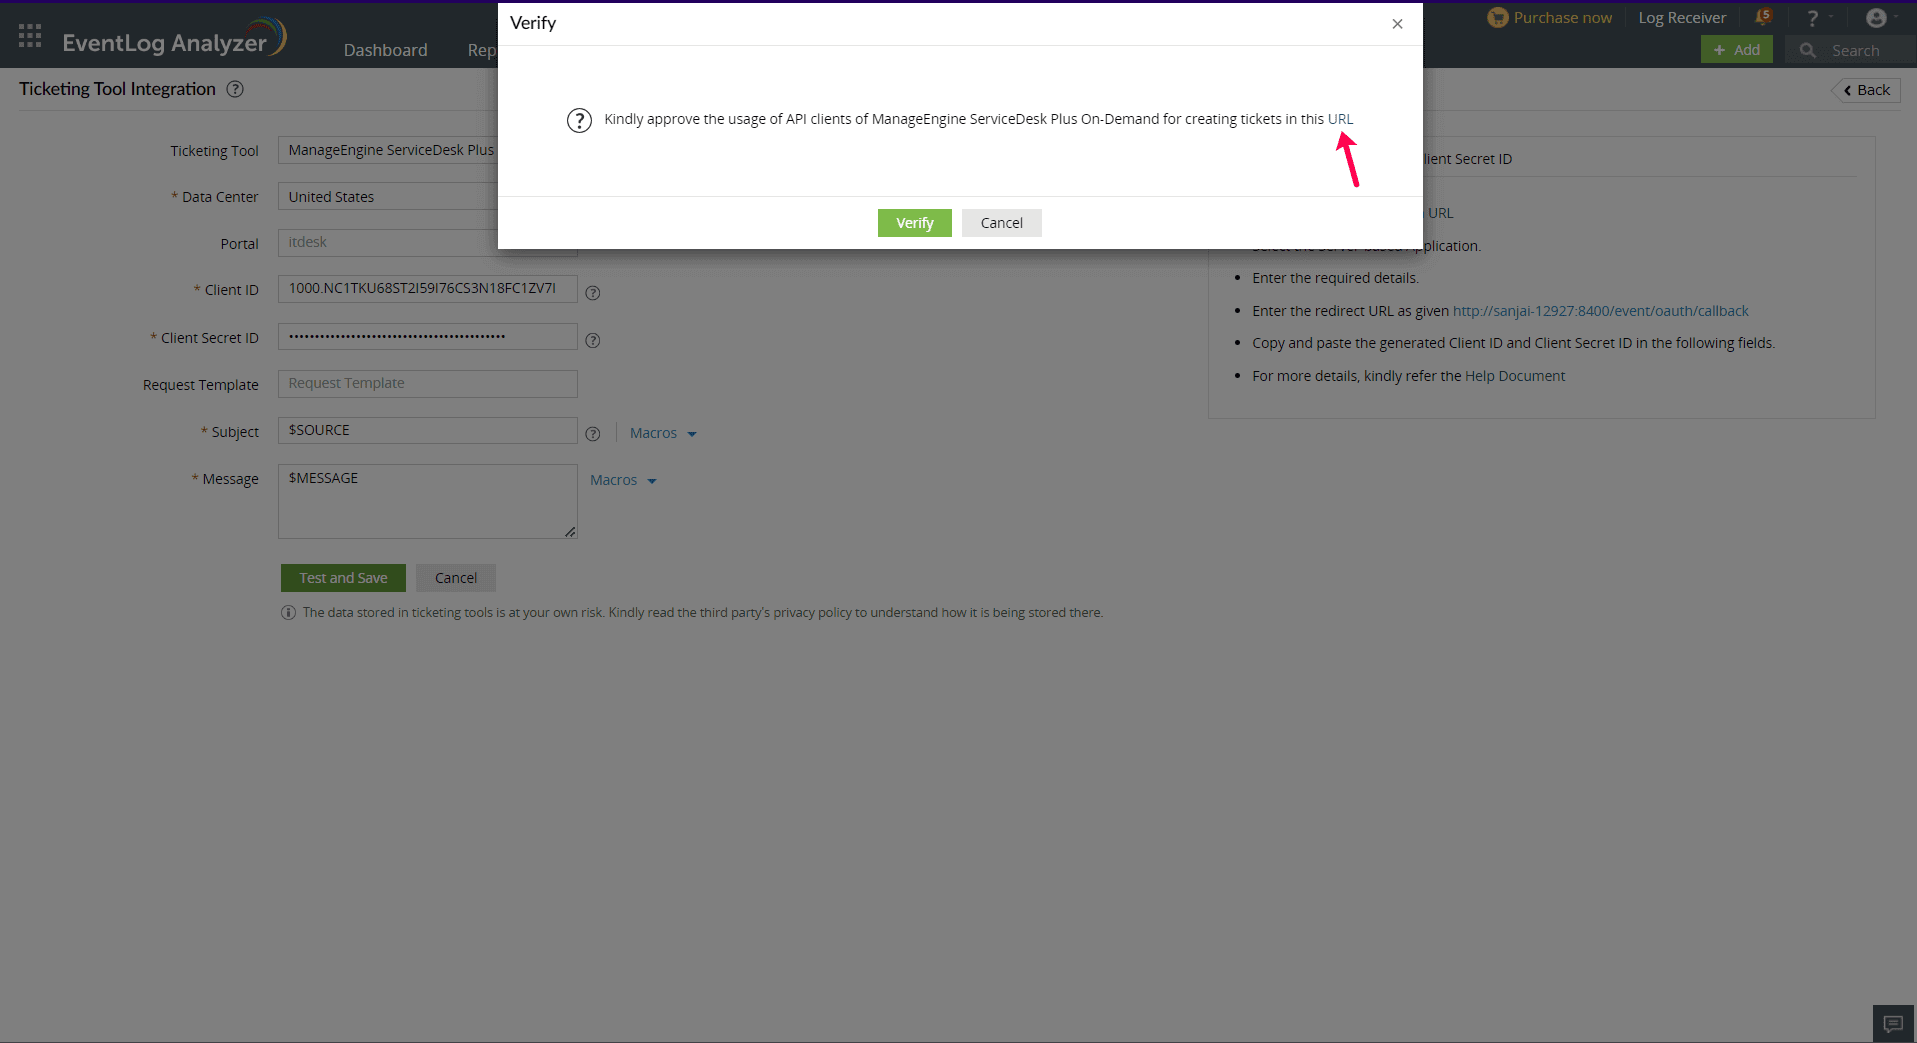
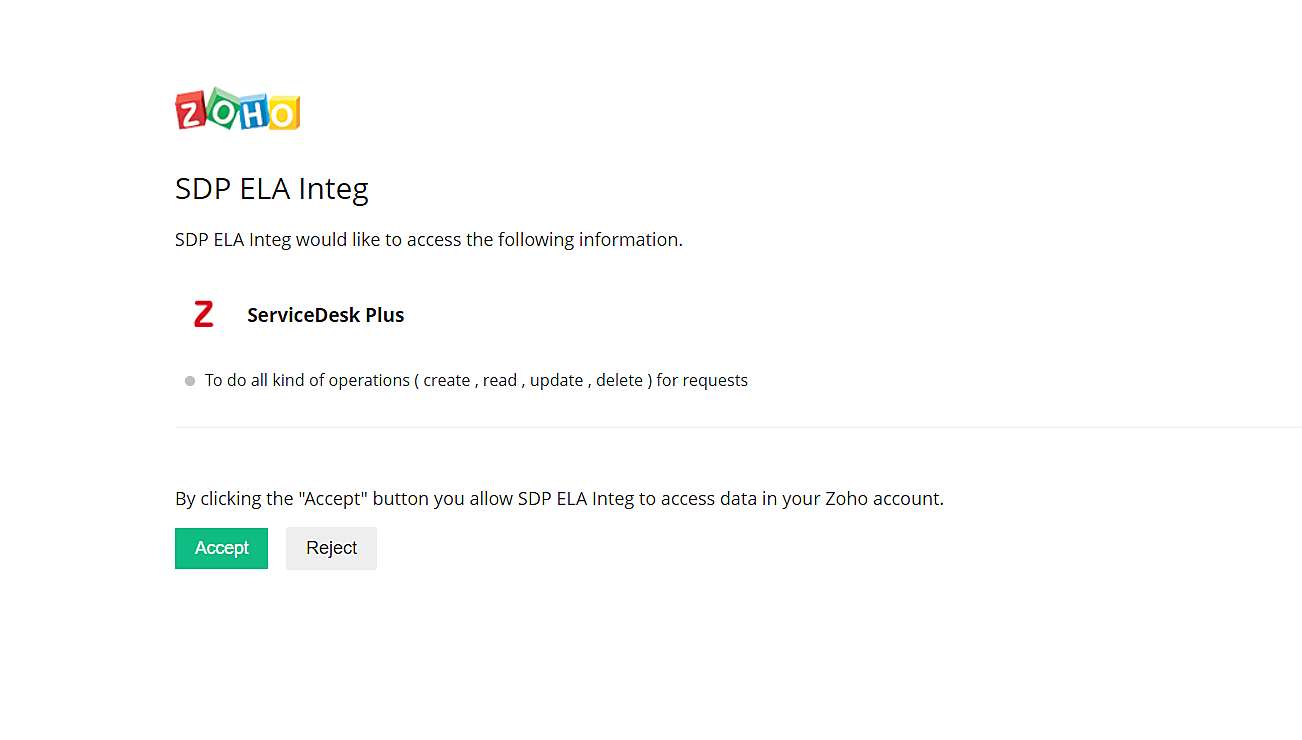
- Click Accept for API approval.
- Click the Verify button in ELA console. The ticketing tool will now be configured successfully.
Note: The ticketing tool as a configuration will fail if you have an organization-wide proxy configured. Please follow these
steps to include the organization-wide proxy certificate in EventLog Analyzer.
For ManageEngine AlarmsOne
Note: Only users with the super admin or the alarm admin role can proceed with the configuration.
In EventLog Analyzer, navigate to the Alerts tab and click Ticketing Tool Integration under Alert Configuration. From the Ticketing Tool drop-down list, select ManageEngine AlarmsOne.
- Open ManageEngine AlarmsOne and click the Applications icon, then click Applications(+) button in the left panel. From the list displayed, select Custom API Integration.
- Enter an Application Label and Application Name. If a notification profile is already configured, select it. Click Add. You can also associate a notification profile later.
- A Webhook URL specific to your custom app is generated.
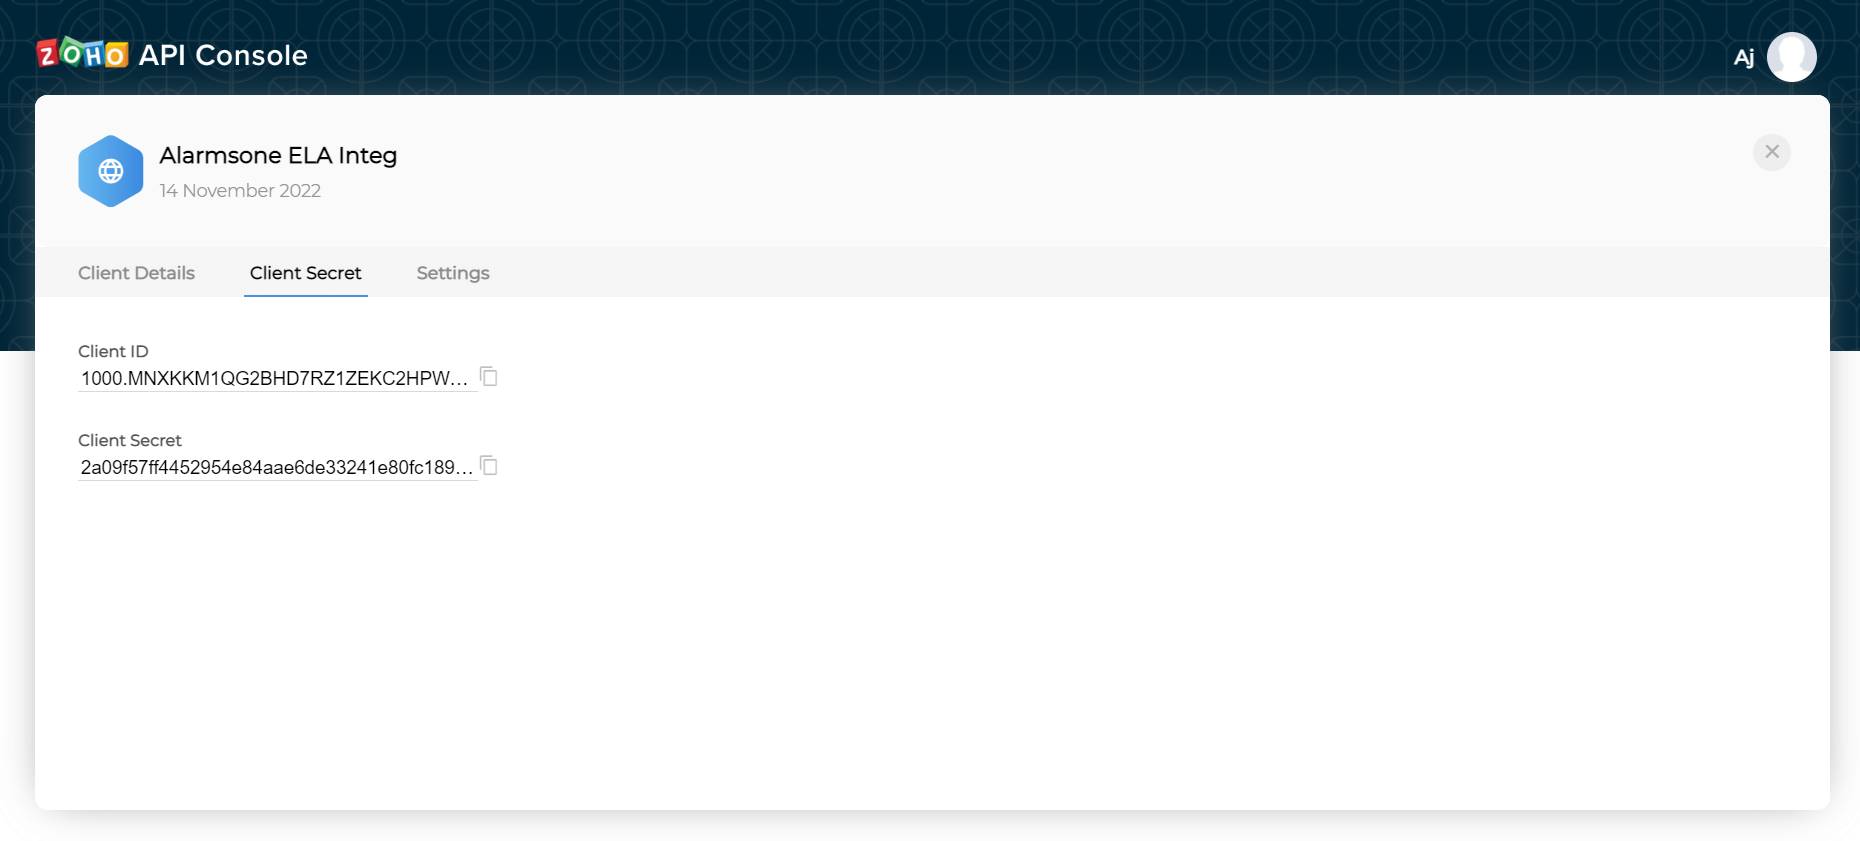
- Click API Registration URL in EventLog Analyzer, to generate a Client ID and Client Secret ID.
- Once the Zoho API Console is opened, click GET STARTED.
- Select the Server-based Applications tile.
- To create a new client, enter the required details. Enter the redirect URL as given in the EventLog Analyzer console and click Create.
- Copy the generated Client ID and Client Secret ID.
- Back in the ELA console, paste the Webhooks URL, Client ID, and Client Secret ID in the required fields.
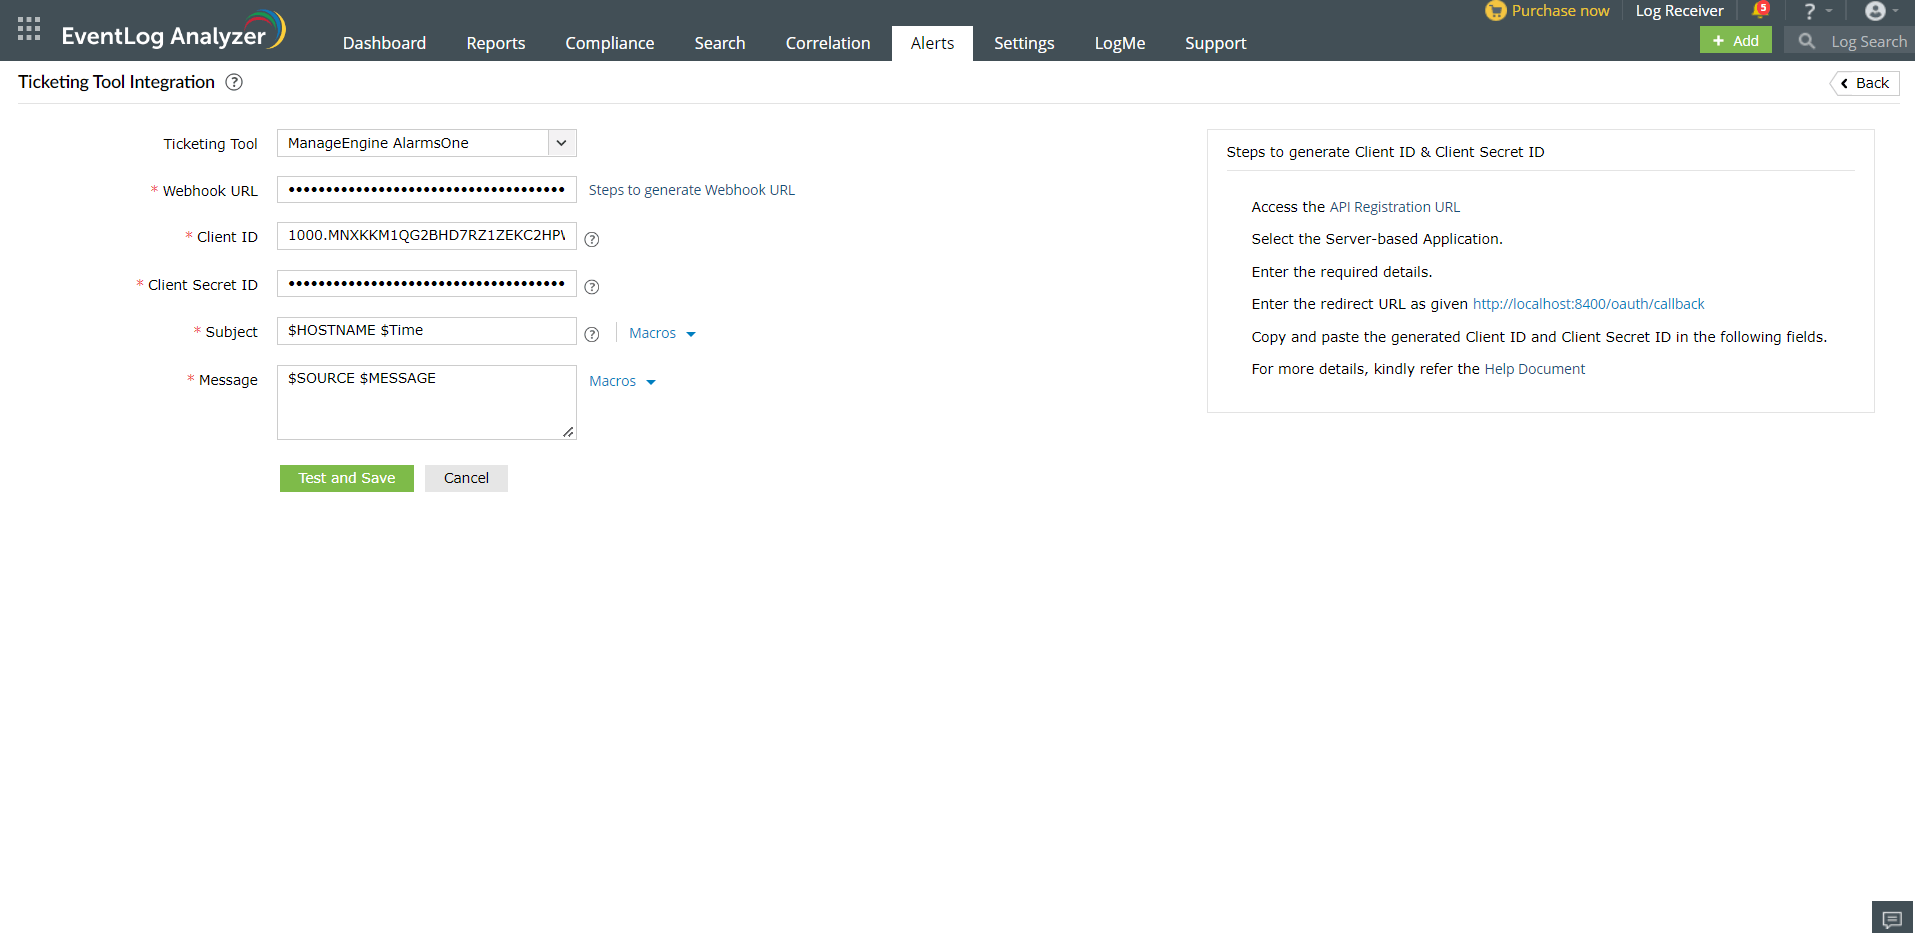
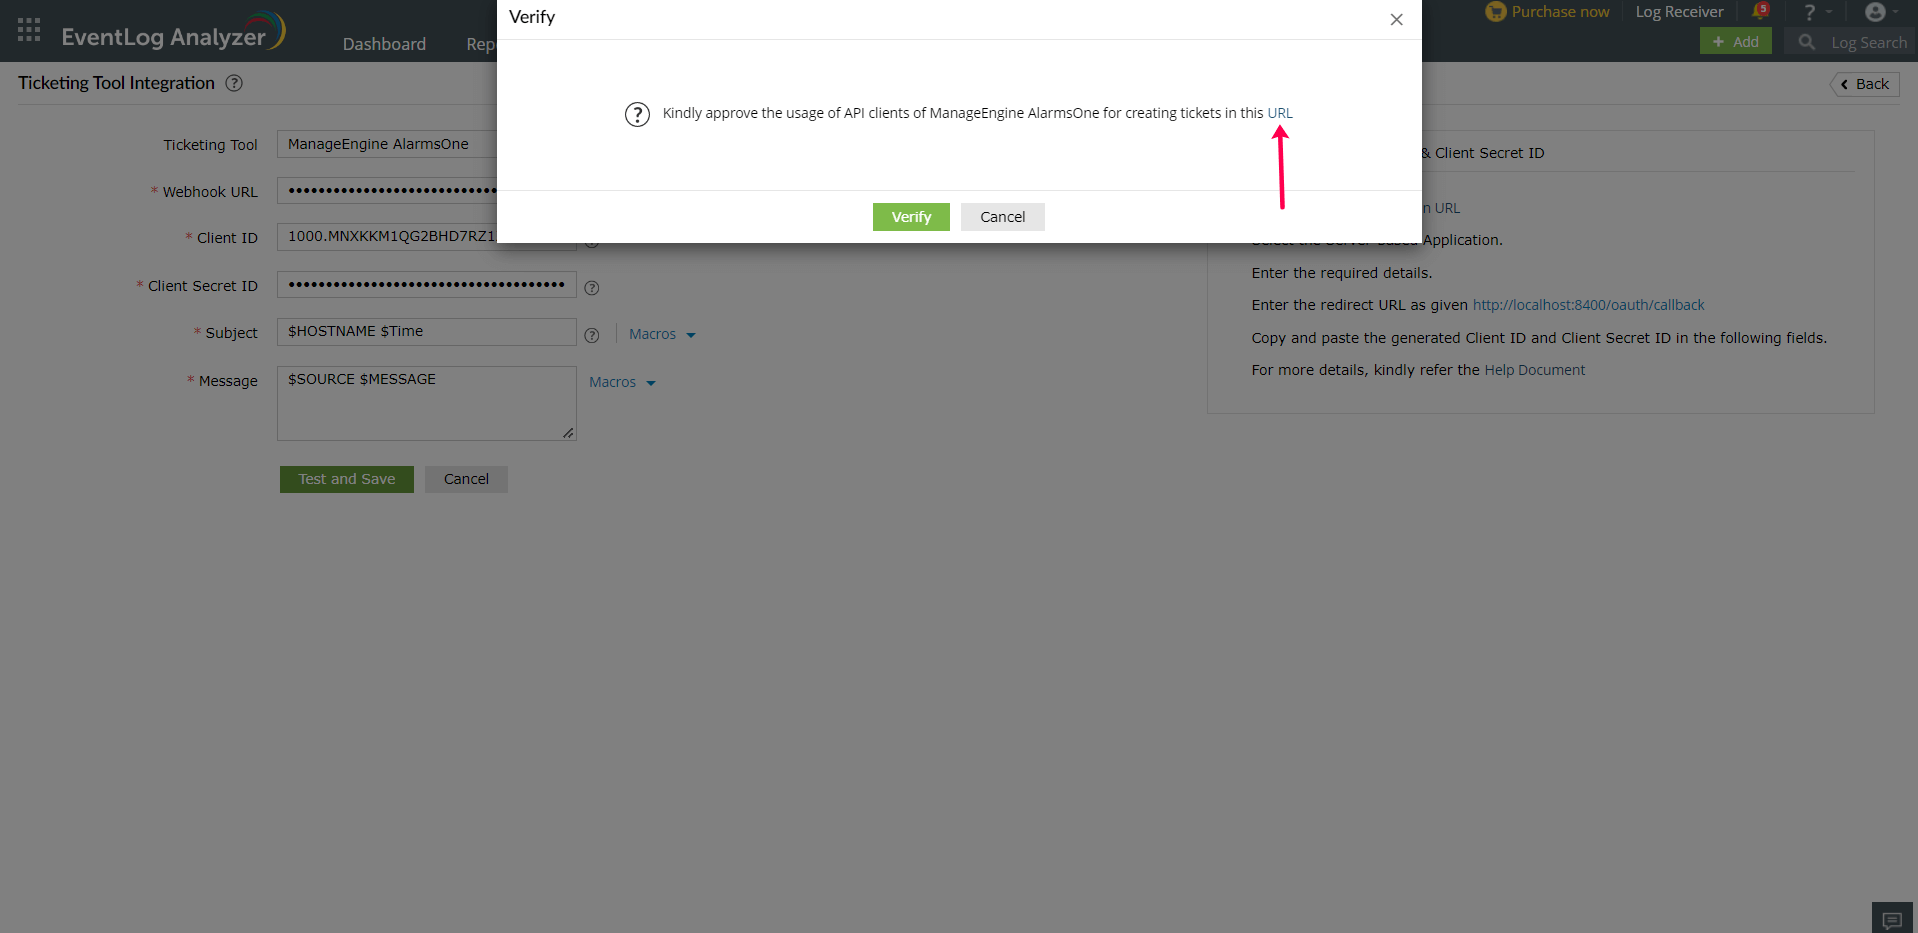
- Enter the Subject and the Message for the alert. You can select them from the predefined list available under Macros or type your own. Click the Test and Save button. On clicking the Test and Save button, a verify popup will be displayed. Click the URL to approve the usage of the clients of ManageEngine AlarmsOne.
- Click Accept for API approval.
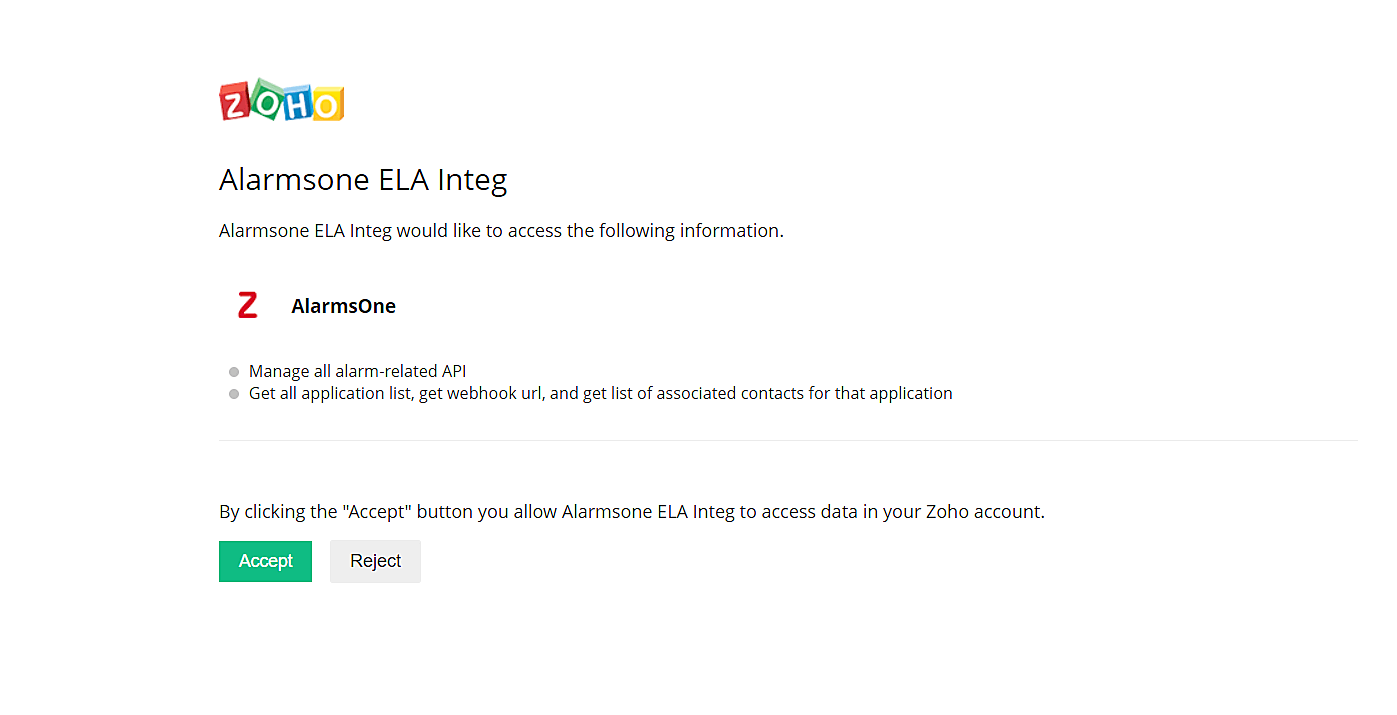
Click Verify button in ELA. The ticketing tool will now be configured successfully.
Note: The ticketing tool as a configuration will fail if you have an organization-wide proxy configured. Please follow these
steps to include the organization-wide proxy certificate in EventLog Analyzer.
For ServiceNow
Note: Only users with permissions to view and edit requests can proceed with the configuration.
In EventLog Analyzer, navigate to the Alerts tab and click Ticketing Tool Integration under Alert Configuration. From the Ticketing Tool drop-down list, select ServiceNow.
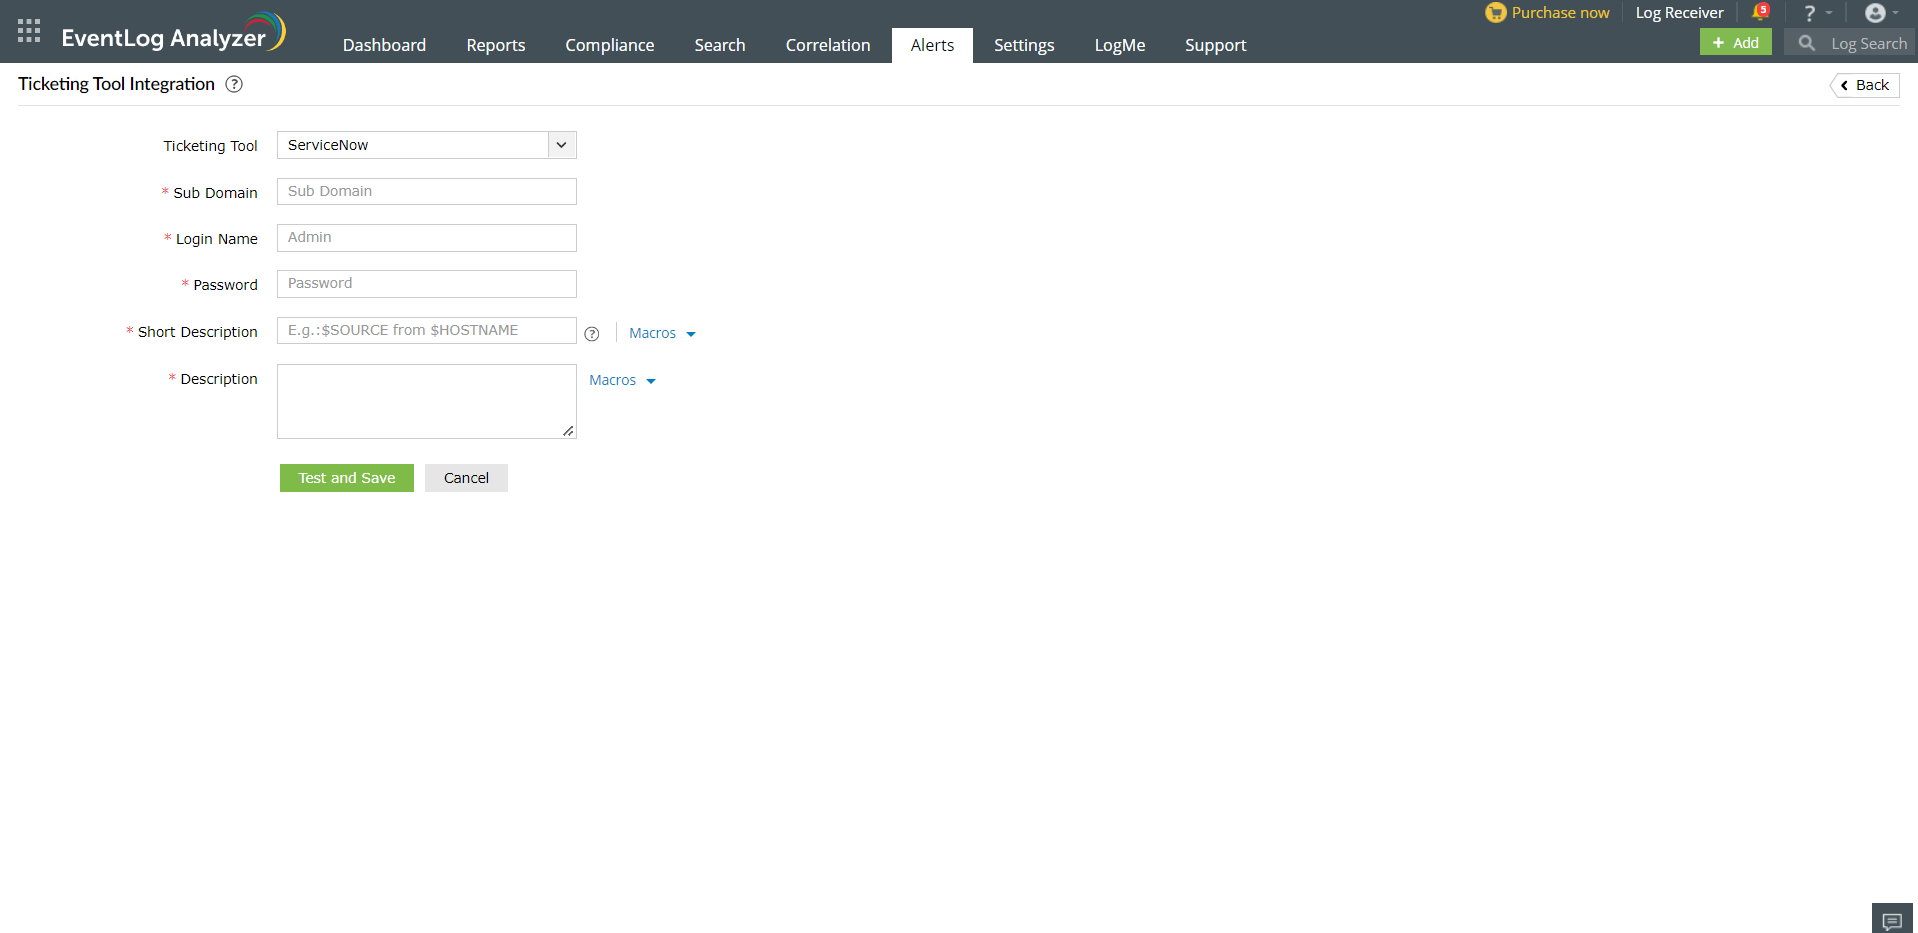
- Enter the ServiceNow subdomain name or IP address.
- Enter the login name and password of a valid account in the ticketing tool.
- Enter the Short Description and the Description for the alert. You can select them from the predefined list available under Macros or type your own.
- Click the Test and Save button to establish communication and complete configuration.
Note: The ticketing tool as a configuration will fail if you have an organization-wide proxy configured. Please follow these
steps to include the organization-wide proxy certificate in EventLog Analyzer.
For JIRA Service Desk On-Demand
Note: Only users with permissions to view and edit requests can proceed with the configuration.
To configure EventLog Analyzer with Jira Service Desk On-Demand, you need to first get some details from your Jira ticketing tool. Go to the Official JIRA Cloud Doc to get the API Token.
- After logging into your Jira Service Desk On-Demand account, click the settings icon on the top right corner and select Projects.
- In the project list, note down the Key corresponding to the project in which you want your tickets to be raised.
- Click the settings icon on the top right corner and select Issues.
- Note down the type of issues that the particular project can hold. The issues raised from EventLog Analyzer should have the same type for a ticket to be successfully raised in Jira Service Desk On-Demand.
In EventLog Analyzer, navigate to the Alerts tab and click Ticketing Tool Integration under Alert Configuration. From the Ticketing Tool drop-down list, select Jira Service Desk On-Demand.
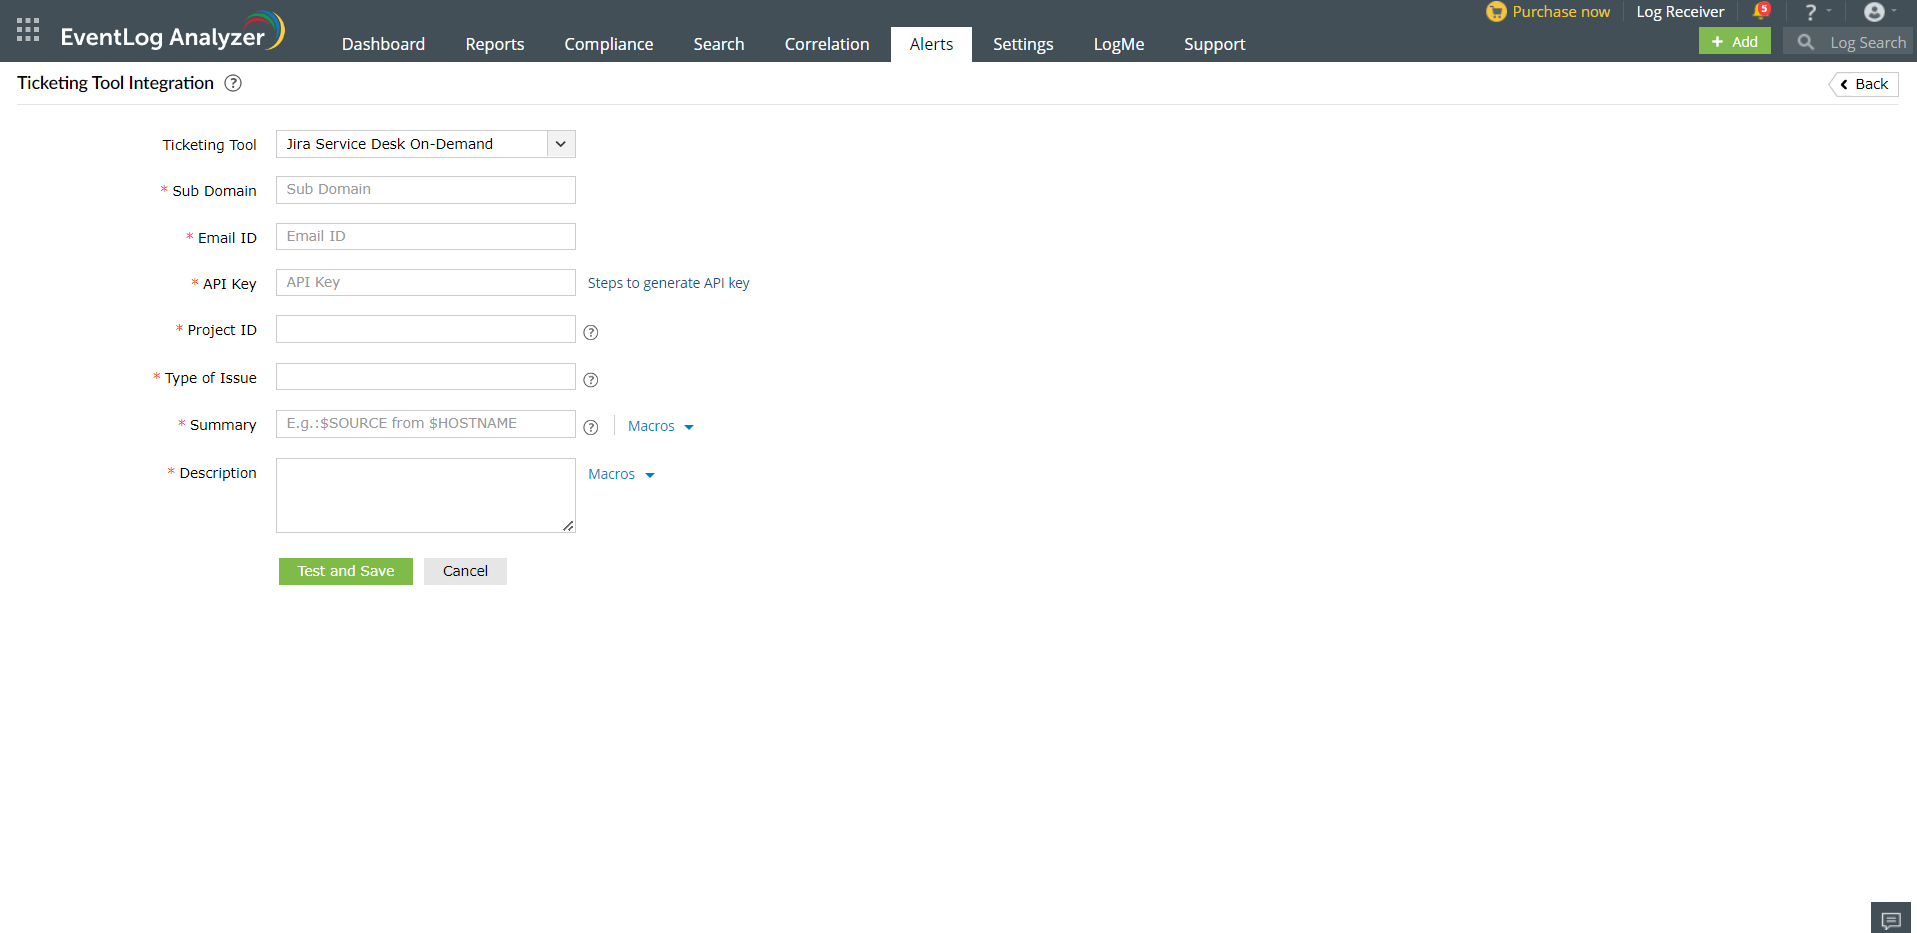
- Enter the Jira Service Desk On-Demand Subdomain.
- Enter your JIRA Account Email ID.
- Enter the API key that we got in the previous step.
- Enter the Project ID. This is the Key of the particular project noted from the ticketing tool.
- Enter the type of issue. This has to be the same issue type that the project has been configured to hold.
- Enter the Summary and the Description for the alert. You can select them from the predefined list available under Macros or type your own.
- Click the Test and Save button to establish communication and complete configuration.
Note: The ticketing tool as a configuration will fail if you have an organization-wide proxy configured. Please follow these
steps to include the organization-wide proxy certificate in EventLog Analyzer.
For Zendesk
Note: Only users with Admin/Agent privilege can proceed with the configuration.
Configuring Zendesk with OneAuth authentication:
Note: If your EventLog Analyzer server is running on HTTP, you can configure Zendesk using OAuth only from the installed machine.
To configure EventLog Analyzer with Zendesk, you will need to retrieve some information from your Zendesk ticketing tool:
- After logging into your Zendesk account, click the tray icon in the top bar and click Admin Center.
- In Admin Center, click Apps and integrations in the sidebar > select APIs > Zendesk API > OAuth Clients.
- Click the + icon to create a new OAuth Client
- Enter the client name, description, and name of the company. Select a logo.
- Select Confidential for Client Kind field.
- Enter the redirect URL as given in the EventLog Analyzer console in Redirect URLs field.
- Copy the value that appears corresponding to Unique Identifier and save it in a separate document.
- Once you click Save, a secret code will appear above the Save button. Click Copy and save it in a separate document. This would also be needed while configuring Zendesk in EventLog Analyzer.
- Click Close and open EventLog Analyzer to complete the configuration process.
Configuring Zendesk with Basic API authentication:
- Click the Admin icon in the sidebar, then select Channels → API.
- Click the Settings tab, and make sure Token Access is enabled.
- Click the + button to the right of Active API Tokens.
- Optionally, enter a description under API Token Description. The token is generated, and displayed.
- Copy the token, and paste it somewhere secure. Once you close this window, the full token will never be displayed again.
- Click Save to return to the API page. A truncated version of the token is displayed.
Configuration in EventLog Analyzer for Zendesk integration:
In EventLog Analyzer, navigate to the Alerts tab and click Ticketing Tool Integration under Alert Configuration. From the Ticketing Tool drop-down list, select Zendesk.
- Enter the Zendesk subdomain name in the given field.
- Under Authentication, you can choose either OneAuth or Basic API.
- If you choose OneAuth under Authentication, follow the steps given below.
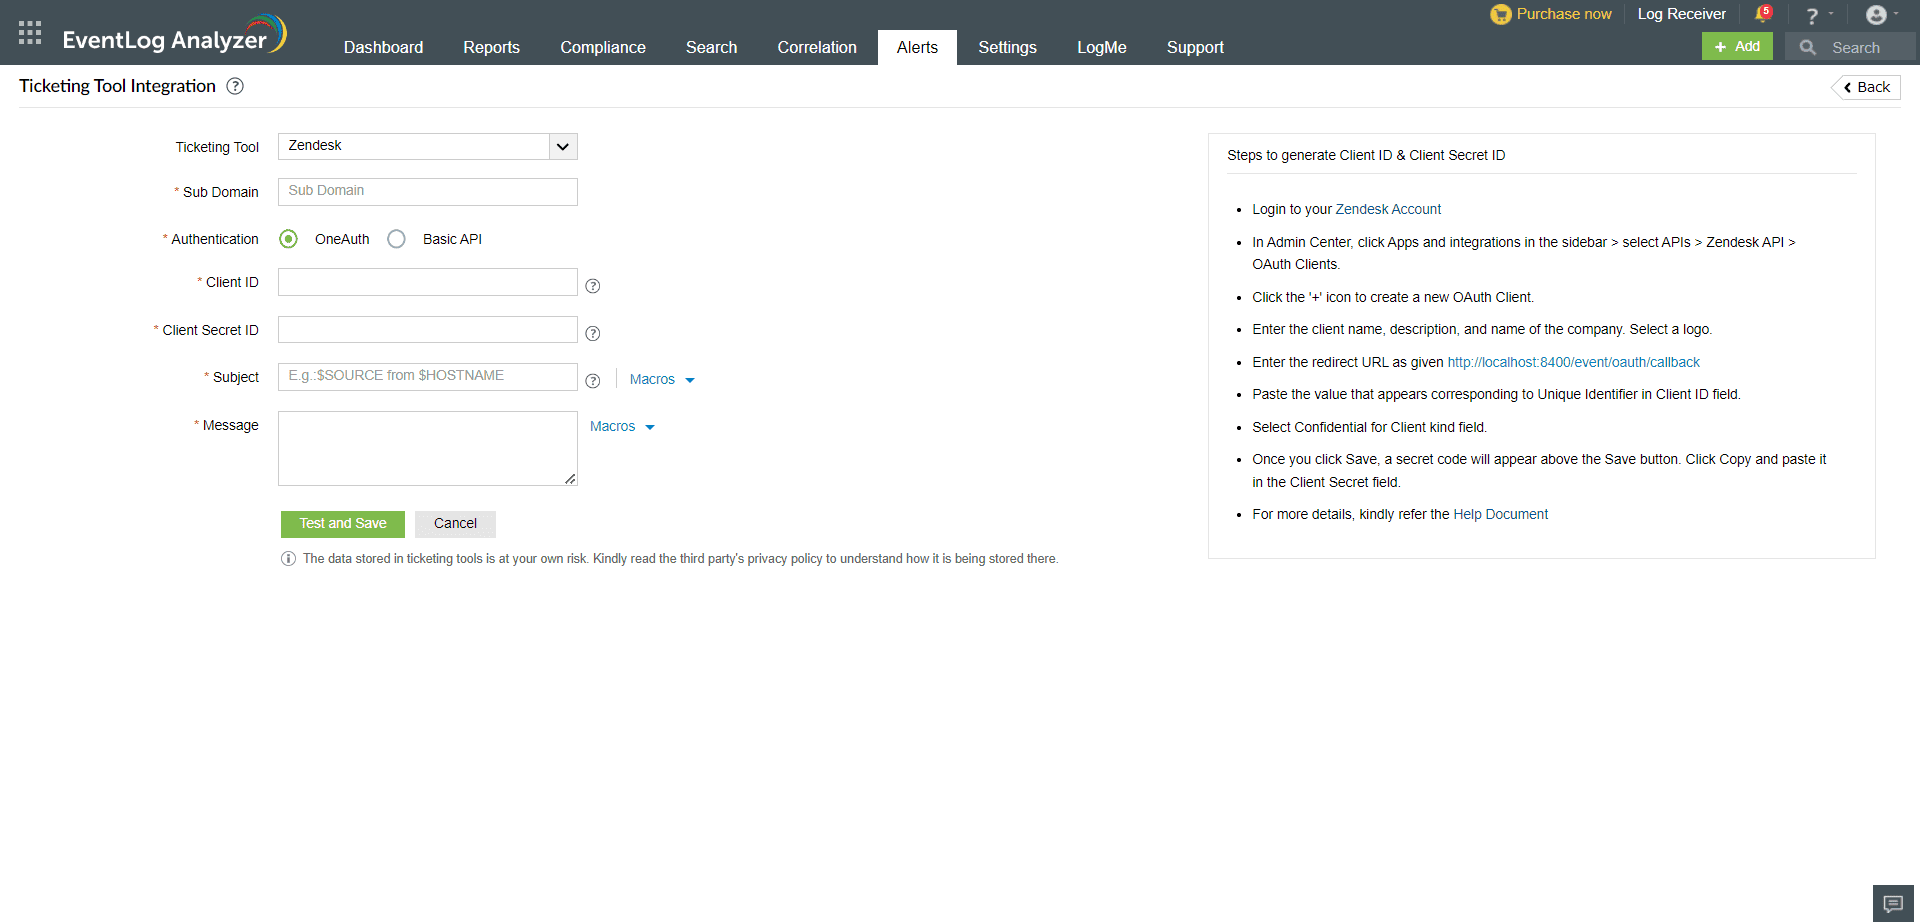
- Enter the Client ID in the corresponding field. This is value of the Unique Identifier noted from the ticketing tool.
- Enter the Client Secret ID in the corresponding field. This is the value of the secret code obtained from the ticketing tool.
- Enter the Subject and the Message for the alert. You can either select them from the predefined list available under Macros or enter your own. Click the Test and Save button. On clicking the Test and Save button, a verify popup will be displayed. Click the URL to approve the usage of the clients of Zendesk.
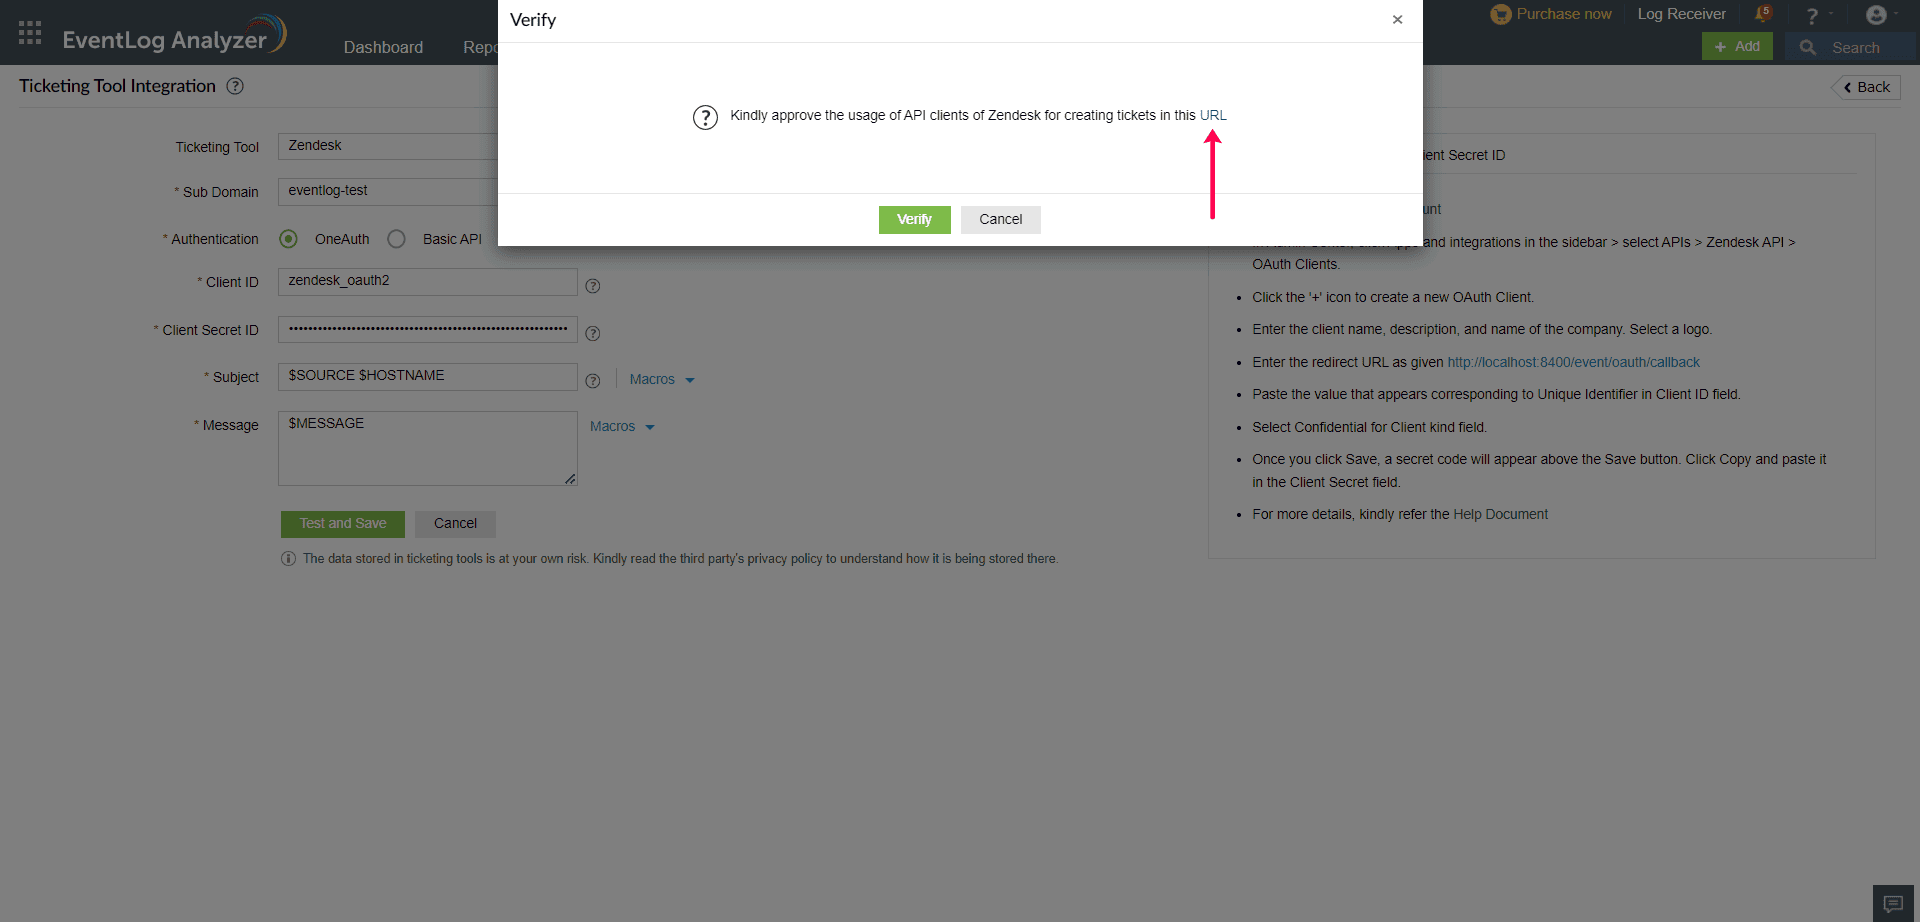
- Click Allow for API approval.
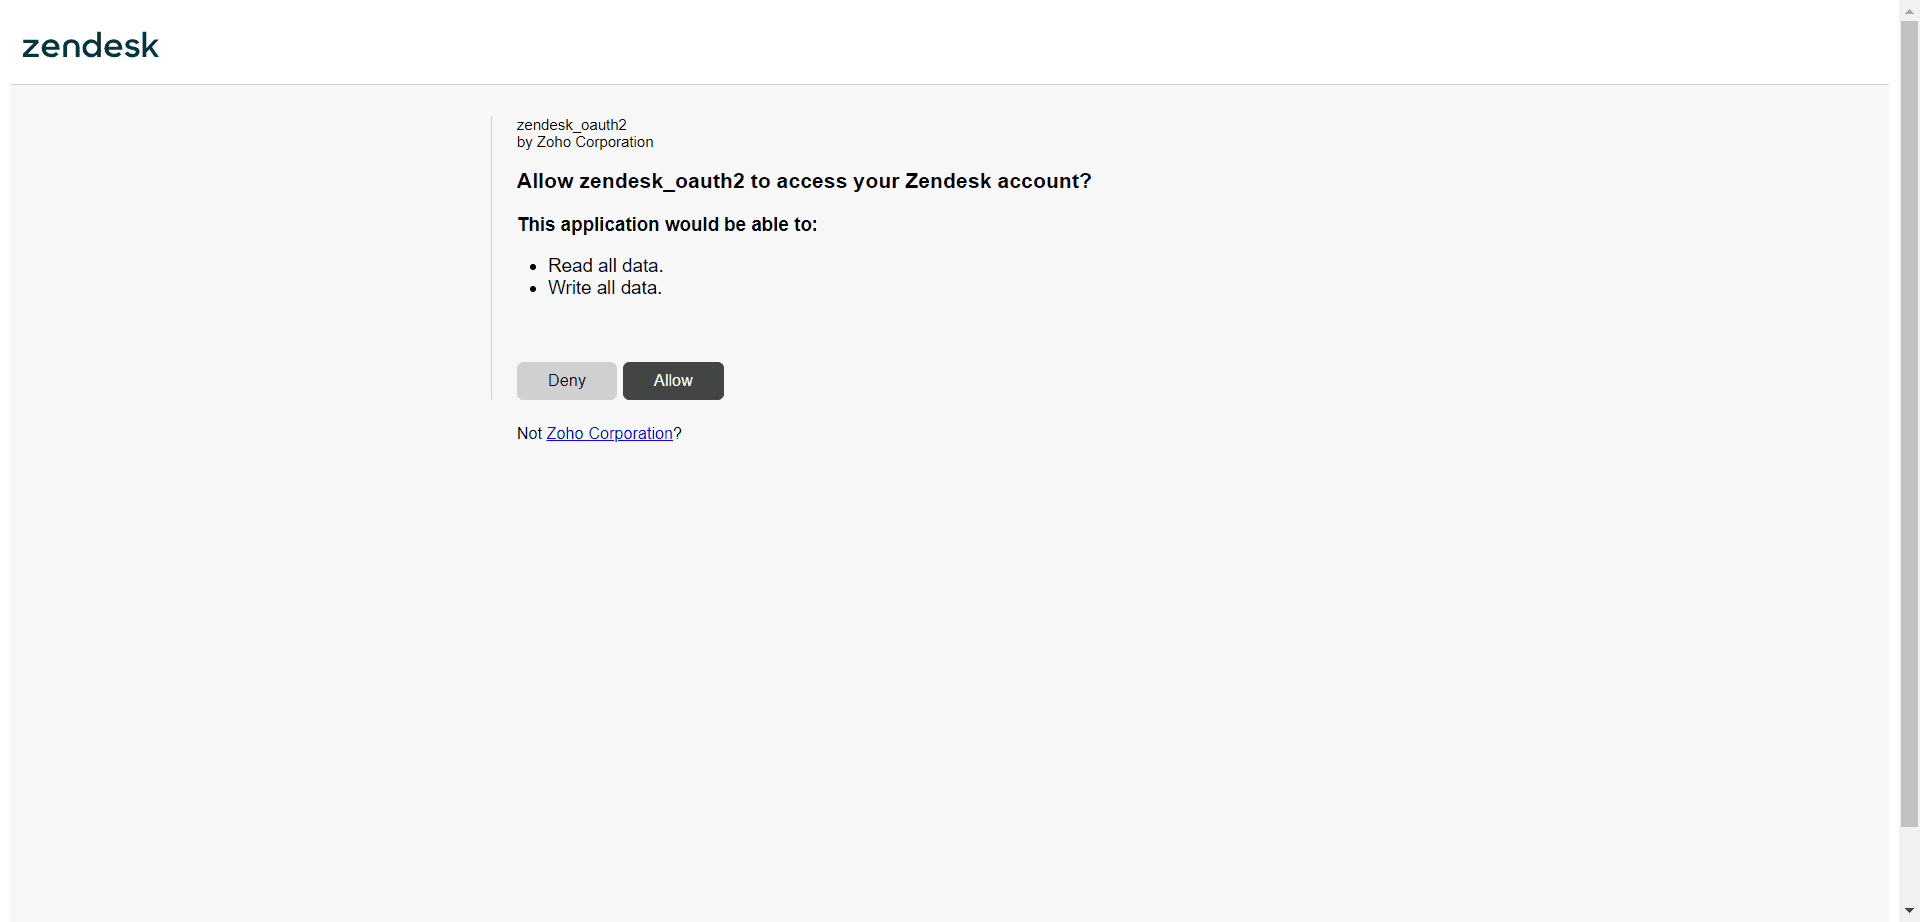
- Click the Verify button in EventLog Analyzer console. The ticketing tool will now be configured successfully.
- If you choose Basic API under Authentication, follow the steps given below:
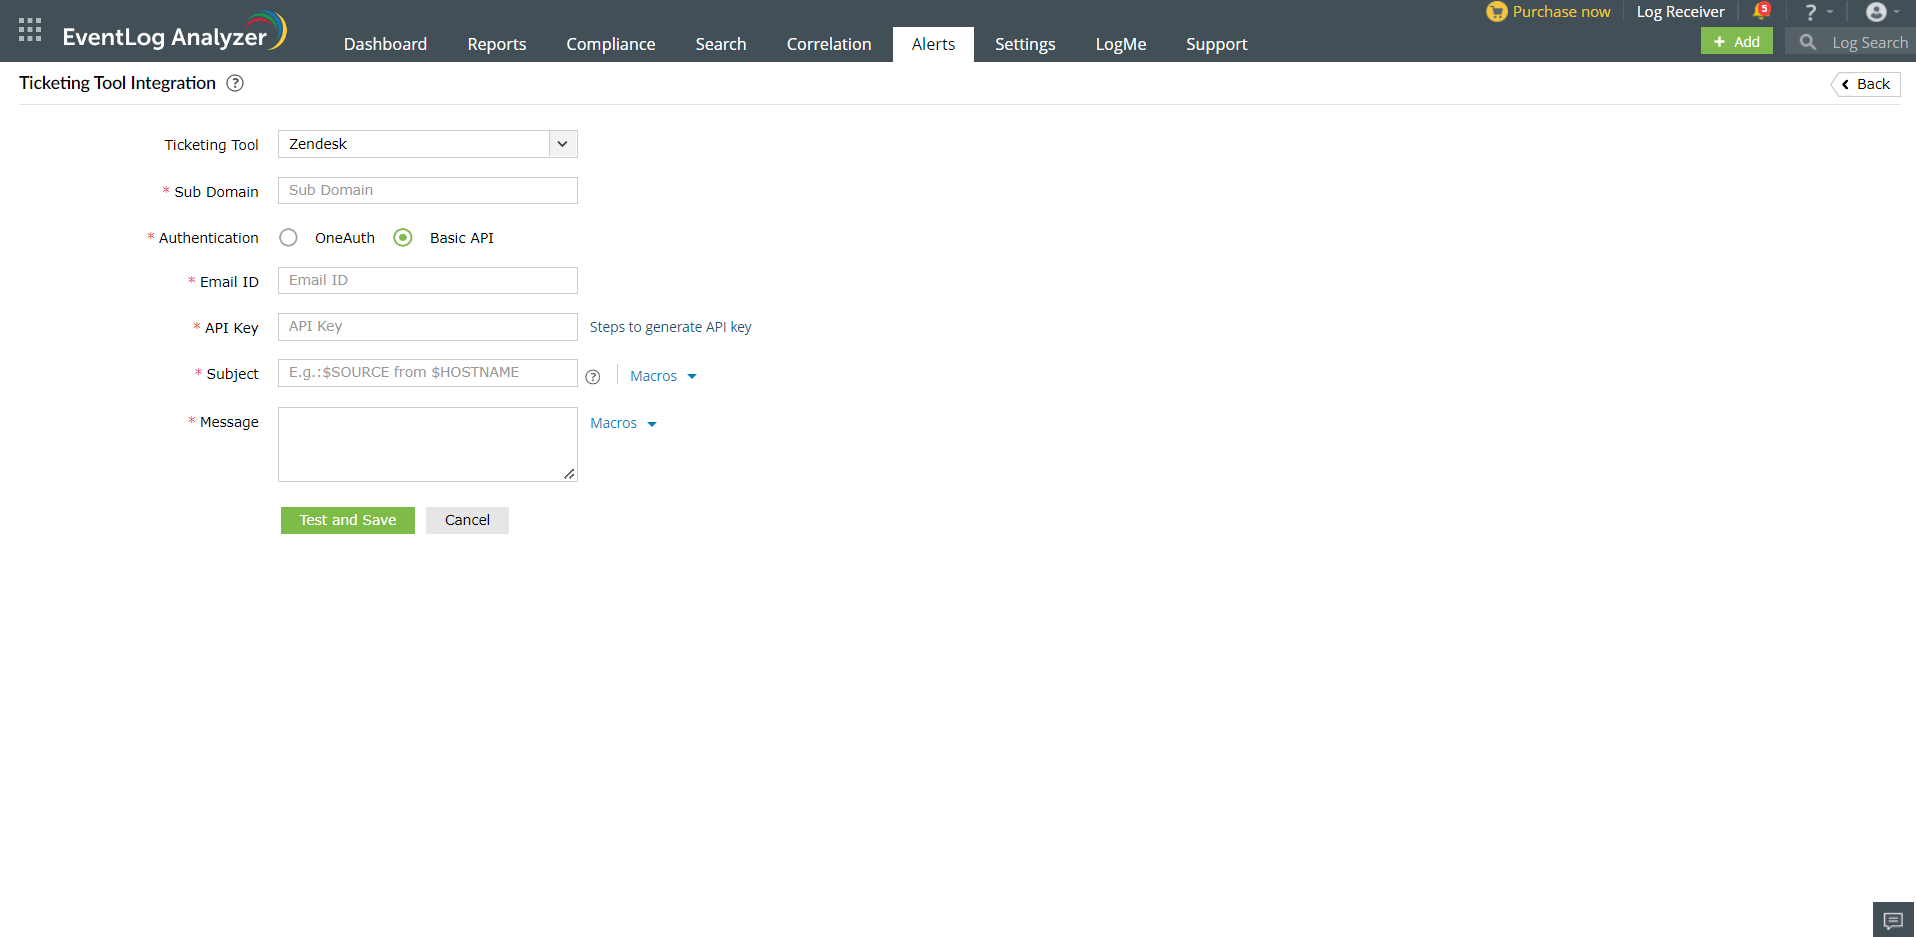
- Provide the Email Id in the given field.
- Click on Steps to Generate API Key for steps to generate an API key.
- Follow the given steps to generate the API key. After generation, provide the API key in the corresponding field.
- Enter the Subject and the Message for the alert. You can select them from the predefined list available under Macros or provide your own.
- Click the Test and Save button to establish communication and complete configuration.
Note: The ticketing tool as a configuration will fail if you have an organization-wide proxy configured. Please follow these
steps to include the organization-wide proxy certificate in EventLog Analyzer.
For Kayako
In EventLog Analyzer, navigate to the Alerts tab and click Ticketing Tool Integration under Alert Configuration. From the Ticketing Tool drop-down list, select Kayako.
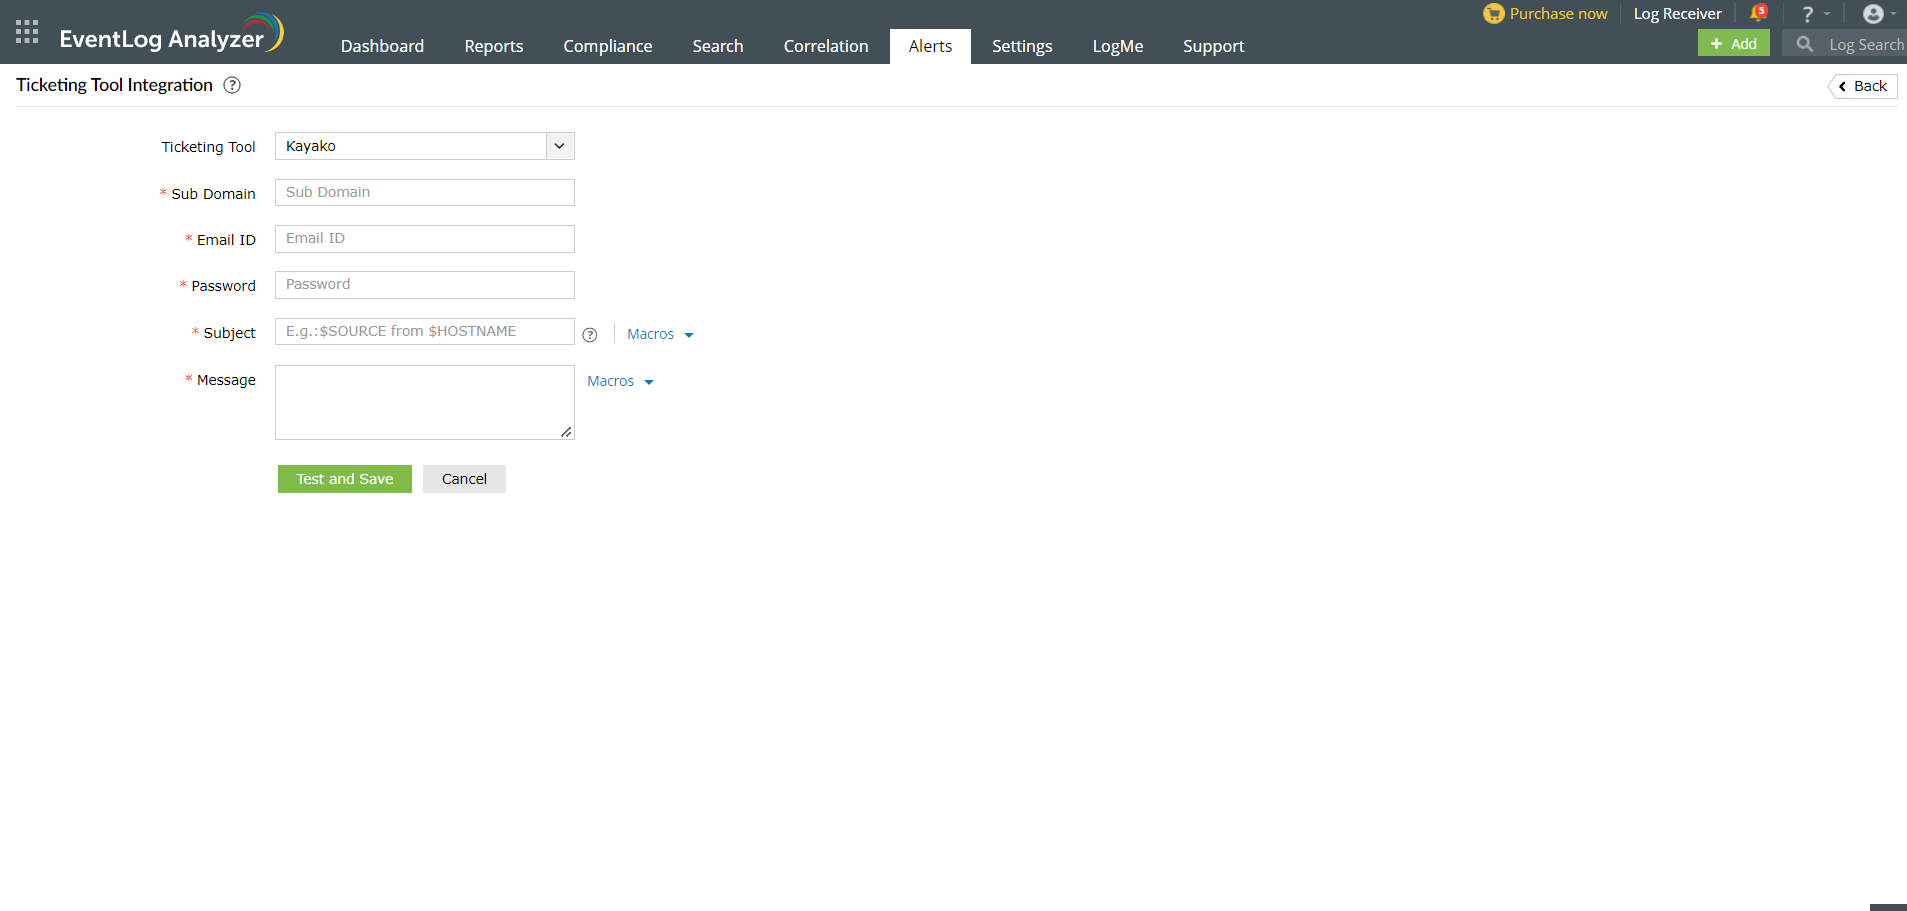
- Enter the Kayako subdomain name.
- Enter the emailId and password of a valid user in the ticketing tool.
- Enter the Subject and the Message for the alert. You can select them from a predefined list available under Macros or type your own.
- Click the Test and Save button to establish communication and complete configuration.
Note: The ticketing tool as a configuration will fail if you have an organization-wide proxy configured. Please follow these
steps to include the organization-wide proxy certificate in EventLog Analyzer.
For FreshService
Note: Only users with either of the following privileges can proceed with the configuration:
- Permissions to create, reply, edit, and delete tickets.
Or
- SD Agent, SD Supervisor, Admin, or Account admin role.
To configure EventLog Analyzer with FreshService, you need to first get some details from your FreshService ticketing tool. Go to the official Freshservice Doc to get the API Token.
In EventLog Analyzer, navigate to the Alerts tab and click Ticketing Tool Integration under Alert Configuration. From the Ticketing Tool drop-down list, select Freshservice.
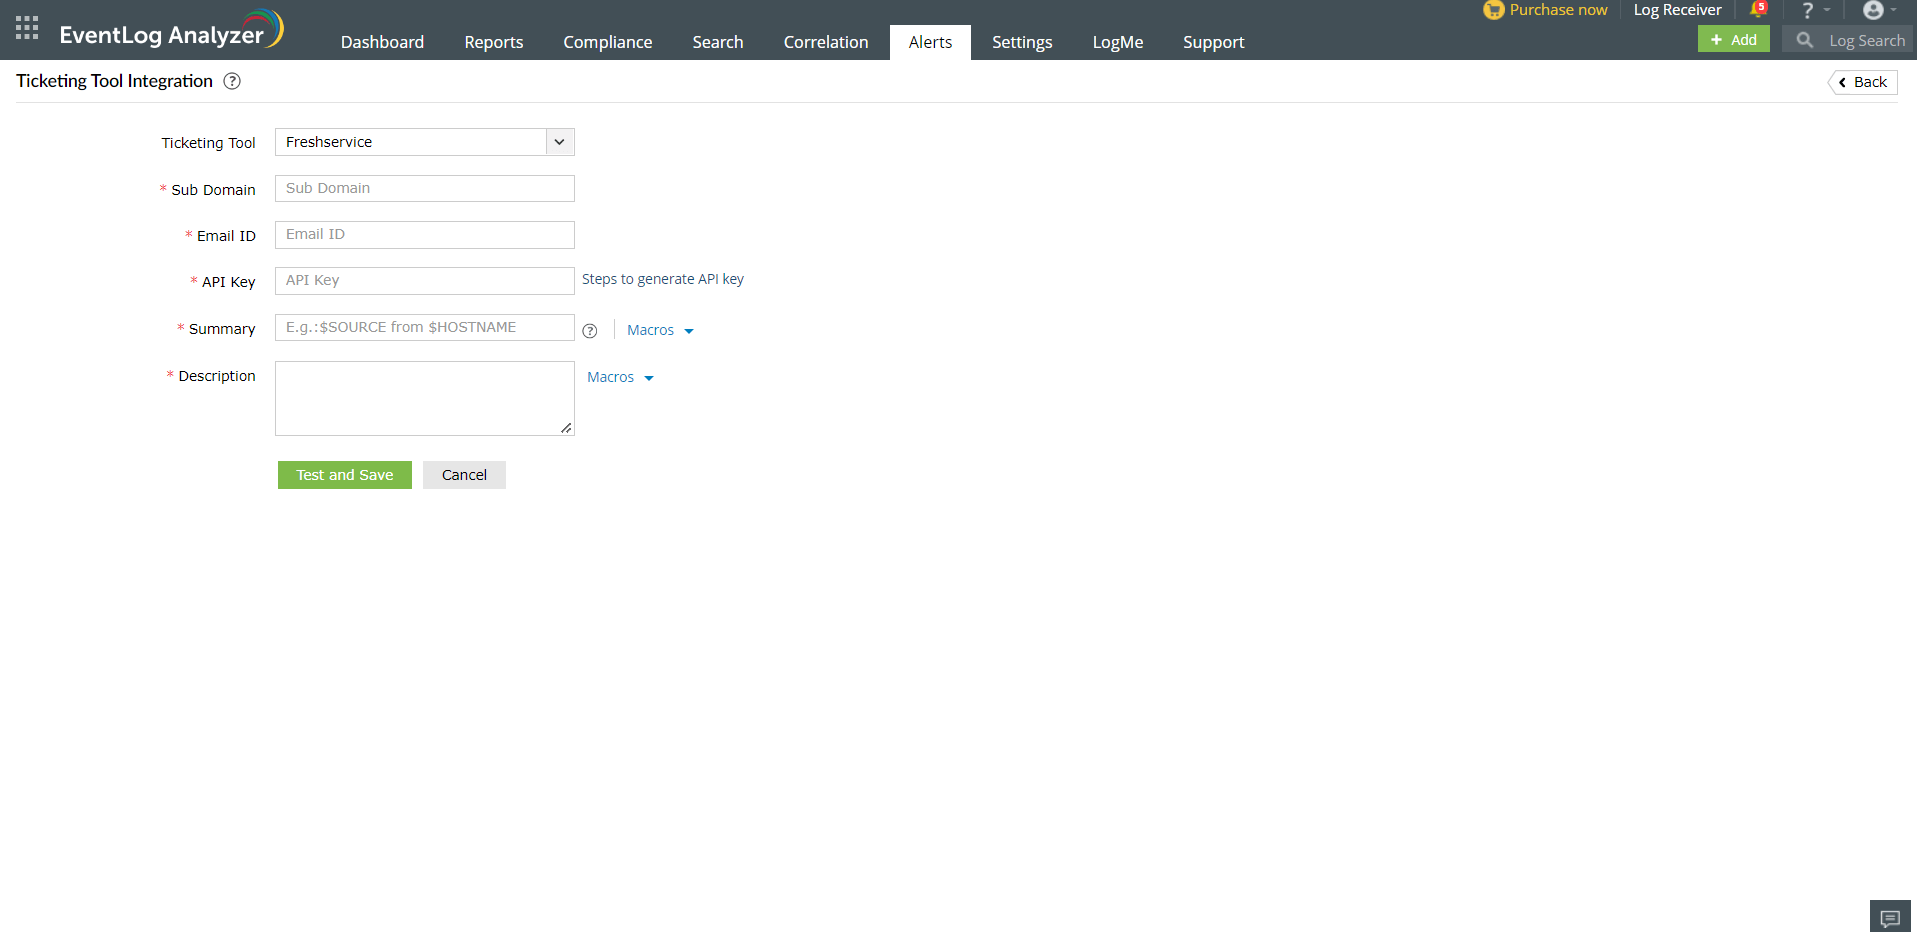
- Enter the Freshservice Subdomain.
- Enter Freshservice account Email ID.
- Enter the API key that we got in the previous step.
- Enter the Summary and the Description for the alert. You can select them from the predefined list available under Macros or type your own.
- Click the Test and Save button to establish communication and complete configuration.
Note: The ticketing tool as a configuration will fail if you have an organization-wide proxy configured. Please follow these
steps to include the organization-wide proxy certificate in EventLog Analyzer.
For ManageEngine ServiceDesk Plus
Note: Only users with permissions to view and edit requests can proceed with the configuration.
In EventLog Analyzer, navigate to the Alerts tab and click Ticketing Tool Integration under Alert Configuration. From the Ticketing Tool drop-down list, select ManageEngine ServiceDesk Plus.
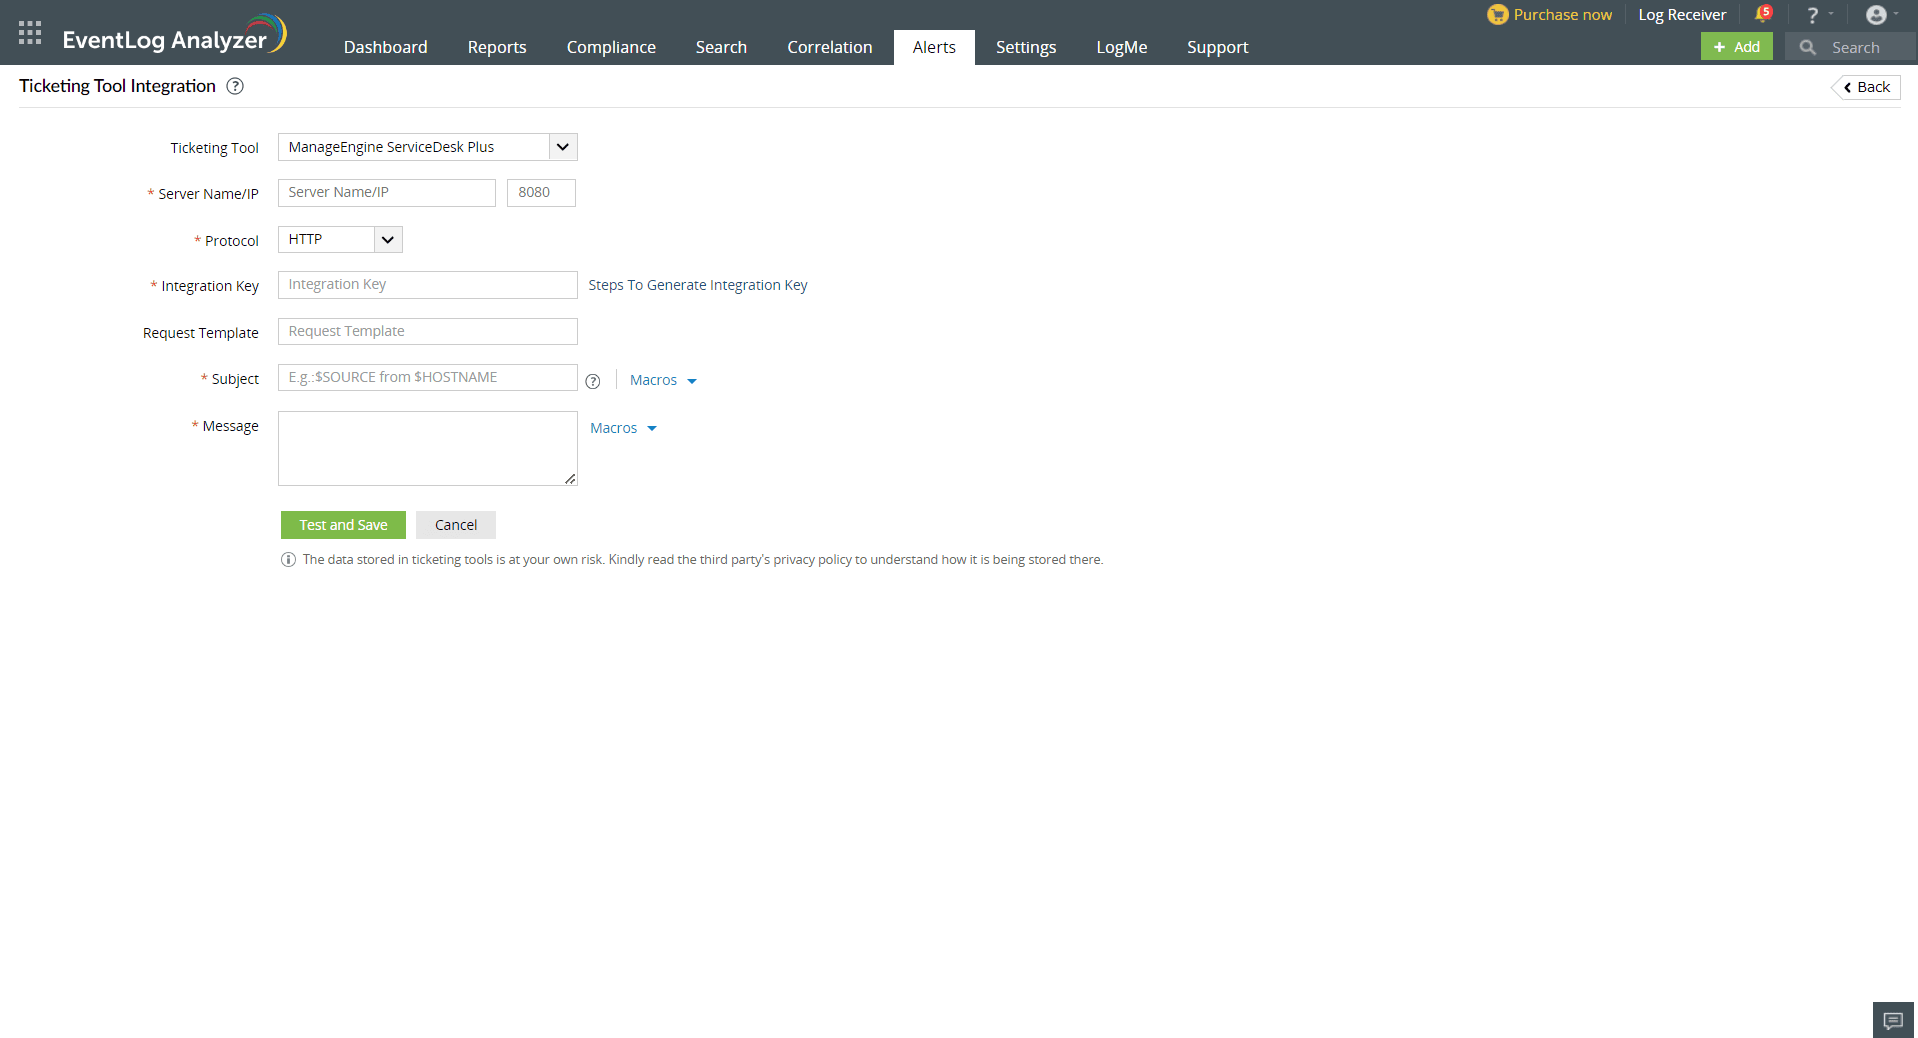
- Enter the ManageEngine ServiceDesk Plus server name or IP address.
- Enter the port number.
- Choose the protocol for communication - HTTP/HTTPS.
- Enter the Integration Key in the appropriate column. If you do not have an API key click on Steps to Generate API Key for instructions on generating an API key in ServiceDesk Plus.
- Please specify the Request Template you want to use for creating tickets in ServiceDesk Plus. Leaving it empty would raise tickets using the Default Template.
- Provide the Subject and Message for the alert—these can be selected from a predefined list under Macros or entered manually as per your requirements.
- Click the Test and Save button.
Note: The ticketing tool as a configuration will fail if you have an organization-wide proxy configured. Please follow these
steps to include the organization-wide proxy certificate in EventLog Analyzer.
For ManageEngine ServiceDesk Plus MSP
Note: Only users with permissions to view and edit requests can proceed with the configuration.
In EventLog Analyzer, navigate to the Alerts tab and click Ticketing Tool Integration under Alert Configuration. From the Ticketing Tool drop-down list, select ManageEngine ServiceDesk Plus MSP.
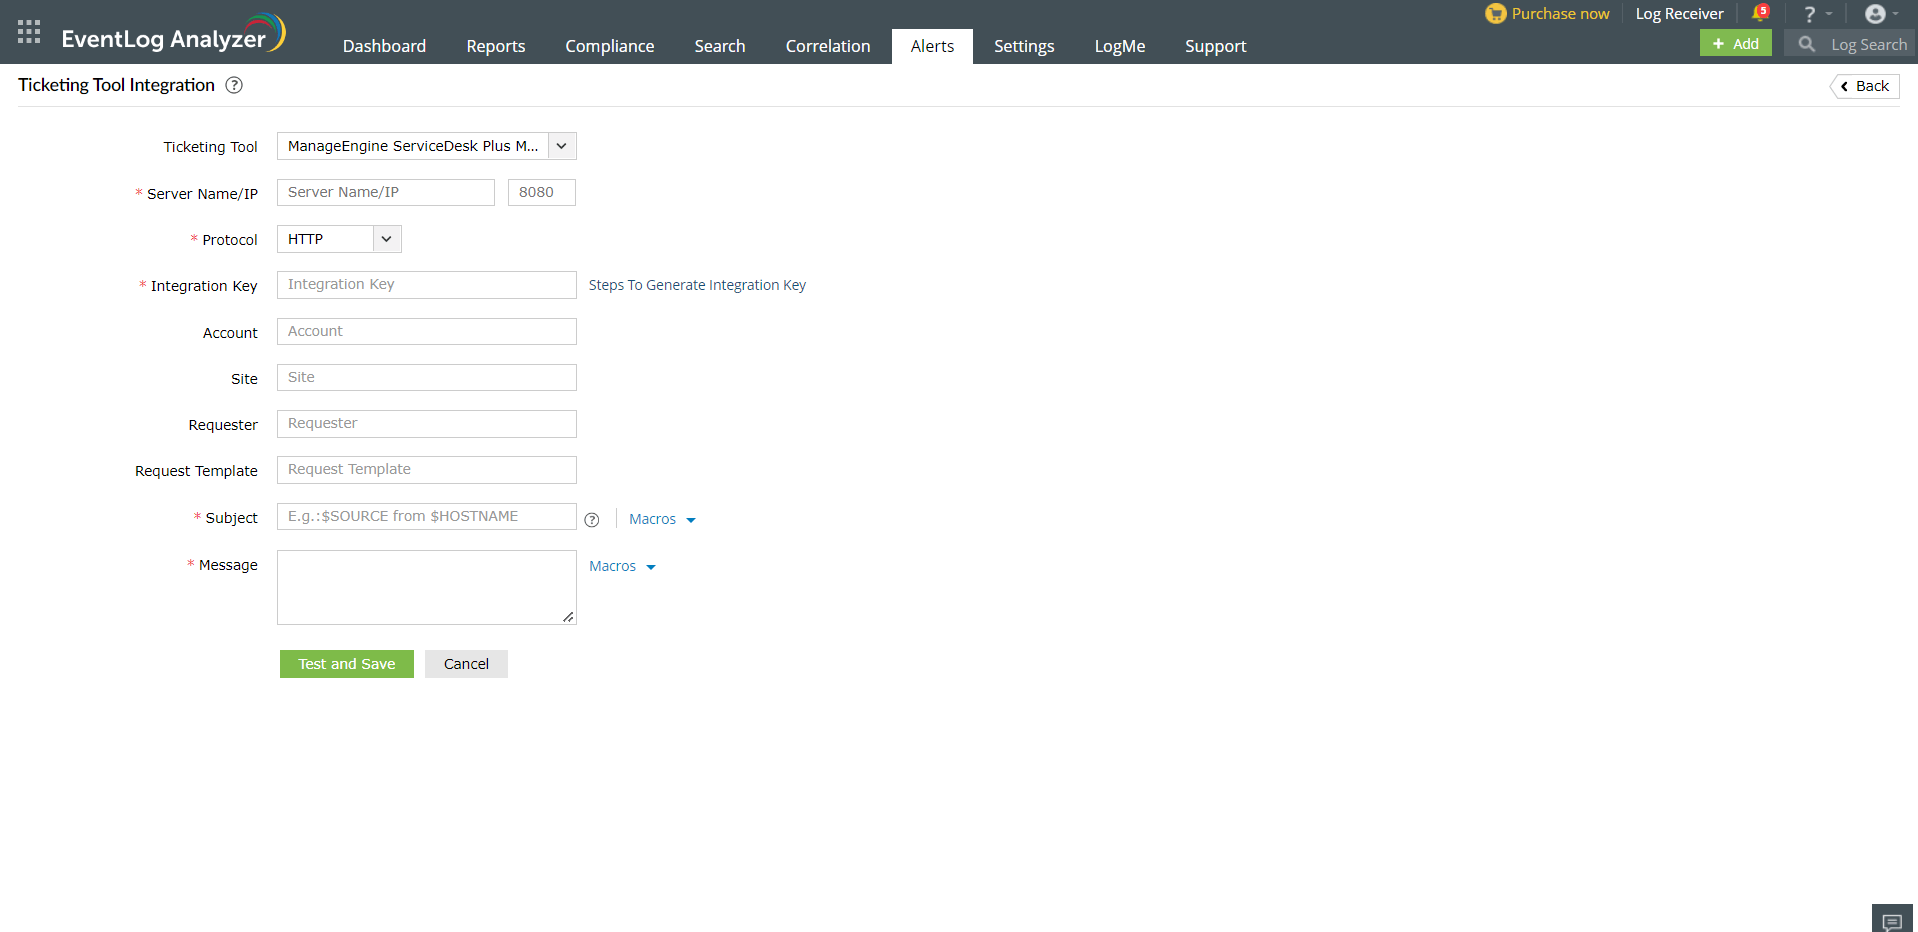
- Enter the ManageEngine ServiceDesk Plus MSP server name or IP address.
- Enter the port number.
- Choose the protocol for communication - HTTP/HTTPS.
- Enter the API key in the appropriate column. If you do not have an API key, click Steps to Generate API Key for instructions on generating an API key in ServiceDesk Plus MSP.
- If applicable, you may provide the following optional details:
- Account – Denotes the account to which this request belongs
- Site – Denotes the site associated with this request
- Requester – Indicates the requester of the request
- Request Template – Indicates the template used to create the request
- Enter the Subject and the Message for the alert. You can choose them from the predefined list available under Macros or type your own.
- Click the Test and Save button.
Note: The ticketing tool as a configuration will fail if you have an organization-wide proxy configured. Please follow these
steps to include the organization-wide proxy certificate in EventLog Analyzer.
For JIRA Service Desk
To configure EventLog Analyzer with Jira Service Desk, you would first need to get a few details from your Jira ticketing tool.
- After logging into your Jira Service Desk account, click the settings icon on the top right corner and select Projects.
- In the project list, note down the Key corresponding to the project in which you want your tickets to be raised.
- Navigate to the Issues tab and reenter your username and password when prompted.
- Note down the type of issues that the particular project can hold. The issues raised from EventLog Analyzer should have the same type for a ticket to be successfully raised in Jira Service Desk.
- Close Jira Service Desk and open EventLog Analyzer to complete the configuration process.
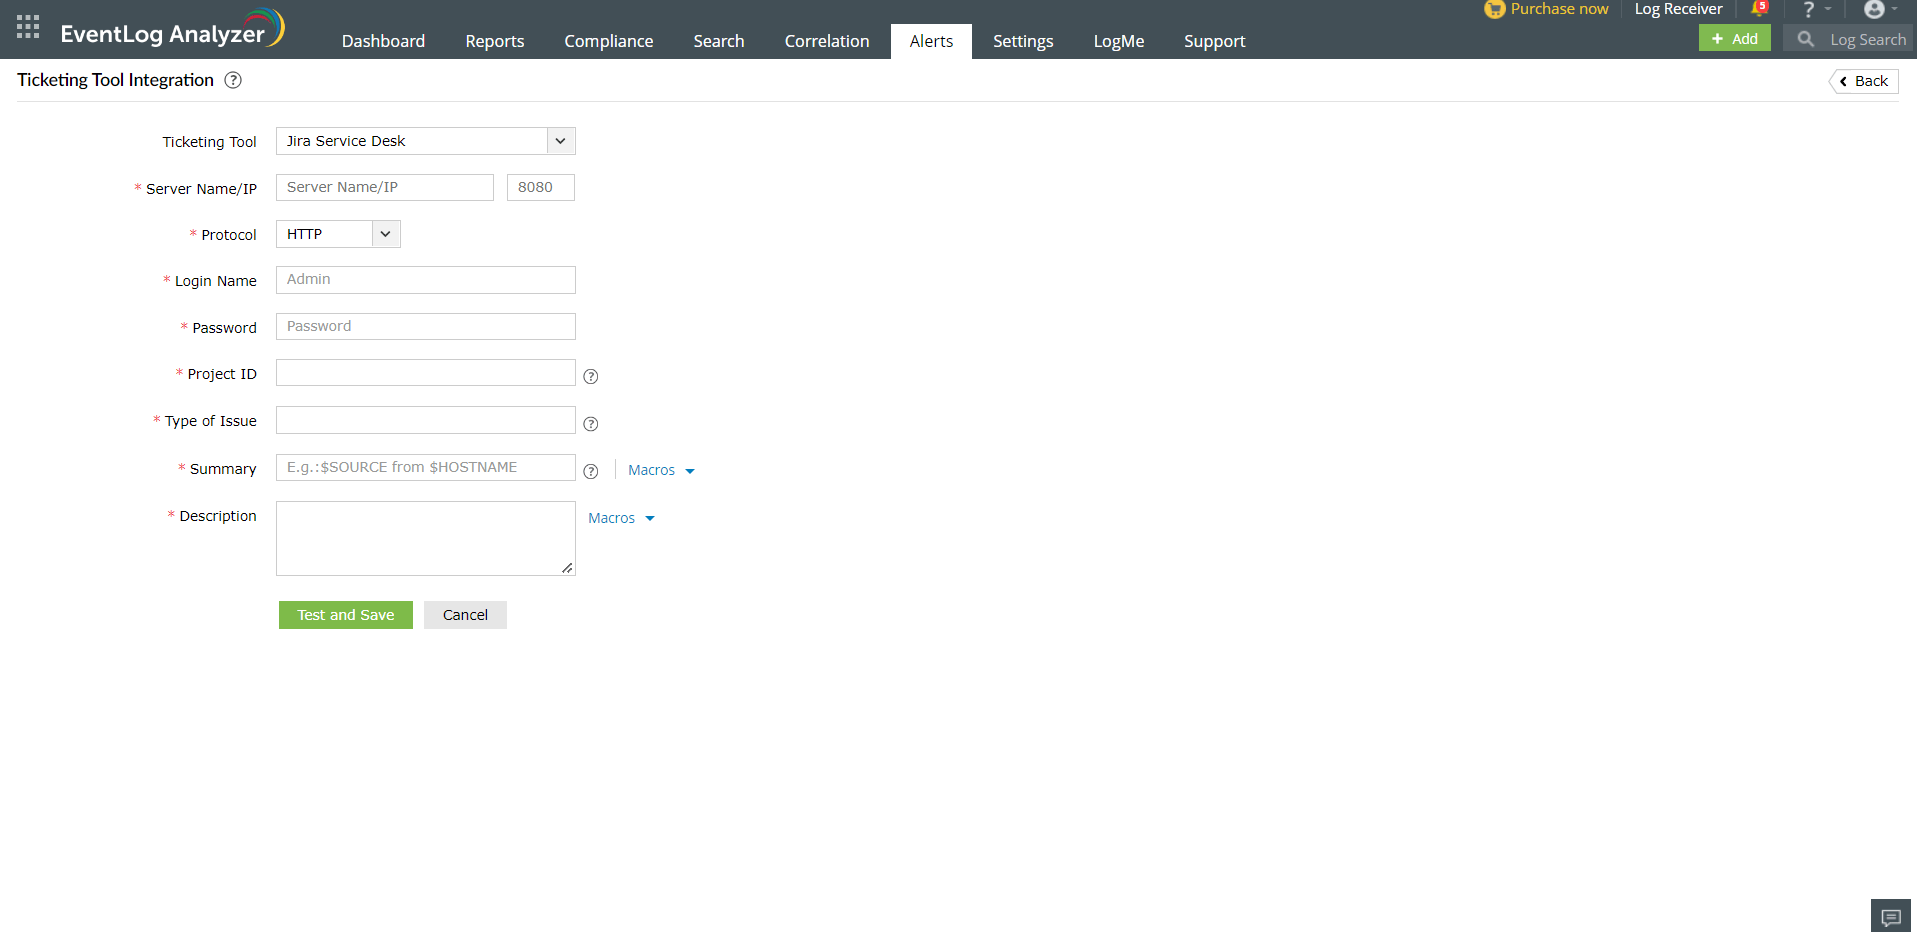
In EventLog Analyzer, navigate to the Alerts tab and click on ticketing tool integration under Alert Configuration. From the Ticketing Tool drop-down list, select Jira Service Desk.
- Enter the Jira Service Desk server name or IP address.
- Enter the port number.
- Choose the protocol for communication - HTTP/HTTPS.
- Enter the login name and password of the account having admin privileges.
- Enter the project ID. This is the Key of the particular project noted from the ticketing tool.
- Enter the type of issue. This needs to be same as the issue type that the project has been configured to hold.
- Enter the Summary and the Description for the alert. You can select them from a predefined list available under Macros or type your own.
- Click the Test and Save button to establish communication and complete configuration.
Note: The ticketing tool as a configuration will fail if you have an organization-wide proxy configured. Please follow these
steps to include the organization-wide proxy certificate in EventLog Analyzer.
For BMC Remedy Service Desk
In EventLog Analyzer, navigate to the Alerts tab and click on ticketing tool integration under Alert Configuration. From the Ticketing Tool drop-down list, select BMC Remedy Service Desk.
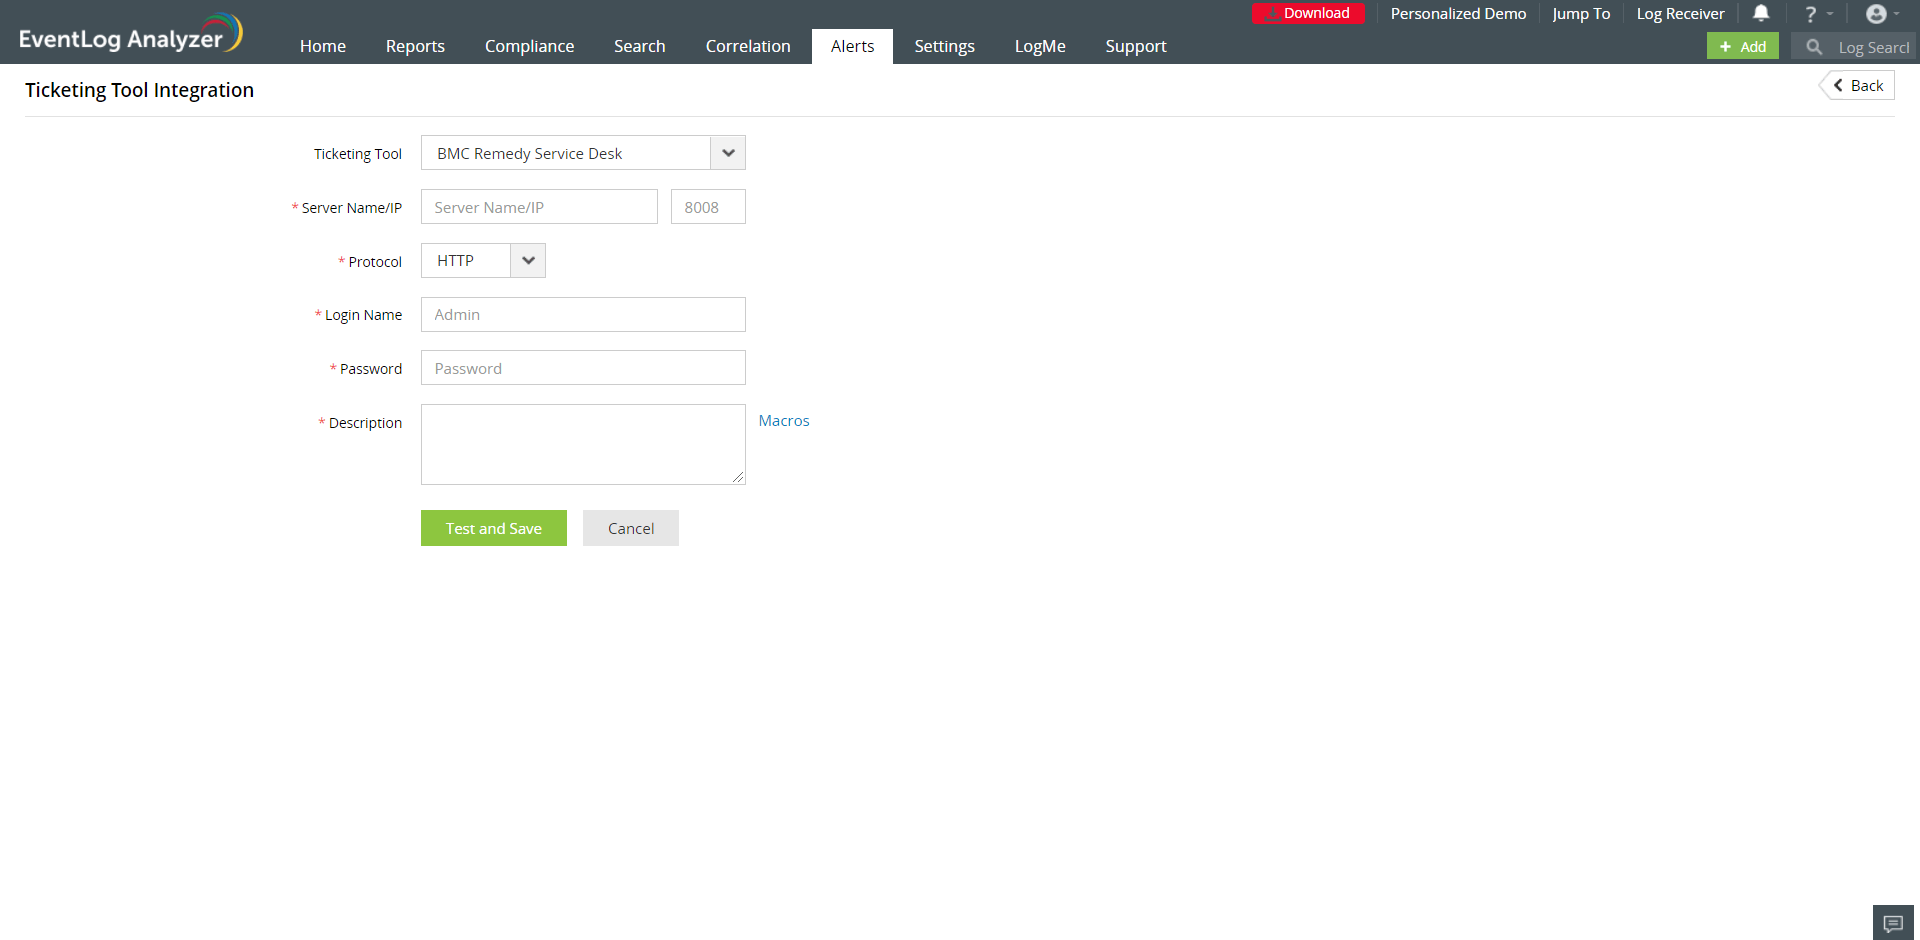
- Enter the BMC Remedy Service Desk server name or IP address.
- Enter the port number.
- Choose the protocol for communication - HTTP/HTTPS.
- Enter the login name and password of the account having admin privileges.
- Enter the Description for the alert. You can choose it from a predefined list available under Macros or type your own.
- Click the Test and Save button to establish communication and complete the configuration.
Note: The ticketing tool as a configuration will fail if you have an organization-wide proxy configured. Please follow these
steps to include the organization-wide proxy certificate in EventLog Analyzer.
Mapping Alert Profiles with Configured Ticketing Tools
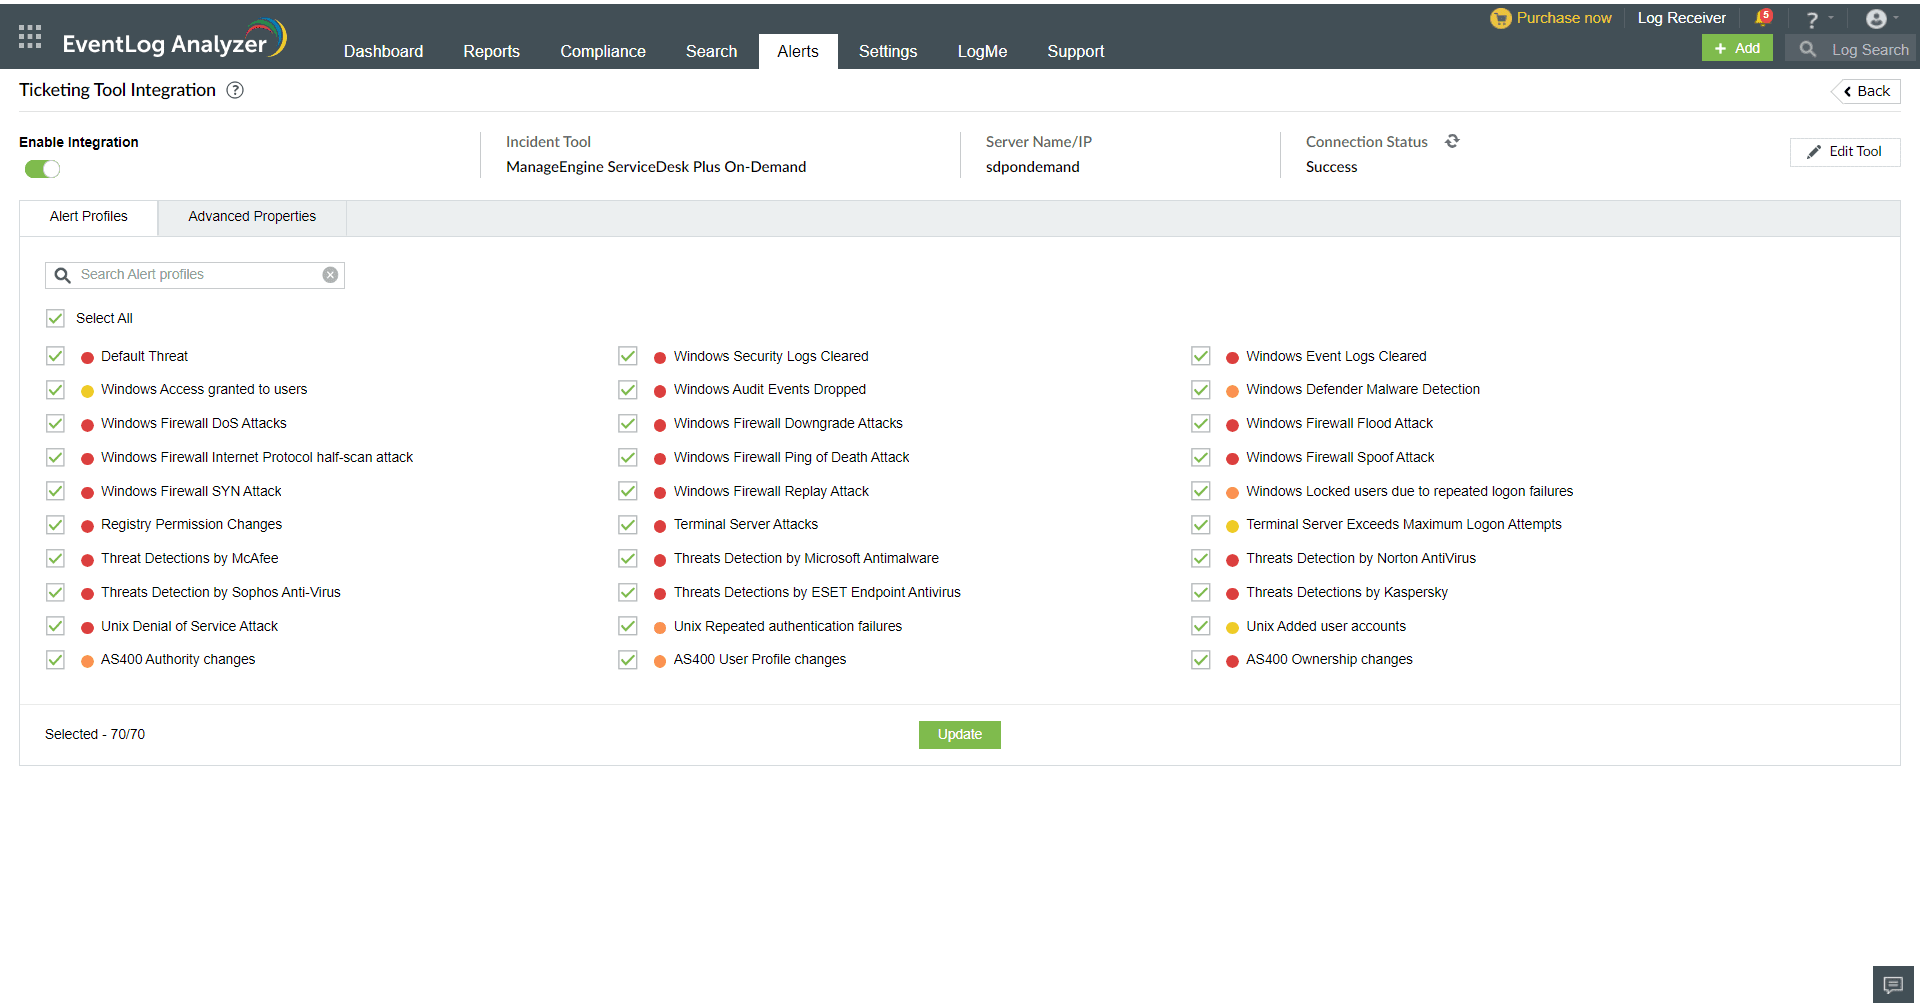
After configuring EventLog Analyzer with the ticketing tool, you can select specific alert profiles from where tickets should be created.
- Access the Ticketing Tool Integration page - Here, you’ll find a list of existing alert profiles.
- Select Alert Profiles:
- To select specific profiles for which tickets should be raised, use the search box to find them.
- To select all alert profiles, check the Select All box. Any future profiles will also be automatically selected.
- Update Settings: Once you've made your selections, click Update to apply the changes.
- Manage Ticketing Tool Integration:
- Enable/Disable Integration: Toggle the integration on or off as needed.
- Check Connection Status: Click the Refresh icon next to the connection status to verify if Eventlog Analyzer is successfully connected to the ticketing tool.
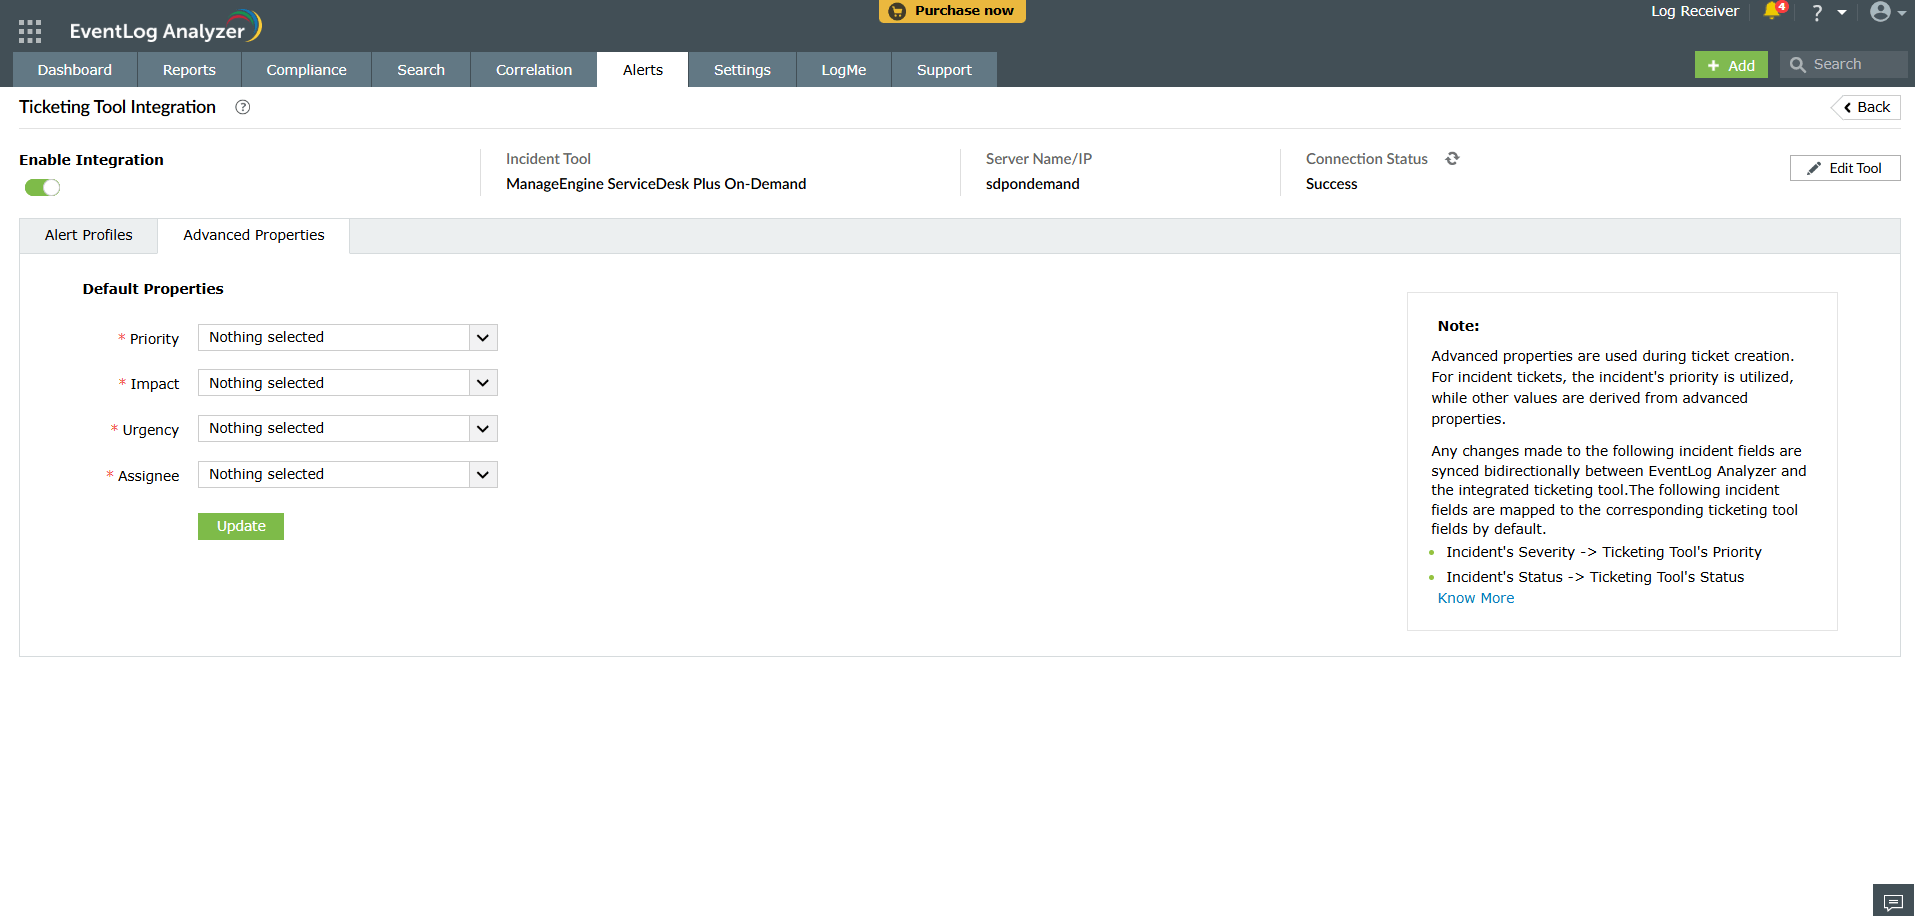
Advanced Properties Configuration
- Navigate to the Advanced Properties tab to begin customization.
- Configure each property by entering the desired values. These settings will be applied to any new tickets in the ticketing tool.
Note:
- The Priority selected under Advanced Properties will not be applicable for tickets created from Incidents.
- For seamless functioning of Advanced Properties, users integrating with Freshservice must disable the Priority Matrix in their Freshservice account.
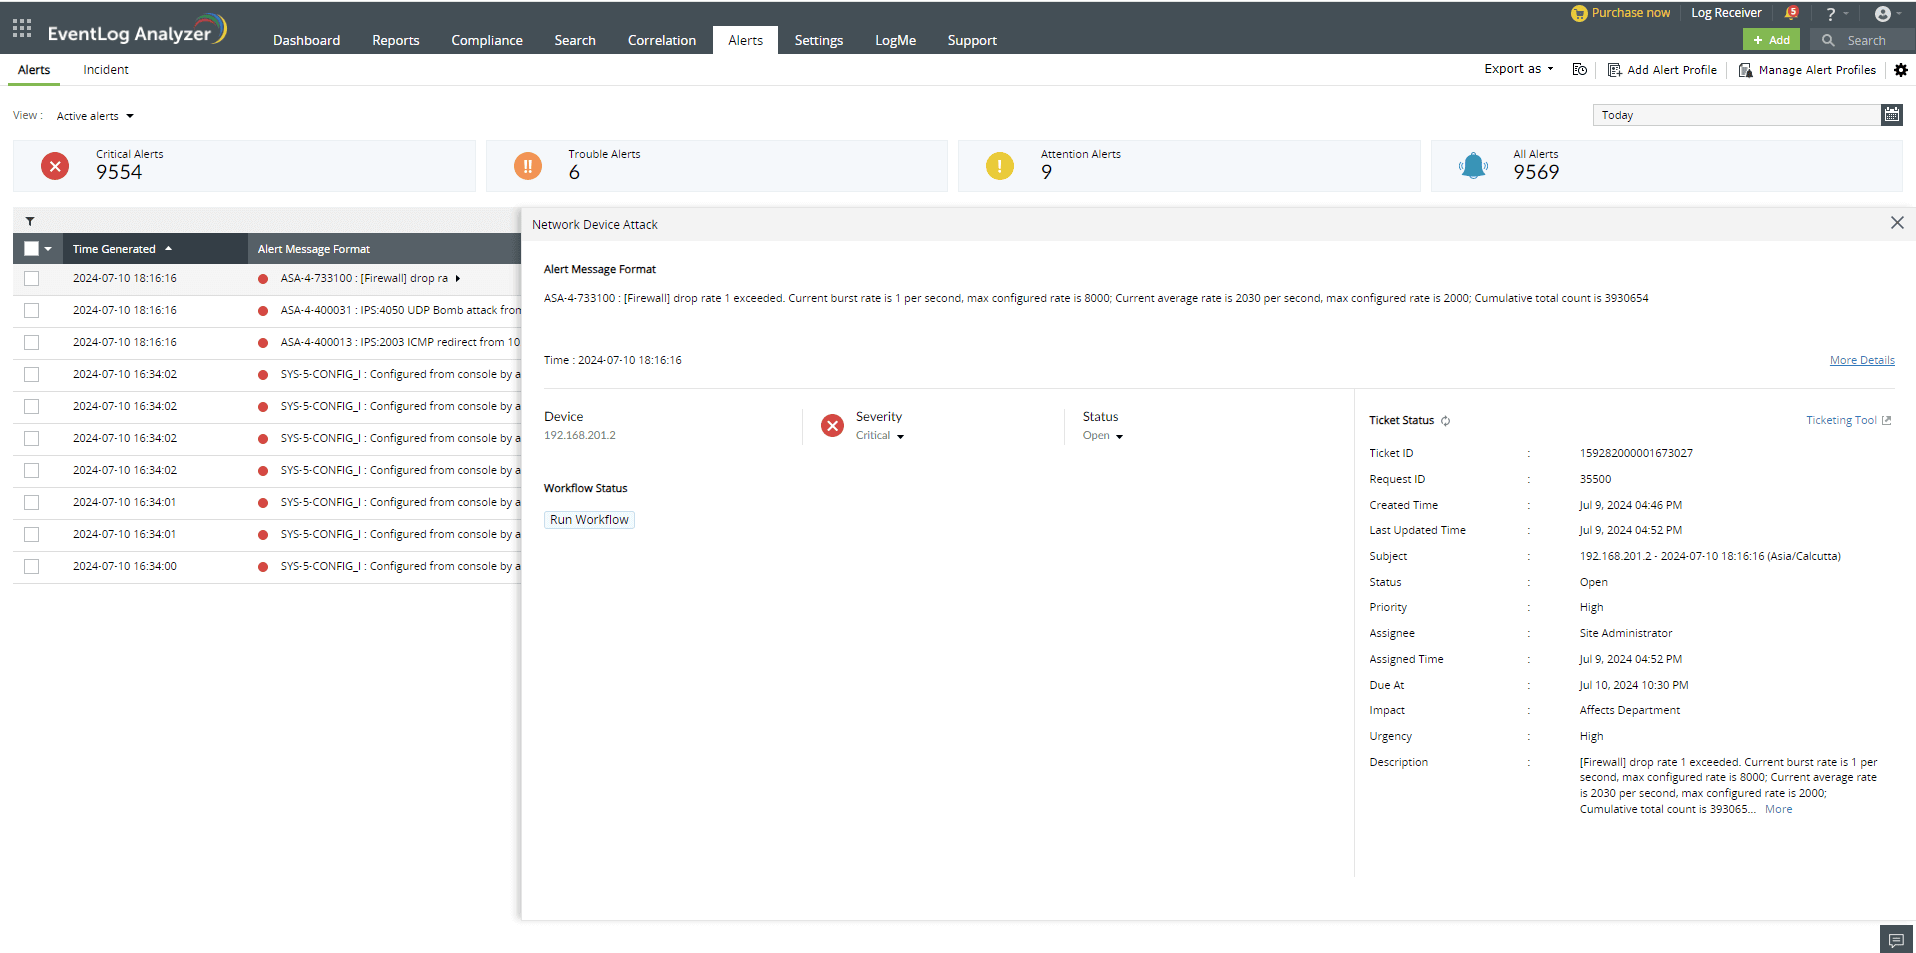
With EventLog Analyzer, you can efficiently manage security incidents by raising tickets and assigning them to administrators for alerts that are generated. After successfully configuring the ticketing tool, the ticket details can be viewed in Alerts tab by clicking the specific alert.
 Click here to expand