- Related Products
- Log360
- AD360
- ADManager Plus
- ADAudit Plus
- ADSelfService Plus
- Exchange Reporter Plus
 Click here to expand
For Build 8010 onwards
The log files are located in the <EventLogAnalyzer_Home>logs directory. Typically when you run into a problem, you will be asked to send the serverout.txt file from this directory to EventLog Analyzer Support.
For Build 8000 or earlier
The log files are located in the <EventLogAnalyzer_Home>server/default/log directory. Typically when you run into a problem, you will be asked to send the serverout.txt file from this directory to EventLog Analyzer Support.
The inbuilt PostgreSQL/MySQL database of EventLog Analyzer could get corrupted if other processes are accessing these directories at the same time. So exclude ManageEngine installation folder from
Ensure that no snap shots are taken if the product is running on a VM.
The SIF will help us to analyze the issue you have come across and propose a solution for the same.
If you are unable to create a SIF from the Web client UI,
For Build 8010 onwards
You can zip the files under 'logs' folder, located in C:/ManageEngine/Eventlog/logs (default path) and upload the zip file to the following ftp link: http://bonitas.zohocorp.com/upload/index.jsp?to=eventloganalyzer-support@manageengine.com
For Build 8000 or earlier
You can zip the files under 'log' folder, located in C:/ManageEngineEventlog/server/default/log (default path) and upload the zip file to the following ftp link: http://bonitas.zohocorp.com/upload/index.jsp?to=eventloganalyzer-support@manageengine.com
To register dll, follow the procedure given in the link below: http://ss64.com/nt/regsvr32.html
Depending on your environment, you may occasionally experience challenges with starting EventLog Analyzer due to a Postgres database startup failure. To avoid this, it is advisable that you register the database first, making it run in the background irrespective of the product's start up or shutdown.
register_pgdbservice.bat "<Specify the name of the DB Service to be registered>"
register_pgdbservice.bat "<Specify the name of the DB Service to be registered>"
Should you no longer wish to be in charge of the database, you may opt to unregister, which will cause the product to start and stop the database, along with its own start and stop.
unregister_pgdbservice.bat "<Specify the name of the DB Service to be unregistered>"
unregister_pgdbservice.bat "<Specify the name of the DB Service to be unregistered>"
This can happen under two instances:
For Build 8010 onwards
To bind EventLog Analyzer server to a specific interface, follow the procedure given below:
For Eventlog Analyzer running as application:
rem %JAVA% %JAVA_OPTS% -cp "%CLASS_PATH%" com.adventnet.mfw.Starter %SAFE_START% -c default -b <ip-address>
to
%JAVA% %JAVA_OPTS% -cp "%CLASS_PATH%" com.adventnet.mfw.Starter %SAFE_START% -c default -b <ip-address>
%JAVA% %JAVA_OPTS% -cp "%CLASS_PATH%" com.adventnet.mfw.Starter %SAFE_START%
to
rem %JAVA% %JAVA_OPTS% -cp "%CLASS_PATH%" com.adventnet.mfw.Starter %SAFE_START%
rem set JAVA_OPTS=-Djava.library.path=..lib;..libnative -DpdfReport=false -Duser.country=US -Duser.language=en -DminDiskSpace=5 -Xms128m -Xmx512m -Dspecific.bind.address=<ip-address>
to
set JAVA_OPTS=-Djava.library.path=..lib;..libnative -DpdfReport=false -Duser.country=US -Duser.language=en -DminDiskSpace=5 -Xms128m -Xmx512m -Dspecific.bind.address=<ip-address>
set JAVA_OPTS=-Djava.library.path=..lib;..libnative -DpdfReport=false -Duser.country=US -Duser.language=en -DminDiskSpace=5 -Xms256m -Xmx1024m
to
rem set JAVA_OPTS=-Djava.library.path=..lib;..libnative -DpdfReport=false -Duser.country=US -Duser.language=en -DminDiskSpace=5 -Xms256m -Xmx1024m
url=jdbc:postgresql://localdevice:33336/eventlog?stringtype=unspecified
to
url=jdbc:postgresql://<binding IP address>:33336/eventlog?stringtype=unspecified
#------------------------------------------------------------------------------
# CONNECTIONS AND AUTHENTICATION
#------------------------------------------------------------------------------
# - Connection Settings -
#listen_addresses = 'localdevice' # what IP address(es) to listen on;
# comma-separated list of addresses;
# defaults to 'localdevice'; use '*' for all
# (change requires restart)
to
#------------------------------------------------------------------------------
# CONNECTIONS AND AUTHENTICATION
#------------------------------------------------------------------------------
# - Connection Settings -
listen_addresses = <binding IP address> # what IP address(es) to listen on;
# comma-separated list of addresses;
# defaults to 'localdevice'; use '*' for all
# (change requires restart)
device all all <binding IP address in IPv4 format>/32 trust
after the line
device all all 127.0.0.1/32 trust
and save the file.
# TYPE DATABASE USER ADDRESS METHOD
# IPv4 local connections:
device all all 127.0.0.1/32 trust
# IPv6 local connections:
device all all ::1/128 trust
to
# TYPE DATABASE USER ADDRESS METHOD
# IPv4 local connections:
device all all 127.0.0.1/32 trust
device all all <binding IP address in IPv4 format>/32 trust
# IPv6 local connections:
device all all ::1/128 trust
For Eventlog Analyzer running as service:
Before proceeding further, stop the EventLog Analyzer service and make sure that 'SysEvtCol.exe','Postgres.exe' and 'java.exe' are not running.
There are 7 files that must be modified for IP binding.
Note: data-doc-rid="255l9469213c93f3f4d8cb899c7bf8471fb58">Before editing the files ensure that you have a backup copy of the files.
Assume xxx.xxx.xxx.xxx is the IP address you wish to bind with EventLog Analyzer.
File 1)
<ELA home>\bin\setCommonEnv.bat
File 2)
<ELA home>\bin\runSEC.bat
File 3)
<ELA home>\server\conf\wrapper.conf
wrapper.app.parameter.1=com.adventnet.mfw.Starter
#wrapper.app.parameter.2=-L../lib/AdventNetDeploymentSystem.jar
wrapper.app.parameter.2=-b xxx.xxx.xxx.xxx
wrapper.app.parameter.3=-Dspecific.bind.address= xxx.xxx.xxx.xxx
File 4)
<ELA home>\conf\server.xml
Search for the following block:
<Connector SSLEnabled="false" URIEncoding="UTF-8" acceptCount="100" address="0.0.0.0" clientAuth="false" compressableMimeType="text/html,text/xml" compression="force" compressionMinSize="1024" connectionTimeout="20000" disableUploadTimeout="true" enableLookups="false" maxSpareThreads="75" maxThreads="150" minSpareThreads="25" name="WebServer" noCompressionUserAgents="gozilla, traviata" port="8400" protocol="HTTP/1.1" scheme="http" secure="false"/>
<Connector SSLEnabled="false" URIEncoding="UTF-8" acceptCount="100" address="xxx.xxx.xxx.xxx" clientAuth="false" compressableMimeType="text/html,text/xml" compression="force" compressionMinSize="1024" connectionTimeout="20000" disableUploadTimeout="true" enableLookups="false" maxSpareThreads="75" maxThreads="150" minSpareThreads="25" name="WebServer" noCompressionUserAgents="gozilla, traviata" port="8400" protocol="HTTP/1.1" scheme="http" secure="false"/>
File 5)
<ELA home>\conf\database_params.conf
File 6)
<ELA home>\pgsql\data\postgresql.conf
File 7)
<ELA home>\pgsql\data\pg_hba.conf
Search for the following block
IPv4 local connections:
host all all 127.0.0.1/32 trust
We need to replicate the host all all 127.0.0.1/32 trust line with the new IP address in place of 127.0.0.1 and add it after that line. For replication, please copy this line itself and paste it in next line and then edit out the IP address.
It should look like this
IPv4 local connections:
host all all 127.0.0.1/32 trust
host all all xxx.xxx.xxx.xxx/32 trust
Start EventLog Analyzer and check <ELA home>\logs\wrapper.log for the current status.
ELA employs the Dejavu-seriff font, which is preinstalled on Windows OS, when exporting reports. However, this font is not preinstalled for some Linux distributions. An error occurs in these cases.
In such cases, install the font manually based on the distribution. The command required is listed below:
sudo yum install fontconfig dejavu-sans-fonts dejavu-serif-fonts
sudo apt install fonts-dejavu fontconfig
sudo zypper install dejavu-fonts fontconfig
Probable cause: An instance of MySQL is already running on this machine.
Solution: Shut down all instances of MySQL and then start the EventLog Analyzer server.
Probable cause: Port 33335 is not free
Solution: Kill the other application running on port 33335. If you cannot free this port, then change the MySQL port used in EventLog Analyzer.
Probable cause: The default web server port used by EventLog Analyzer is not free.
Solution: Kill the other application running on port 8400. Carry out the following steps.
wrapper.java.additional.21=-Djava.net.preferIPv4Stack=true
Before adding:
wrapper.java.additional.20=-Dorg.tanukisoftware.wrapper.WrapperManager.mbean=false
After adding:
wrapper.java.additional.20=-Dorg.tanukisoftware.wrapper.WrapperManager.mbean=false
wrapper.java.additional.21=-Djava.net.preferIPv4Stack=true
If you cannot free this port, then change the web server port used in EventLog Analyzer.
Probable cause:The syslog listener port of EventLog Analyzer is not free. Solution:
Probable cause: Path names given incorrectly.
Solution:
Note:The script will work only if the application is started as a service.
Probable cause: requiretty is not disabled
Solution: To disable requiretty, please replace requiretty with !requiretty in the etc/sudoers file.
Note:Elasticsearch uses multiple thread pools for different types of operations. It is important for new threads to be created whenever necessary. Please make sure that the number of threads that an elasticsearch user can create is at least 4096 by setting ulimit -u 4096 as root before starting Elasticsearch or by adding elasticsearch - nproc 4096 in /etc/security/limits.conf.
Navigate to <PRODUCT_HOME>\bin and invoke StartDB.bat as administrator. If you see access denied error, Execute setAppPermission.bat and wait for its completion.
Note: Backup will be done only for the instances with PGSQL or MSSQL database. PPM backup feature is not available for MySQL database.
The probable reason and the remedial action is: Probable cause: The device machine RPC (Remote Procedure Call) port is blocked by any other Firewall. Solution: Unblock the RPC ports in the Firewall.
The probable reasons and the remedial actions are:
Probable cause: The device machine is not reachable from EventLog Analyzer machine.
Solution: Check the network connectivity between device machine and EventLog Analyzer machine, by using PING command.
Probable cause: The device machine running a System Firewall and REMOTEADMIN service is disabled.
Solution: Check whether System Firewall is running in the device. If System Firewall is running, execute the following command in the command prompt window of the device machine:
netsh firewall set service type=REMOTEADMIN mode=ENABLE profile=all
The probable reasons and the remedial actions are:
Probable cause: By default, WMI component is not installed in Windows 2003 Server
Solution: Win32_Product class is not installed by default on Windows Server 2003. To add the class, follow the procedure given below:
In Add or Remove Programs, click Add/Remove Windows Components.
In the Windows Components Wizard, select Management and Monitoring Tools, then click Details.
In the Management and Monitoring Tools dialog box, select WMI Windows Installer Provider and then click OK.
Click Next.
The probable reasons and the remedial actions are:
Probable cause: The object access log is not enabled in Linux OS. Solution: Steps to enable object access in Linux OS, is given below: In the file /etc/xinted.d/wu-ftpd, edit the server arguments as mentioned below:
The probable reasons and the remedial actions are:
Probable cause: Unable to start or stop Syslog Daemon in Solaris 10 Solution: In Solaris 10, the commands to stop and start the syslogd daemon are: # svcadm disable svc:/system/system-log:default # svcadm enable svc:/system/system-log:default In Solaris 10, to restart the syslogd daemon and force it to reread /etc/syslog.conf: # svcadm refresh svc:/system/system-log:default # svcadm -v restart svc:/system/system-log:default
This error can occur if the ticketing tool server's HTTPS certificate is not included in EventLog Analyzer's JRE certificate store. To import the certificate to EventLog Analyzer's JRE certificate store, follow the steps below:
keytool -import -alias ticketingtool -keystore <Eventlog Analzyer Home>/jre/lib/security/cacerts -file path-to-certificate-file
If you are facing problems while configuring EventLog Analyzer with JIRA On-Premise even after entering the valid credentials, please follow the steps below:
Help link: https://developer.atlassian.com/cloud/jira/software/basic-auth-for-rest-apis/#captcha
Steps to edit maximum attempts or disable captcha:
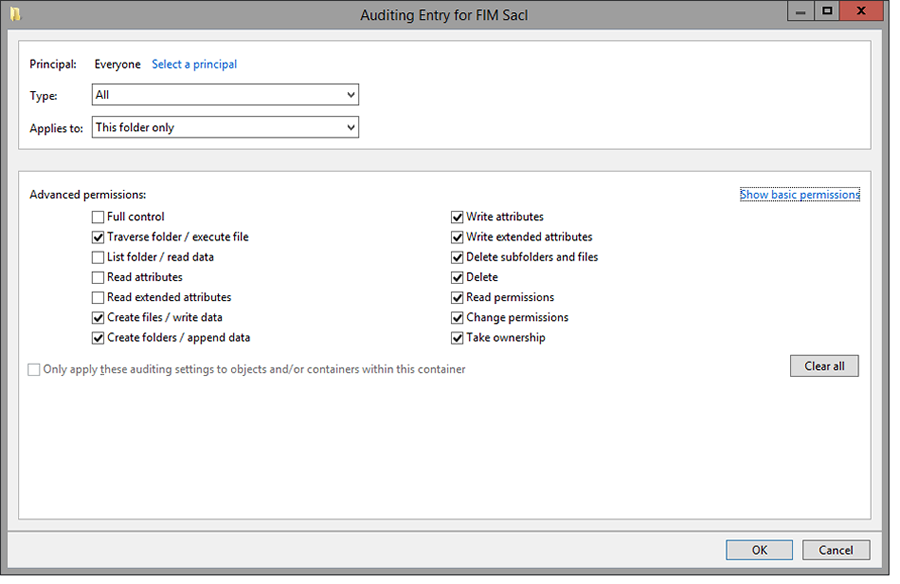
Try the following troubleshooting, if username is enabled for a particular folder.
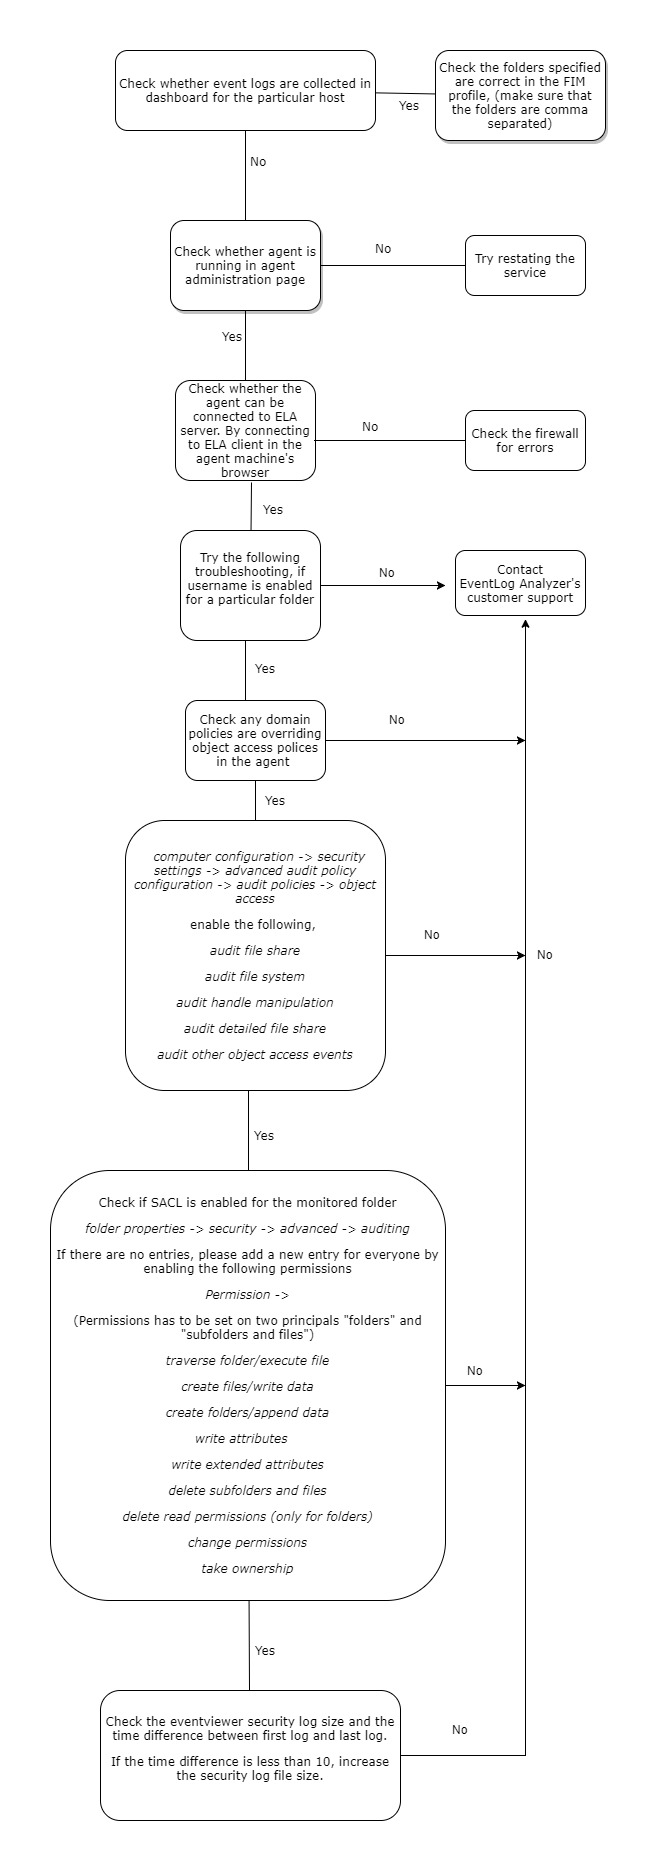
Note: The following GUI is for the SACL entry in folder properties.
The following are some of the common errors, its causes and the possible solution to resolve the condition. Feel free to contact our support team for any information.
Port already used by some other application
Cause: Cannot use the specified port because it is already used by some other application.
Solution: This can be solved either by changing the port in the specified application or by using a new port.
If you use a new port, make sure to change the ports in the forwarding device either manually or using auto log forwarding configuration.
TLS not configured
Cause: HTTPS not configured to support TLS encrypted logs.
Solution: Configure the server to use either a self-signed certificate or a valid PFX certificate.
For more details visit Connection settings.
PFX not configured
Cause: HTTPS is configured, but the type of certificate is not supported.
Solution 1: If no valid certificate is used, it's recommended to use SelfSignedCertificate.
To find the type of certificate used,
Solution 2: If valid KeyStore certificate is used, execute the following command in the <EventLog Analyzer home>/jre/bin terminal.
keytool -importkeystore -srckeystore <certificate path> -destkeystore server.pfx -deststoretype PKCS12 -deststorepass <password> -srcalias tomcat -destalias tomcat
For more details visit Connection settings.
External error
Cause: Unknown external issue.
Solution: please contact EventLog Analyzer Technical Support
Possible remedial actions include:
Execute the changeDBPassword.bat/sh file located in <EventLog Analyzer Home>/bin.
Windows:
Linux:
Some Windows devices appear duplicated due to a user interface issue identified as ELA 12260.
Duplicated devices with the oldest log collection timestamps will be deleted if they are linked to a local collector.
Duplicated devices with the oldest log collection timestamps will be disabled if:
They are linked to a remote collector.
The difference between the current date and the last message time is less than the retention period.
Duplicated devices with the oldest log collection timestamps will be deleted if:
They are associated with a remote collector.
The difference between the current date and the last message time exceeds the retention period.
If any of the deleted or disabled devices were previously configured under the following profiles: Application, Import, Alert, Report, Log Collection Filter, Syslog Forwarder, Agent, they will be remapped to ensure continued functionality.
For configurations pertaining to device groups, log collection failure alerts, compliance and custom log parser, please reconfigure the respective device. The erroneous device may have been mistakenly configured due to the UI issue mentioned above.
active = yes
direction = out
path = builtin_syslog
type = builtin
args = LOG_INFO
format = string
Note: This will forward the audit logs to the syslog service. Log Forwarding via Syslog Service should be enabled to receive the logs in EventLog Analyzer server.
keytool -import -alias ticketingtool -keystore <Eventlog Analyzer Home>/jre/lib/security/cacerts -file path-to-certificate-file
Causes
Solutions
setfacl -R -m u:<username>:rwx /opt/ManageEngine/temp
setfacl -R -m u:<username>:rwx /opt/ManageEngine/EventLogAnalyzer_Agent
setfacl -m u:<username>:w /etc/audit/plugins.d/elafim.conf
setfacl -m u:<username>:w /etc/audisp/plugins.d/elafim.conf
Solution
Cause
Solutions
Solutions
Windows device: Run the EventLogAgent.msi.
Linux device: Execute chmod +x EventLogAgent.bin, then run EventLogAgent.bin.
Solutions
The acl package is not present in the selected Linux device.
Solution:The acl package must be installed.
Execute the following command to verify that the immutable rule is enabled:
auditctl -s
If "enabled 2" is present in the configuration, it indicates that the immutable rule is active. This setting will prevent the Linux agent from applying any newly configured audit rules to monitor the locations specified in EventLog Analyzer.
Solution:
grep -rniw -e '-e' /etc/audit/
auditctl -s
Network capture drivers are files that allow EventLog Analyzer to capture and process incoming network logs from various sources. These include files such as npf.sys, Packet.dll, and wpcap.dll. These files must be stored in the Windows System Directories to ensure they are accessible to any application that requires them.
If the network capture driver is unavailable, you should move the files from the EventLog Analyzer installation directory to the Windows System Directories. To do so, follow the steps below.
Steps to move network capture driver files to Windows system directories
In case of failure, proceed with the manual procedure, given below.
Steps to copy network capture driver files manually
Finally, open and refresh the Log Receiver window in EventLog Analyzer.
Note: These steps are applicable only if EventLog Analyzer is installed on Windows.
Insufficient privileges for the rsyslog.conf or syslog.conf file.
Solutions:Setting privilege for rsyslog.conf or syslog.conf file.
Probable cause: The device machine is not reachable from the EventLog Analyzer server machine
Solution:
Check if the device machine responds to a ping command. If it does not, then the machine is not reachable. The device machine has to be reachable from the EventLog Analyzer server in order to collect event logs.
Probable cause: You do not have administrative rights on the device machine
Solution: Edit the device's details, and enter the Administrator login credentials of the device machine. Click Verify Login to see if the login was successful.
Error Code 0x251C
Probable cause: The device was added when importing application logs associated with it. In this case, only the specified application logs are collected from the device, and the device type is listed as unknown.
Solution:
Probable cause: There may be other reasons for the Access Denied error.
Solution: Refer the Cause and Solution for the Error Code you got during Verify login.
Scanning of the Windows workstation failed due to one of the following reasons:
Check if Remote DCOM is enabled in the remote workstation. If not enabled, then enable the same in the following way:
To enable DCOM on Windows XP devices:
Select Start > Run
Check if the user account is valid in the target machine by opening a command prompt and executing the following commands:
net use \<RemoteComputerName>C$ /u:<DomainNameUserName> "<password>"
net use \<RemoteComputerName>ADMIN$ /u:<DomainNameUserName> "<password>"
If these commands show any errors, the provided user account is not valid on the target machine.
Error Code 0x80041003The user name provided for scanning does not have sufficient access privileges to perform the scanning operation. This user may not belong to the Administrator group for this device machine.
Solution: Move the user to the Administrator Group of the workstation or scan the machine using an administrator (preferably a Domain Administrator) account.
A firewall is configured on the remote computer. Such exceptions mostly occur in Windows XP (SP 2), when the default Windows firewall is enabled.
Solution:
SelectStart > Run
Type Firewall.cpl and click OK
In the General tab, click Off
Click OK
netsh firewall set service RemoteAdmin
After scanning, you can disable Remote Administration using the following command:
netsh firewall set service RemoteAdmin disable
Solution: Install WMI core in the remote workstation.
Solution: Register the WMI DLL files by executing the following command in the command prompt: winmgmt /RegServer
There is some internal execution failure in the WMI service (winmgmt.exe) running in the device machine. The last update of the WMI Repository in that workstation could have failed.
Solution:Restart the WMI Service in the remote workstation:
Error Code 1722, 1726, 1753, 1825
Solution: Unblock the RPC ports in the firewall.
For any other error codes, refer the MSDN knowledge base.
Probable cause: The alert criteria have not been defined properly
Solution: Please ensure that the required fields in the Add Alert Profile screen have been given properly.Check if the e-mail address provided is correct. Ensure that the Mail server has been configured correctly.
Probable cause: The message filters have not been defined properly
Solution:When you are entering the string in the Message Filters for matching with the log message, ensure you copy/enter the exact string as shown in the Windows Event Viewer.
e.g., Logon Name:John
Probable cause: The transaction logs of MS SQL could be full
Solution: If the EventLog Analyzer MS SQL database transaction logs are full, shrink the same with the procedure given below:
If Oracle device is Windows, open Event viewer in that machine and check for Oracle source logs under Application type. If Linux, check the appropriate log file to which you are writing Oracle logs. If the Oracle logs are available in the specified file, still EventLog Analyzer is not collecting the logs, contact EventLog Analyzer Support.
The user name provided for scanning does not have sufficient access privileges to perform the scanning operation. Probably, this user does not belong to the Administrator group for this device machine
Check EventLog Analyzer's live Syslog Viewer for incoming Syslog packets.
If you are able to view the logs, it means that the packets are reaching the machine, but not to EventLog Analyzer. You need to check your Windows firewall or Linux IP tables.
If you are not able to view the logs in the Syslog viewer, then check if the EventLog Analyzer server is reachable. This can be done in the following ways:
tcpdump -n dst <ela_server_name> and dst port <port_no>
If reachable, it means there was some issue with the configuration. If not reachable, then you are facing a network issue.
If you have trouble installing the agent using the EventLog Analyzer console, GPOs or software installation tools, you can try to install the agent manually. Here the the steps for manual agent installation.
If an agent is installed manually without credentials or if the agent credentials are updated incorrectly, it leads to the "Agent not reachable from server" status (see screenshot below).
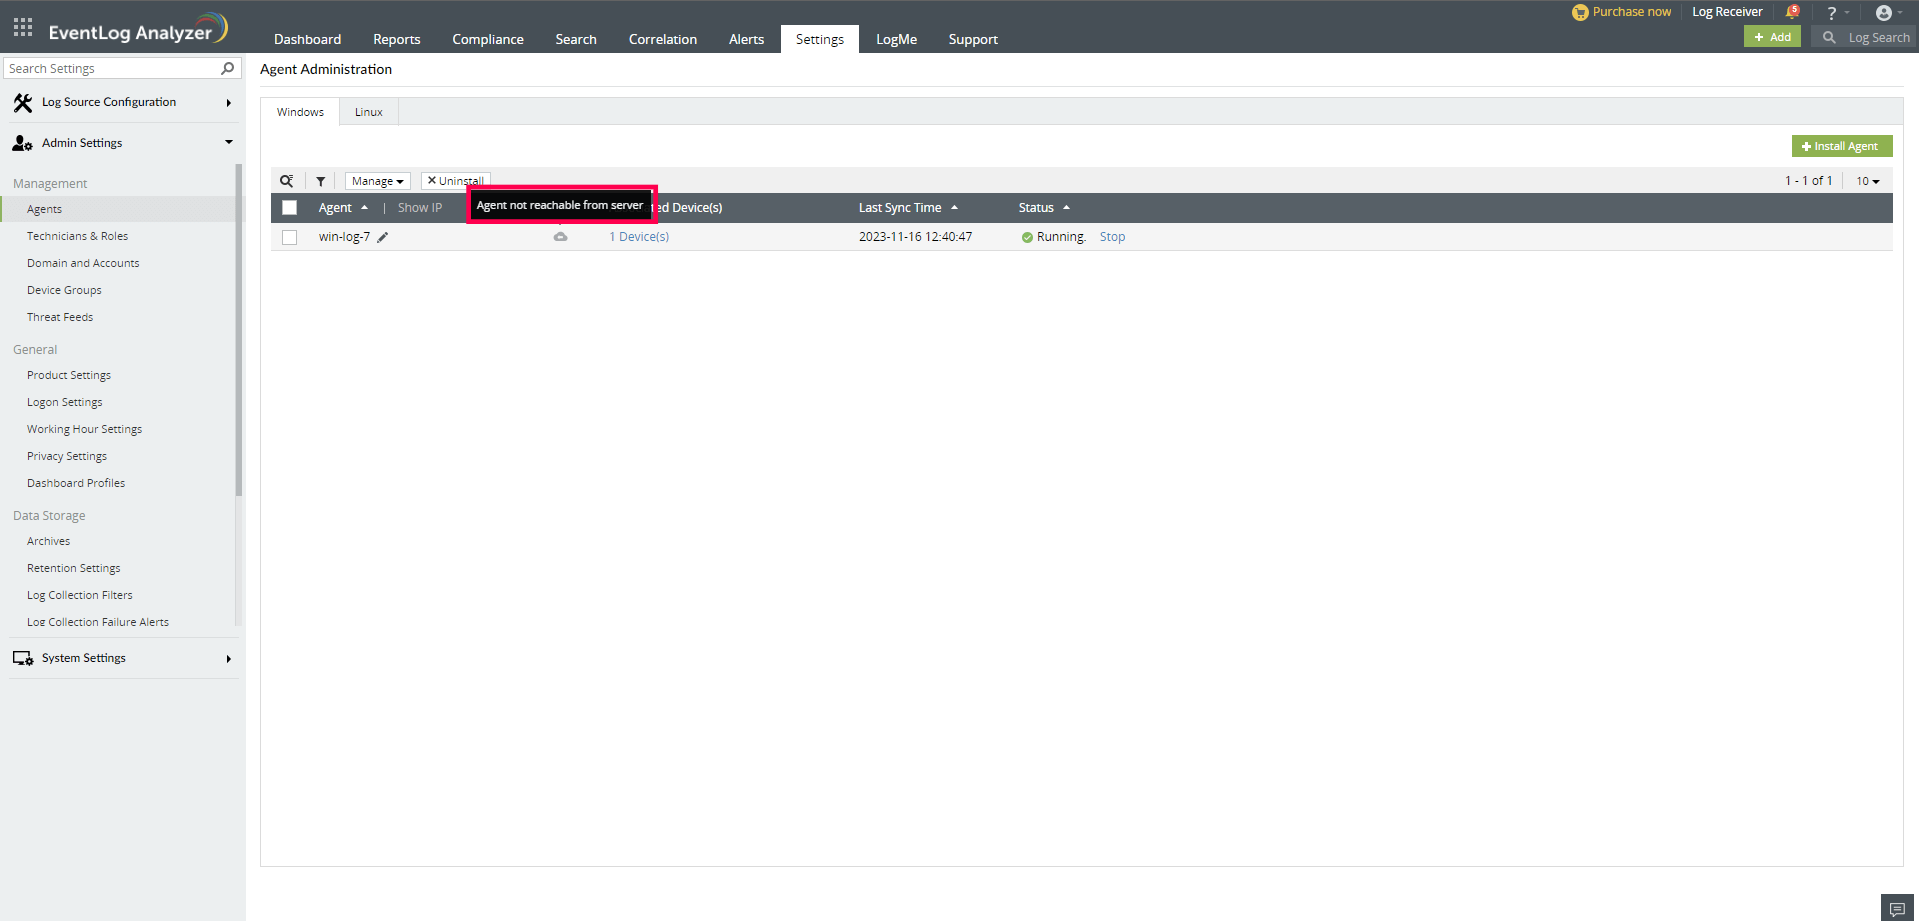
In such a state, the following actions performed on the agent will not reflect immediately.
Note: This icon does not hinder the log collection process, logs will be collected regardless of the presence of this icon.
Furthermore, actions such as starting and uninstalling the agent must be manually executed, as they cannot be performed through the UI due to invalid credentials.
If the cloud icon, indicating that the agent is unreachable from the server, is to be hidden or if real-time actions are required, please make sure to update the credentials accurately.
"Agent not communicating" is the agent status that appears if there has been a prolonged time of no communication between the agent and the server.
In such a state, the following actions should be performed:
Note: Contact support if the issue persists even after following the above steps.
Windows Agent
Linux Agent
While I was trying to add a STIX/TAXII server to EventLog Analyzer, I got the following error messages. What do they mean?
This error message pops up when the feature you tried to use is not available in the online demo version of EventLog Analyzer. To try out that feature, download the free version of EventLog Analyzer.
This error message can be caused because of different reasons. It might be due to network issues, proxy related issues, bad requests in the network, or if the URL is unable to locate a STIX/TAXII server.
This error message denotes that the URL entered is malformed.
This error message signifies that the credentials entered are wrong.
Description:
This error occurs when the common name of the SSL Certificate doesn't exactly match the hostname of the server in which the EventLog Analyzer is installed.
Solution:
Please get a new SSL certificate for the current hostname of the server in which EventLog Analyzer is installed.
Description:
This error occurs when the SSL certificate you have configured with EventLog Analyzer is invalid. A certificate can become invalid if it has expired or other reasons.
Solution:
Please configure EvnetLog analyzer to use a valid SSL certificate.
Description:
This exception occurs when you configure a SMTP mail server or a web server with SSL in EventLog Analyzer, and the server uses a self-signed certificate. The Java Runtime Environment used in EventLog Analyzer will not trust self-signed certificates unless it is explicitly imported.
Solution:
You need to import the self-signed certificates used by the server in the JRE package used by EventLog Analyzer. Follow the steps given below:
Step 1: Download the certificate
For SMTP servers:
openssl.exe s_client -connect SMTPServer: Portno -starttls smtp > certificatename.cer
For Web Servers:
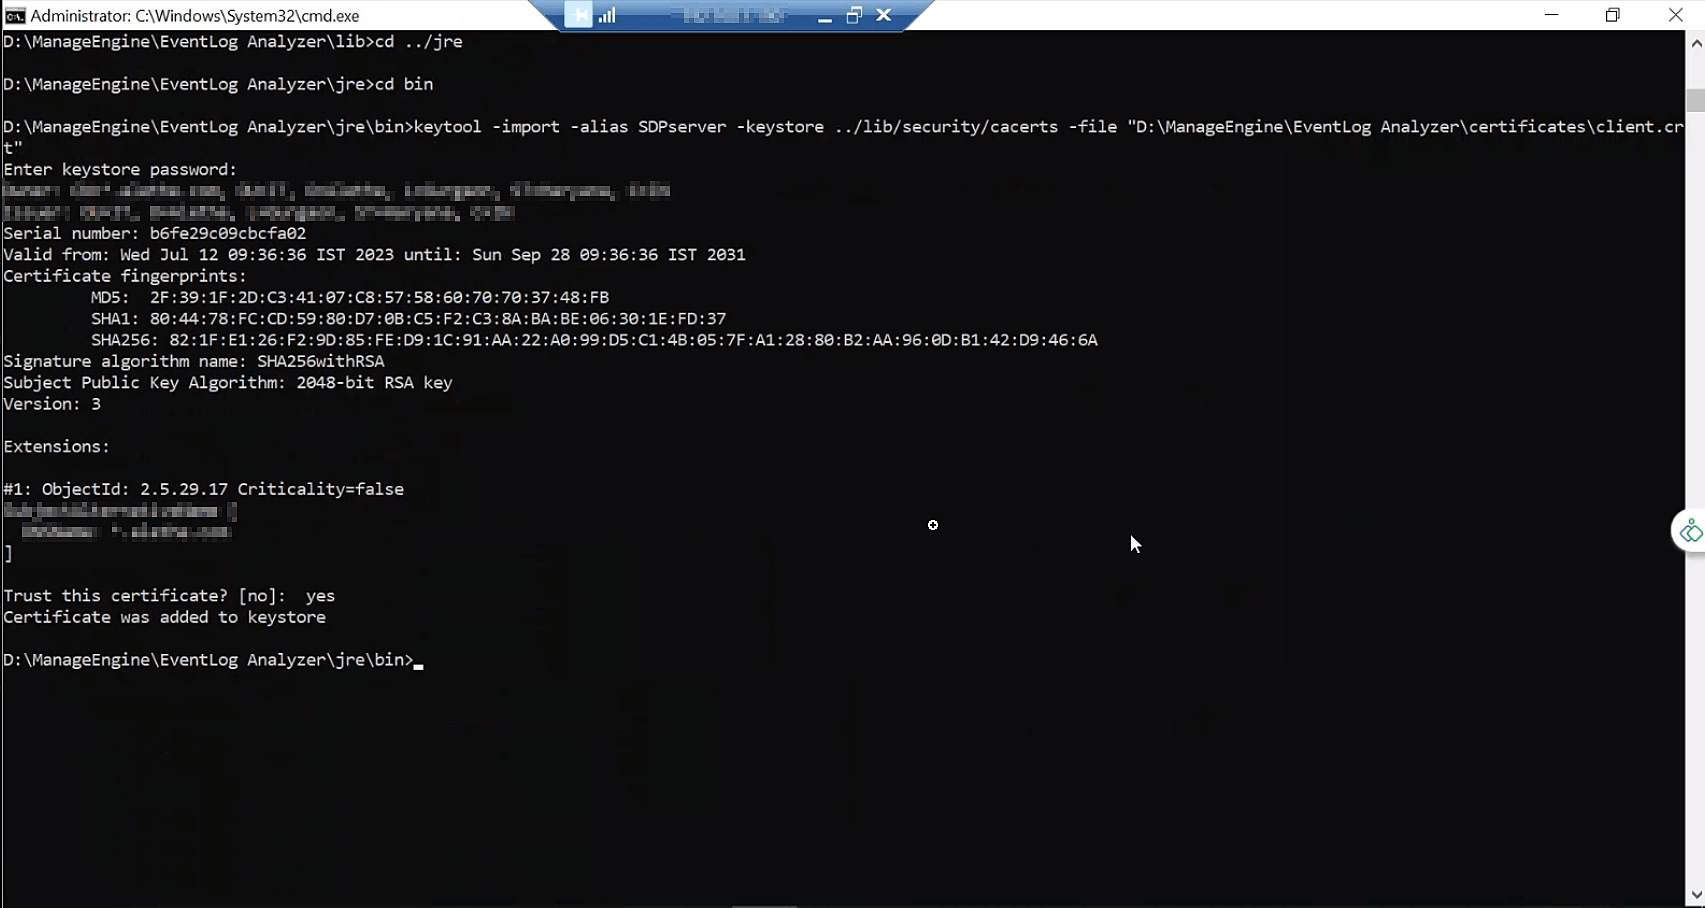
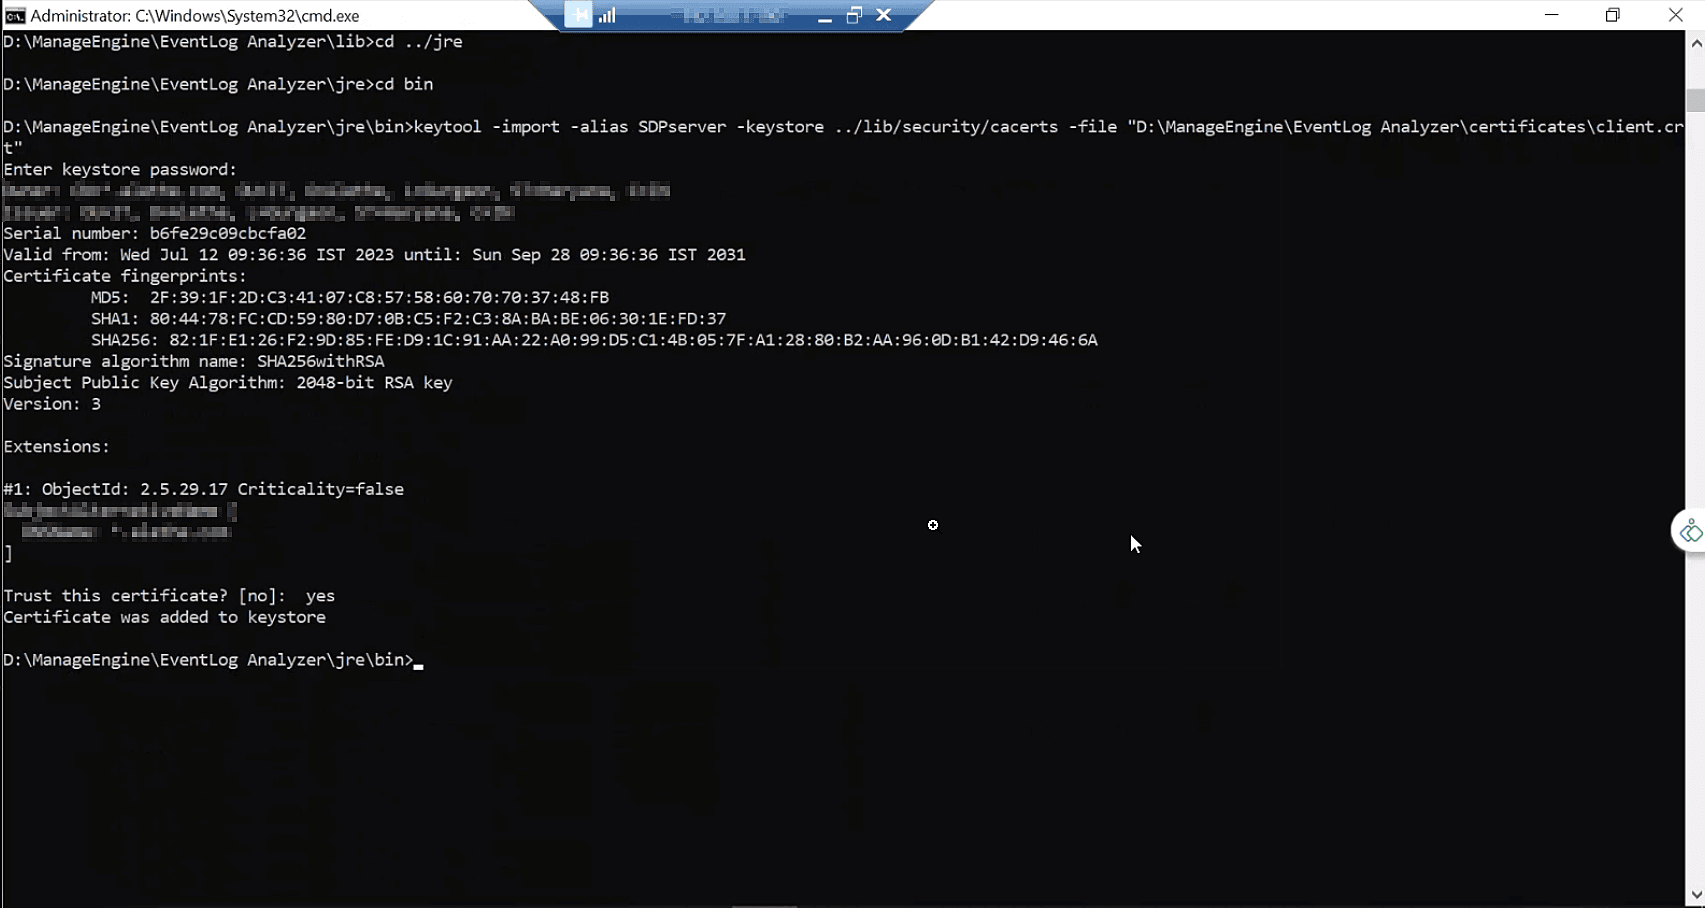
Step 2: Import the certificates in JRE package of EventLog Analyzer.
Keytool -importcert -alias myprivateroot -keystore ..\lib\security\cacerts -file
This may happen when the product is shutdowns while the data store is updating and there is no backup available.
Troubleshooting steps:
This is a rare scenario and it happens only when the product shuts down abruptly during the first ever download of IP geolocation data.
There is no need for a troubleshoot as EventLog Analyzer will automatically download the data in the next schedule. Please note that the IP geolocation data gets automatically updated daily at 21:00 hours.
This occurs when there is no internet connection on EventLog Analyzer server or if the server is unreachable.
Troubleshooting steps:
Make sure you have a working internet connection.
Whitelist the following in your firewall:
This may happen when the product is unable to connect to the Log360 Cloud feeds server.
Case 1: Access is Blocked under firewall
Probable cause: The access to Log360 Cloud feeds server may be blocked under the firewall.
Solution:
Case 2: Unable to resolve DNS
Probable cause: The machine could not resolve the domain using its DNS resolver.
Solution:
If none of the above works and the issue persists, contact our Technical Support team.
If the license file cannot be accessed in the following page https://licensing.manageengine.com , kindly contact eventlog-support@manageengine.com
This can happen if the access key gets invalidated.
To regenerate the access key, please follow the below steps:
This happens when you exceed one of your quotas (per minute, per day or per month). Daily quotas are reset every day at 00:00 UTC.
Troubleshooting steps:
There may be various reasons for receiving this error.
Customers are advised to retry in a while, and if the same error is encountered, kindly contact " eventlog-support@manageengine.com "
This occurs when EventLog Analyzer server faces network connectivity issues.
Troubleshooting steps:
Make sure you have a working internet connection.
Whitelist the following in your firewall:
This occurs, when the JRE present in the product is not updated of the changes.
java -jar tzupdater.jar -l https://data.iana.org/time-zones/releases/tzdata2023c.tar.gz
Incase customer environment is restricted from Online access follow 6.1 and 6.2.
6.1: please select the latest time zone updater link from https://data.iana.org/time-zones/releases/ and download the latest timezone zip in tar.gz format.
6.2 Execute the following command "java -jar tzupdater.jar -l file:downloaded_timezone_data_zip.tar.gz"
For example
java -jar tzupdater.jar -l file:"C:/ManageEngine/EventLog/jre/tzdata2023c.tar.gz"
What is Elasticsearch data path?
Elasticsearch writes the data you index to indices, and data streams to a data directory which is available in elasticsearch.yml. Search and indexing will not work if the data path is not accessible.
If the data path is not accessible to write, the following notification will be shown.
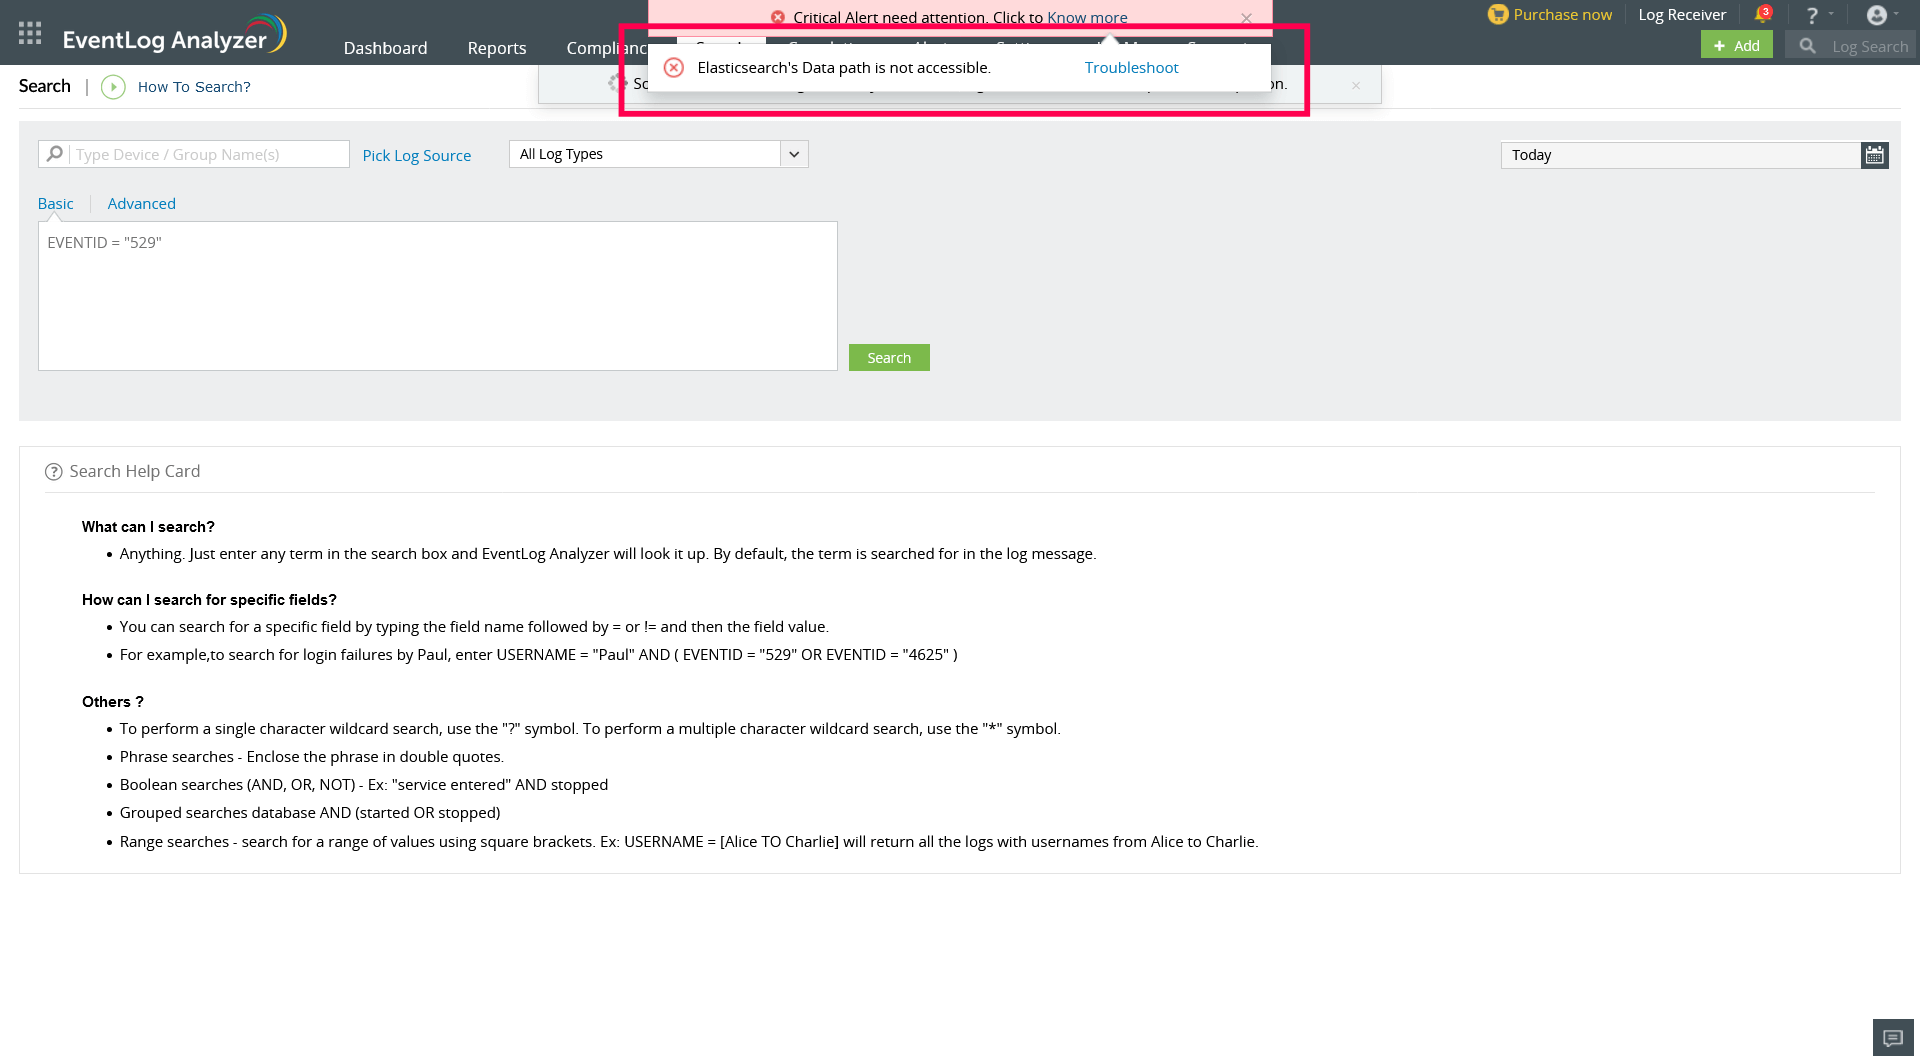
Troubleshooting steps
If there is a need to change the data path of Elasticsearch, kindly follow this guide.
Copyright © 2020, ZOHO Corp. All Rights Reserved.