Dashboard View
The Overview drop-down in the monitoring section is a consolidation of all data collected for generating the Exchange monitoring reports. The dashboards offer a quick snapshot of the statuses of all the functionalities monitored in your Exchange Server environment.
Formulation of graphs and tables occurs only when the dashboard borrows the required raw data collected for the reports. Therefore, it is imperative that you refrain from deleting or disabling any of the predefined reports.
To access these dashboards:
- Go to the Monitoring tab.
- Click on the Overview drop-down.
- Select the required objects from the options available.
- You can choose the desired Exchange server from the drop-down just above the Overview option.
- Choose the time period for which you want the dashboard details using the Period option available in the top-right corner.
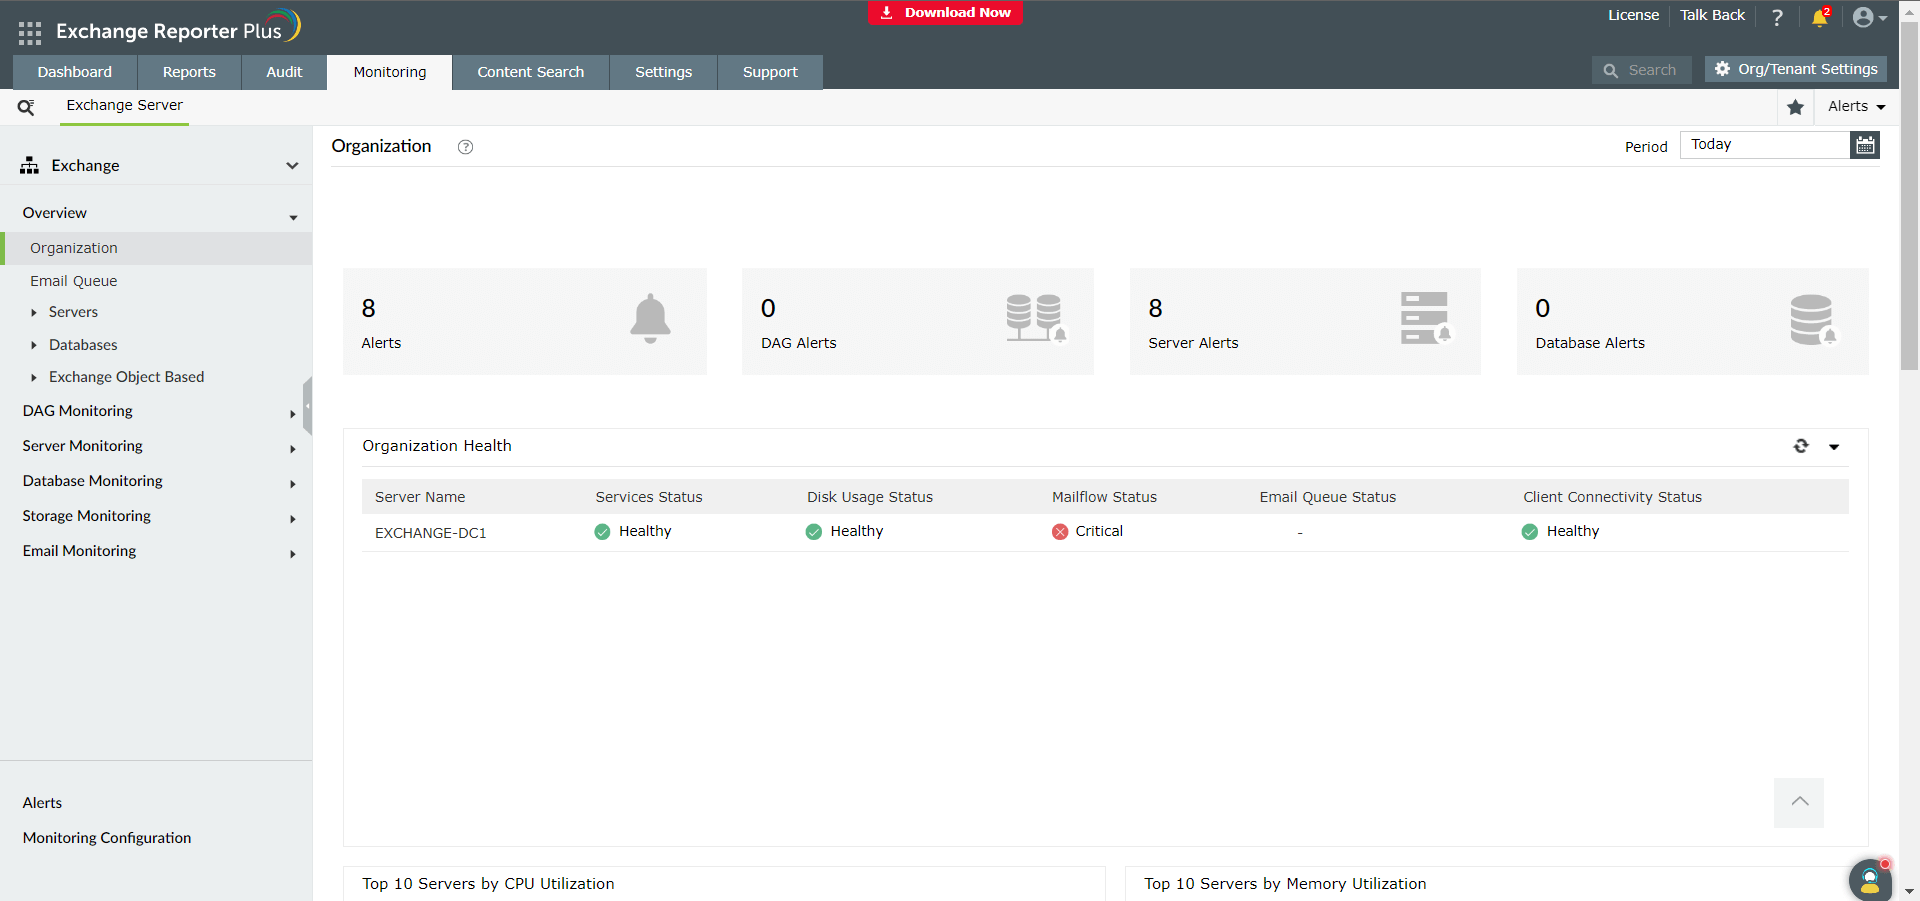
Exchange Reporter Plus provides an overview of all the following objects in your Exchange organization:
- Organization: Summarizes monitoring parameters like alert counts, critical servers, and databases, as well as their health status, at an organizational level.
- DAG: Summarizes the DAG replication health, copy status, and more.
- Email Queue: Summarizes the types of queues in your organization (like poison, unreachable, or submission) and their health statuses.
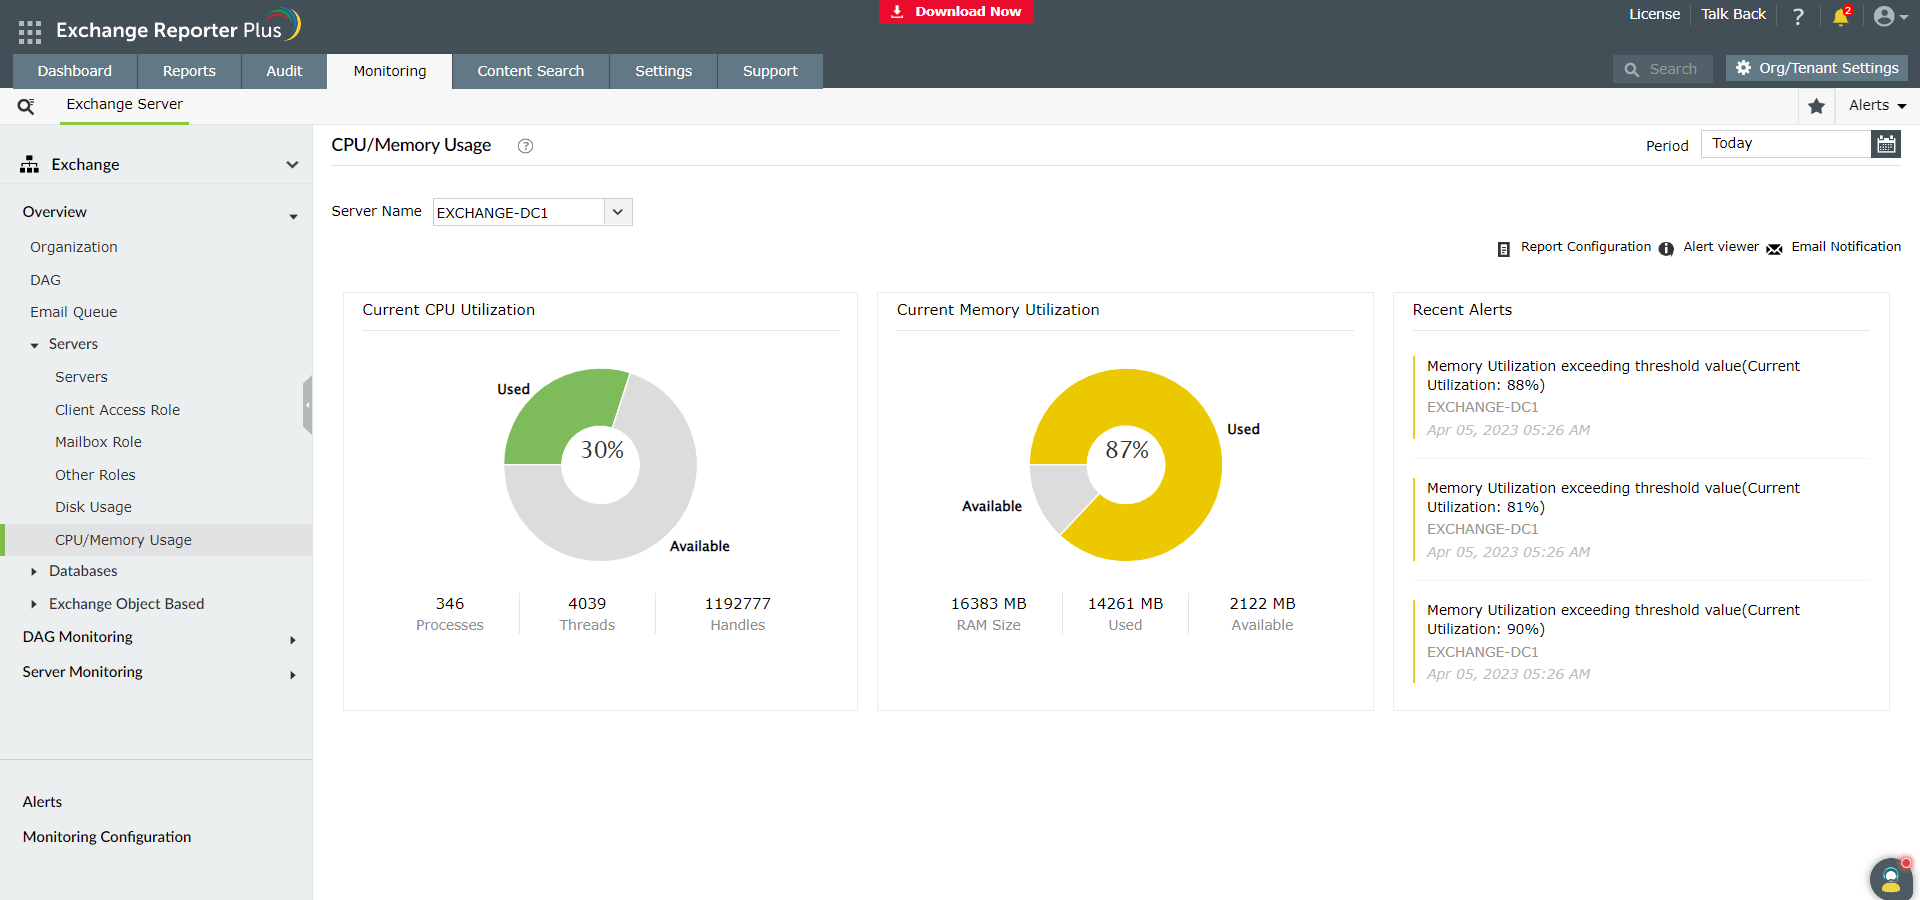
- Servers: Displays dashboard views of various aspects related to Exchange servers; various roles, including client access and mailbox; disk usage; and CPU or memory usage.
- Databases: Summarizes the databases' health status, search time, connectivity latency, backup status, and more.
- Exchange Object Based: Shows a monitoring overview and alerts specific to each component of your Exchange environment, including servers, databases, and DAGs. You can choose the objects based on your need.
 ADManager Plus
 ADAudit Plus
 ADSelfService Plus
 M365 Manager Plus