VPN Trend Reports
VPN trends help in identifying VPN connections spread over a time period for a particular device, that eventually lead to better planning of VPN policies, and increasing the VPN usage efficiently. The VPN Trend Reports section includes reports that show trends in the number of VPN users connecting across the Firewall/Concentrator. The VPN Trend Report consists of two parts. - VPN Trend Report
- Active Connection Trend
In the VPN Trend Report, on the top, the list of VPN users currently active are listed as Live VPN Users and below that the time based trend reports of VPN usage are displayed in graphs as VPN Trends.
Live VPN Users Details of all the VPN Users currently connected across the Firewall/Concentrator are listed in this section of the report. The details in the Live VPN Users list are explained below: | VPN User | - the user name of the VPN connection across firewall. | | Host | - the host name / IP address of the machine of the VPN user, which got connected through VPN. | | VPN Type | - the type of VPN connection used by the user. | | Start Time | - the time at which the VPN connection across firewall for the user was started. | | Duration | - the duration of time up to the current time, for which the user is connected through VPN across firewall. |
VPN Trends The VPN trend reports are available separately for each Firewall/Concentrator device. These are pre-defined reports. There are four trend reports available for VPN. They are: - Last 24 Hours VPN Trend
- Last 7 Days VPN Trend
- Last 30 Days VPN Trend
- Last Year VPN Trend
The description of the VPN trend reports are given below: The Last 24 Hours VPN Trend report compares the number of
VPN user connections across this firewall over the past 24 hours, with the time in hours at the X axis of the graph always representing the last 24 hours prior to the current time. The Last 7 Days VPN Trend report compares the number of VPN user connections across this firewall over the past 7 days, with the day at the X axis of the graph always representing the last 7 days prior to the current date. The Last 30 Days VPN Trend report compares the number of VPN user connections across this firewall over the past 30 days, with the date at the X axis of the graph always representing the last 30 days prior to the current date. The Last Year VPN Trend report compares the number of VPN user connections across this firewall over the past 12 months, with the month at the X axis of the graph always representing the last 12 months prior to the current month.
Active Connection Trend 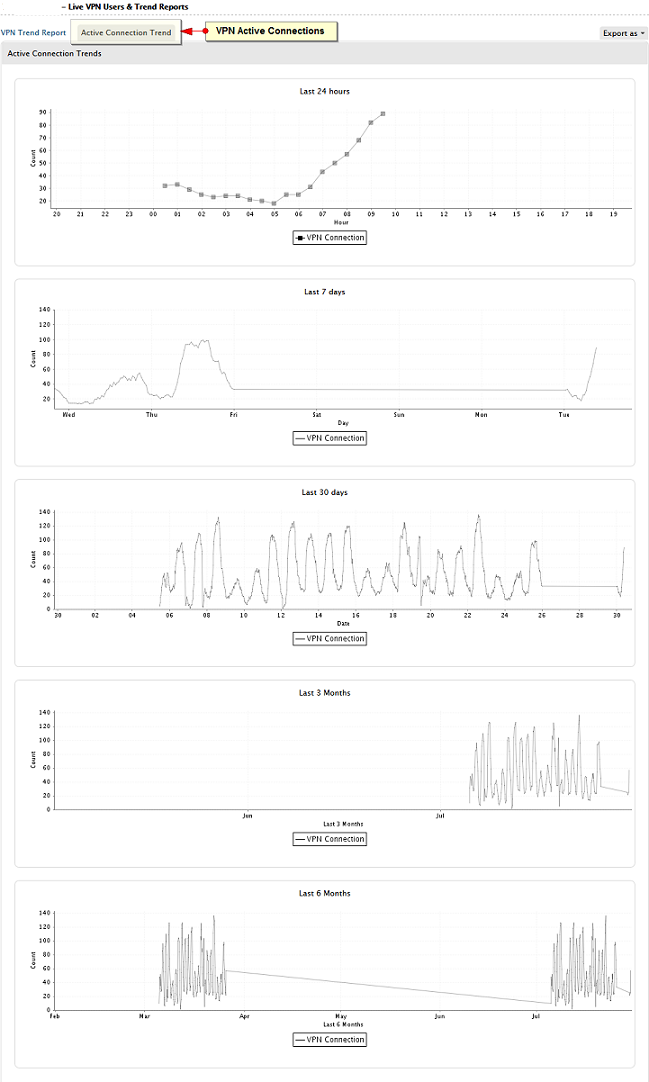
VPN active connection trend is displayed in graphs for the following time period. - Last 24 Hours
- Last 7 Days
- Last 30 Days
- Last 3 Months
- Last 6 Months
| 

