Application management

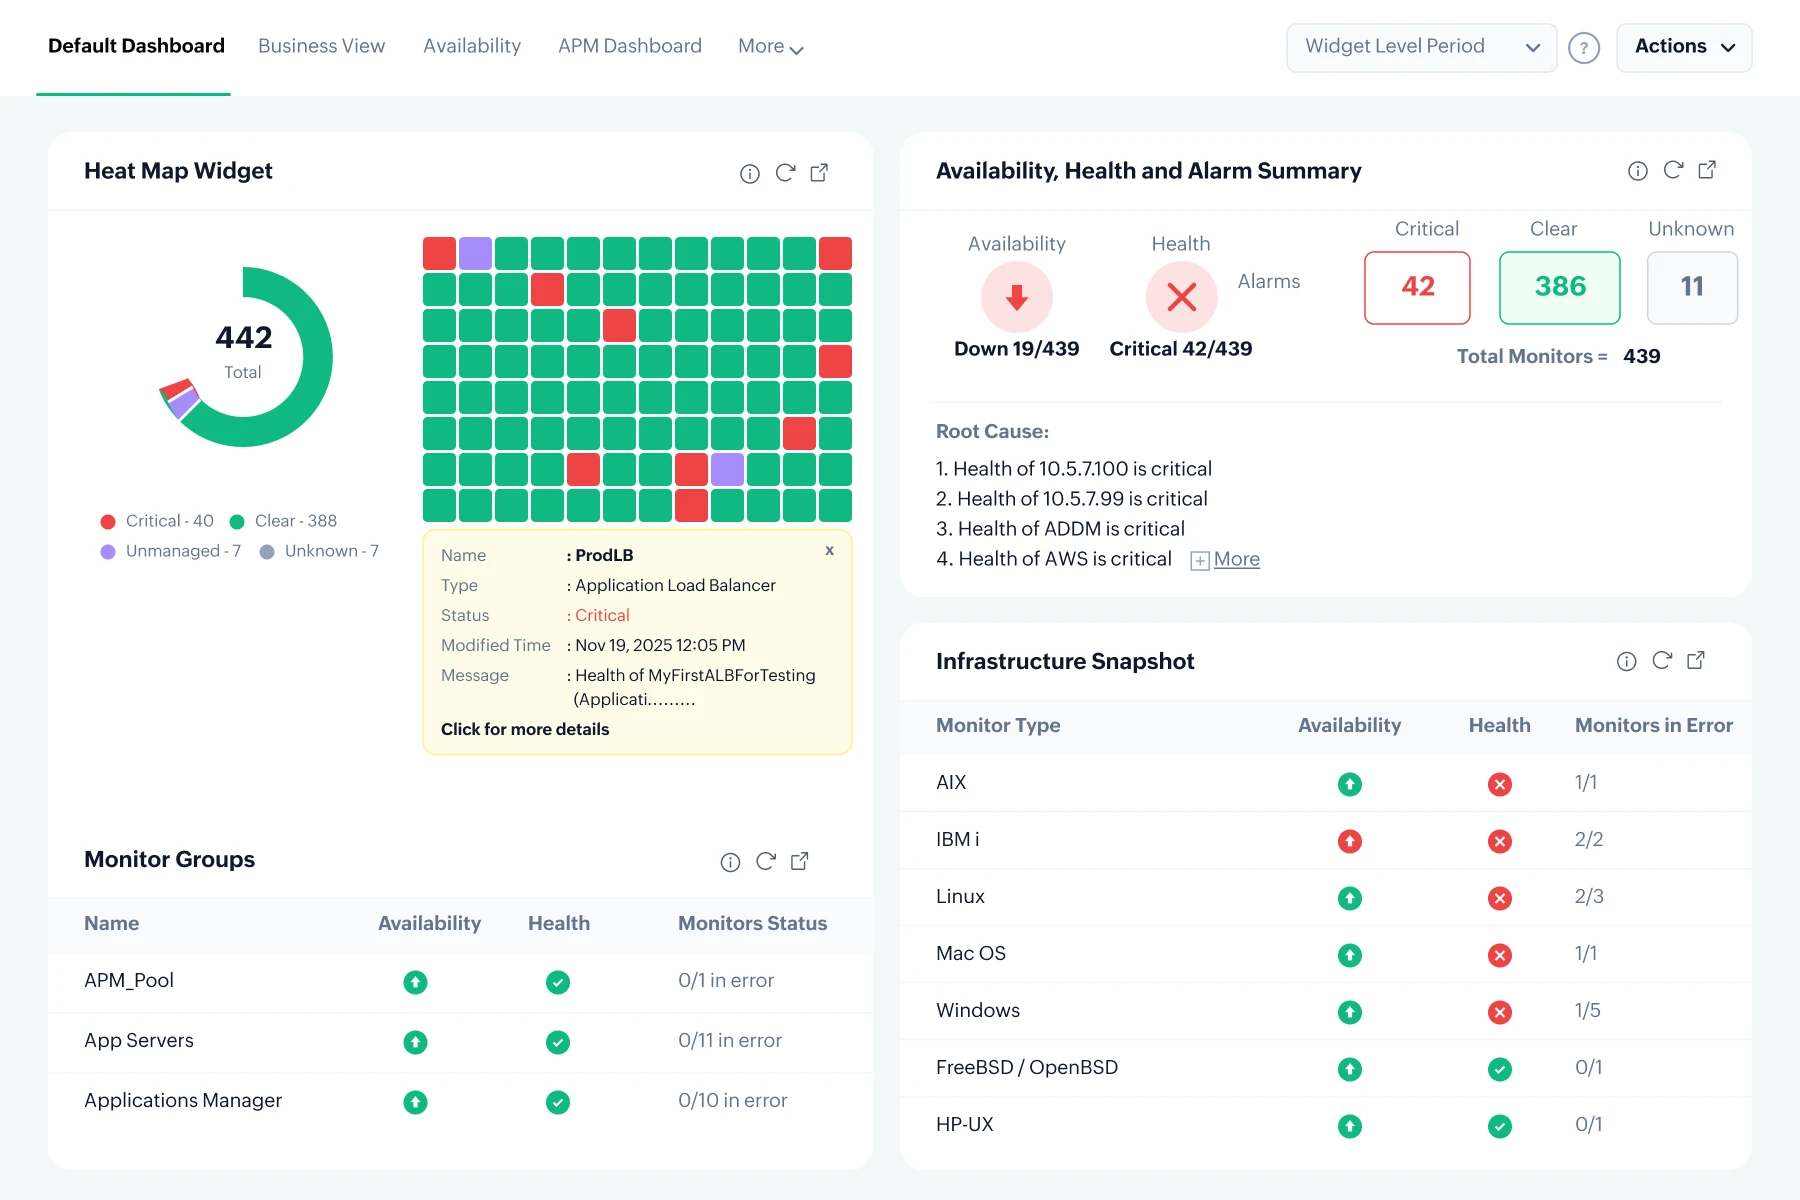
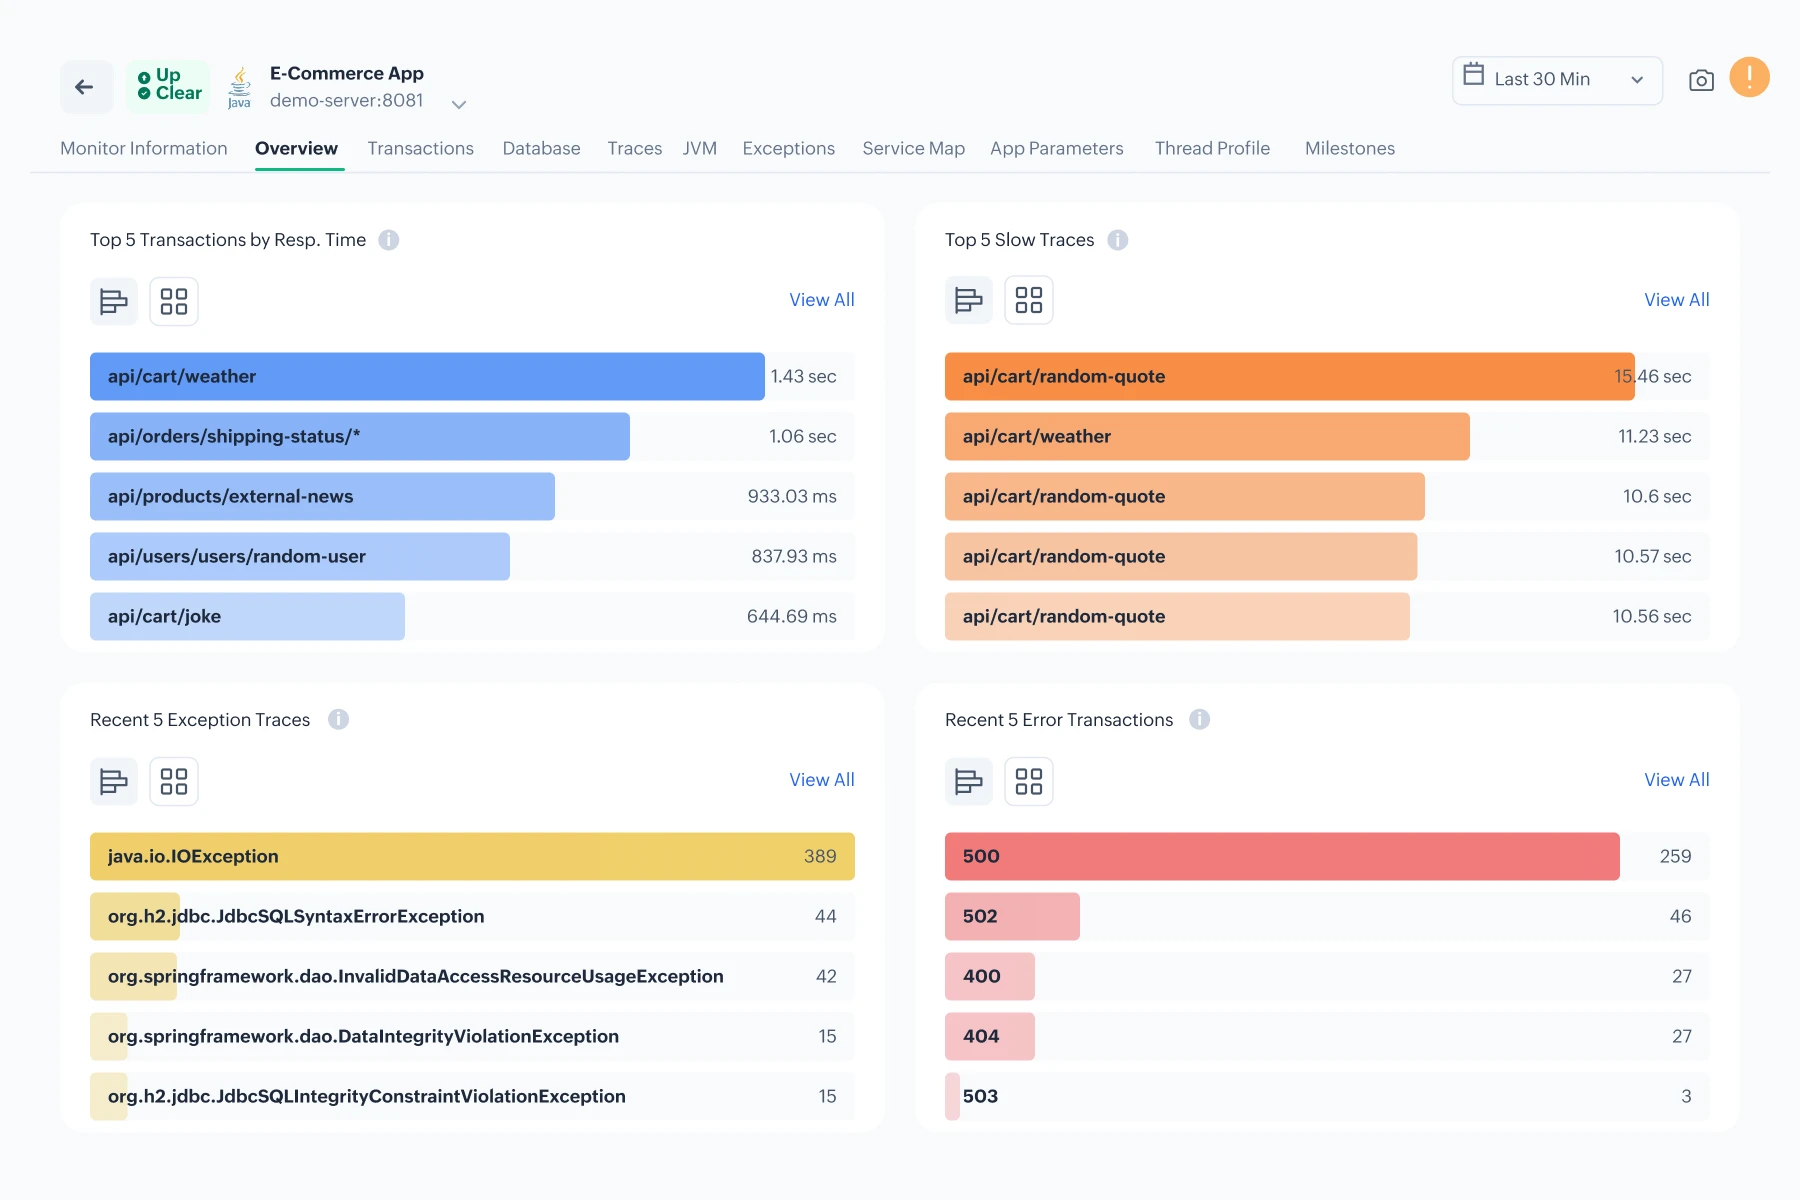
OpManager Plus integrates with Applications Manager — our application performance monitoring solution—to help you ensure that your revenue-critical applications meet end user expectations. Applications Manager offers out-of-the-box monitoring support for more than 100 applications and server types.

Application discovery and dependency mapping

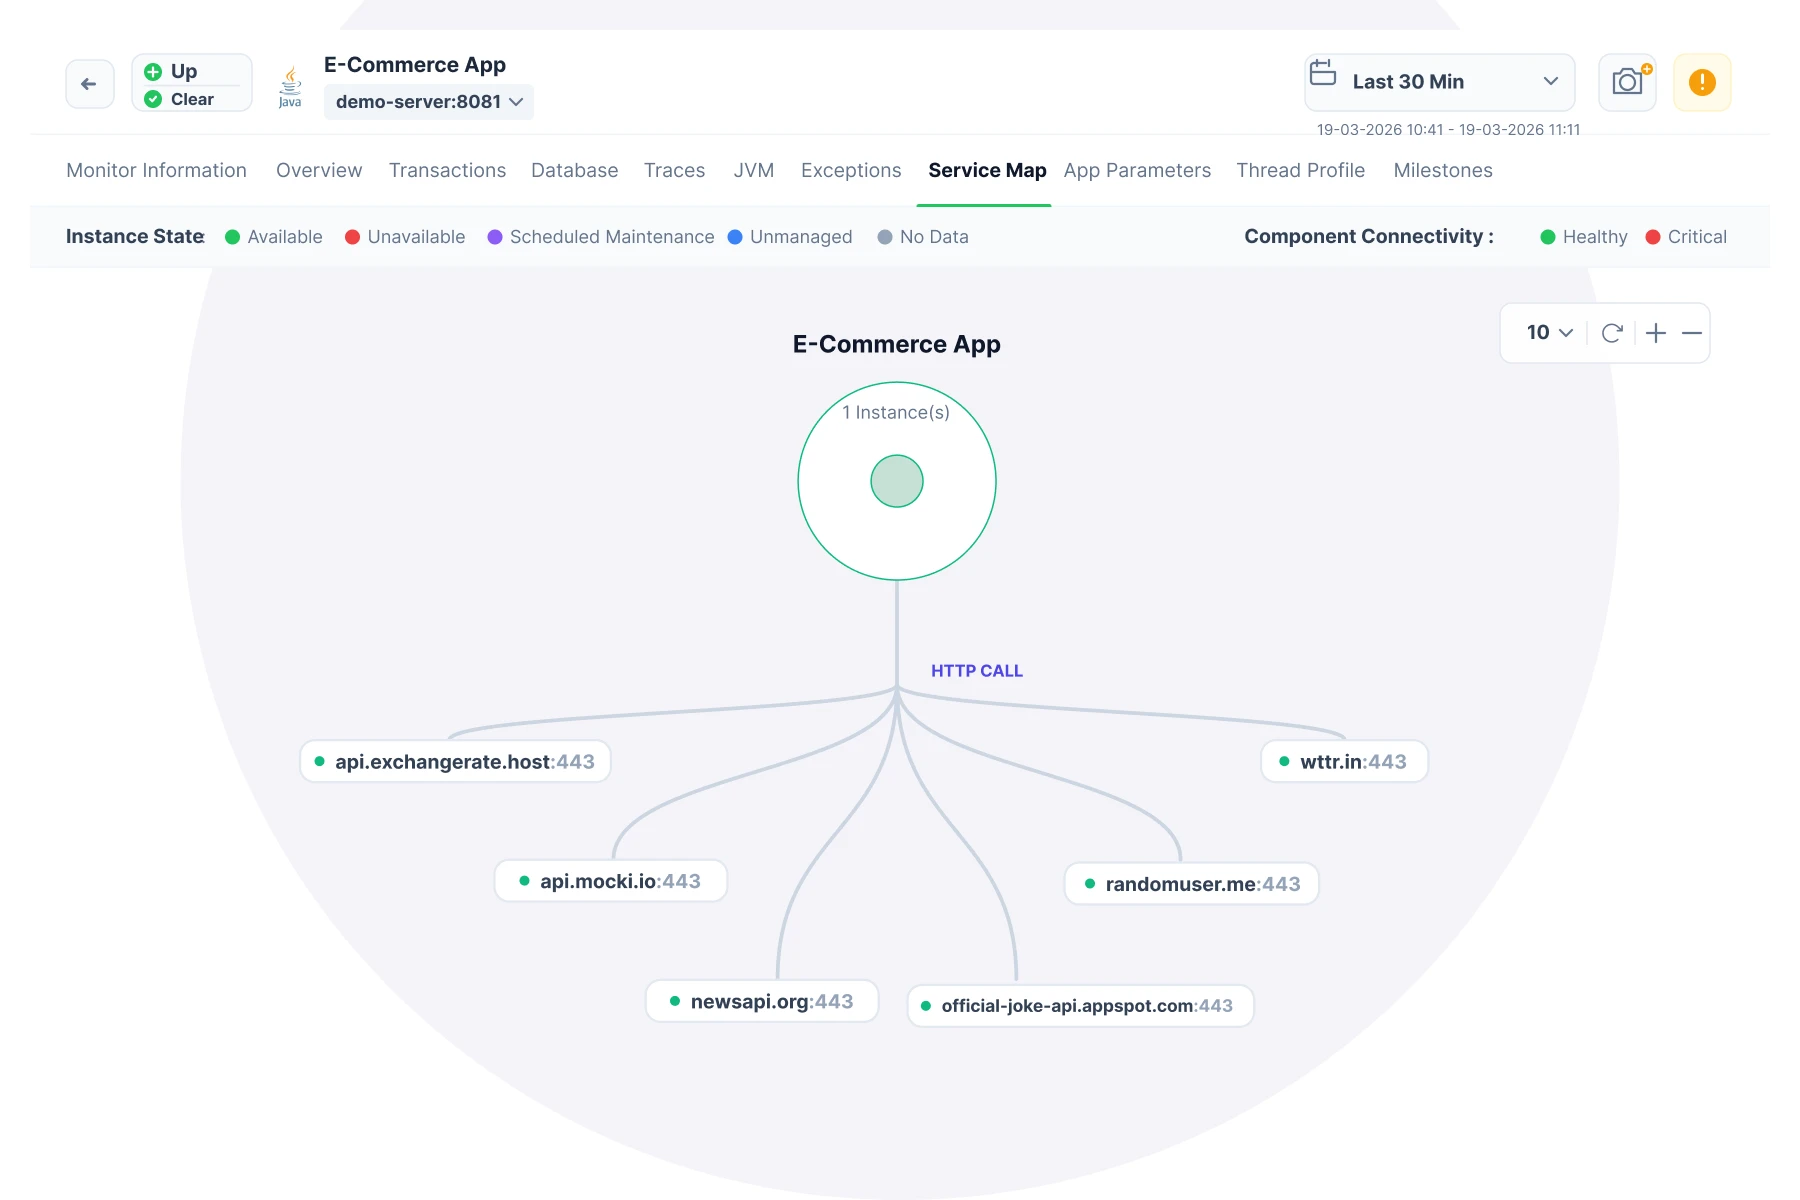
Seamlessly discover and map the dependencies between applications and infrastructure components in your IT infrastructure. This enables proactive detection of potential bottlenecks and failures, and optimization of your IT resources.

Anomaly Detection

Anomaly detection helps you identify gradual performance degradation by defining anomaly profiles on performance metrics. An anomaly profile is a set of rules that define what is considered normal behavior for a particular metric. By comparing current data to previously reported best data, you can create anomaly profiles that will alert you if there is a significant deviation from the norm. For example, if the load on a server increases over time, the response time will gradually degrade. With the help of anomaly detection, you can identify this performance issue in advance before it can cause an outage.

Powerful reporting

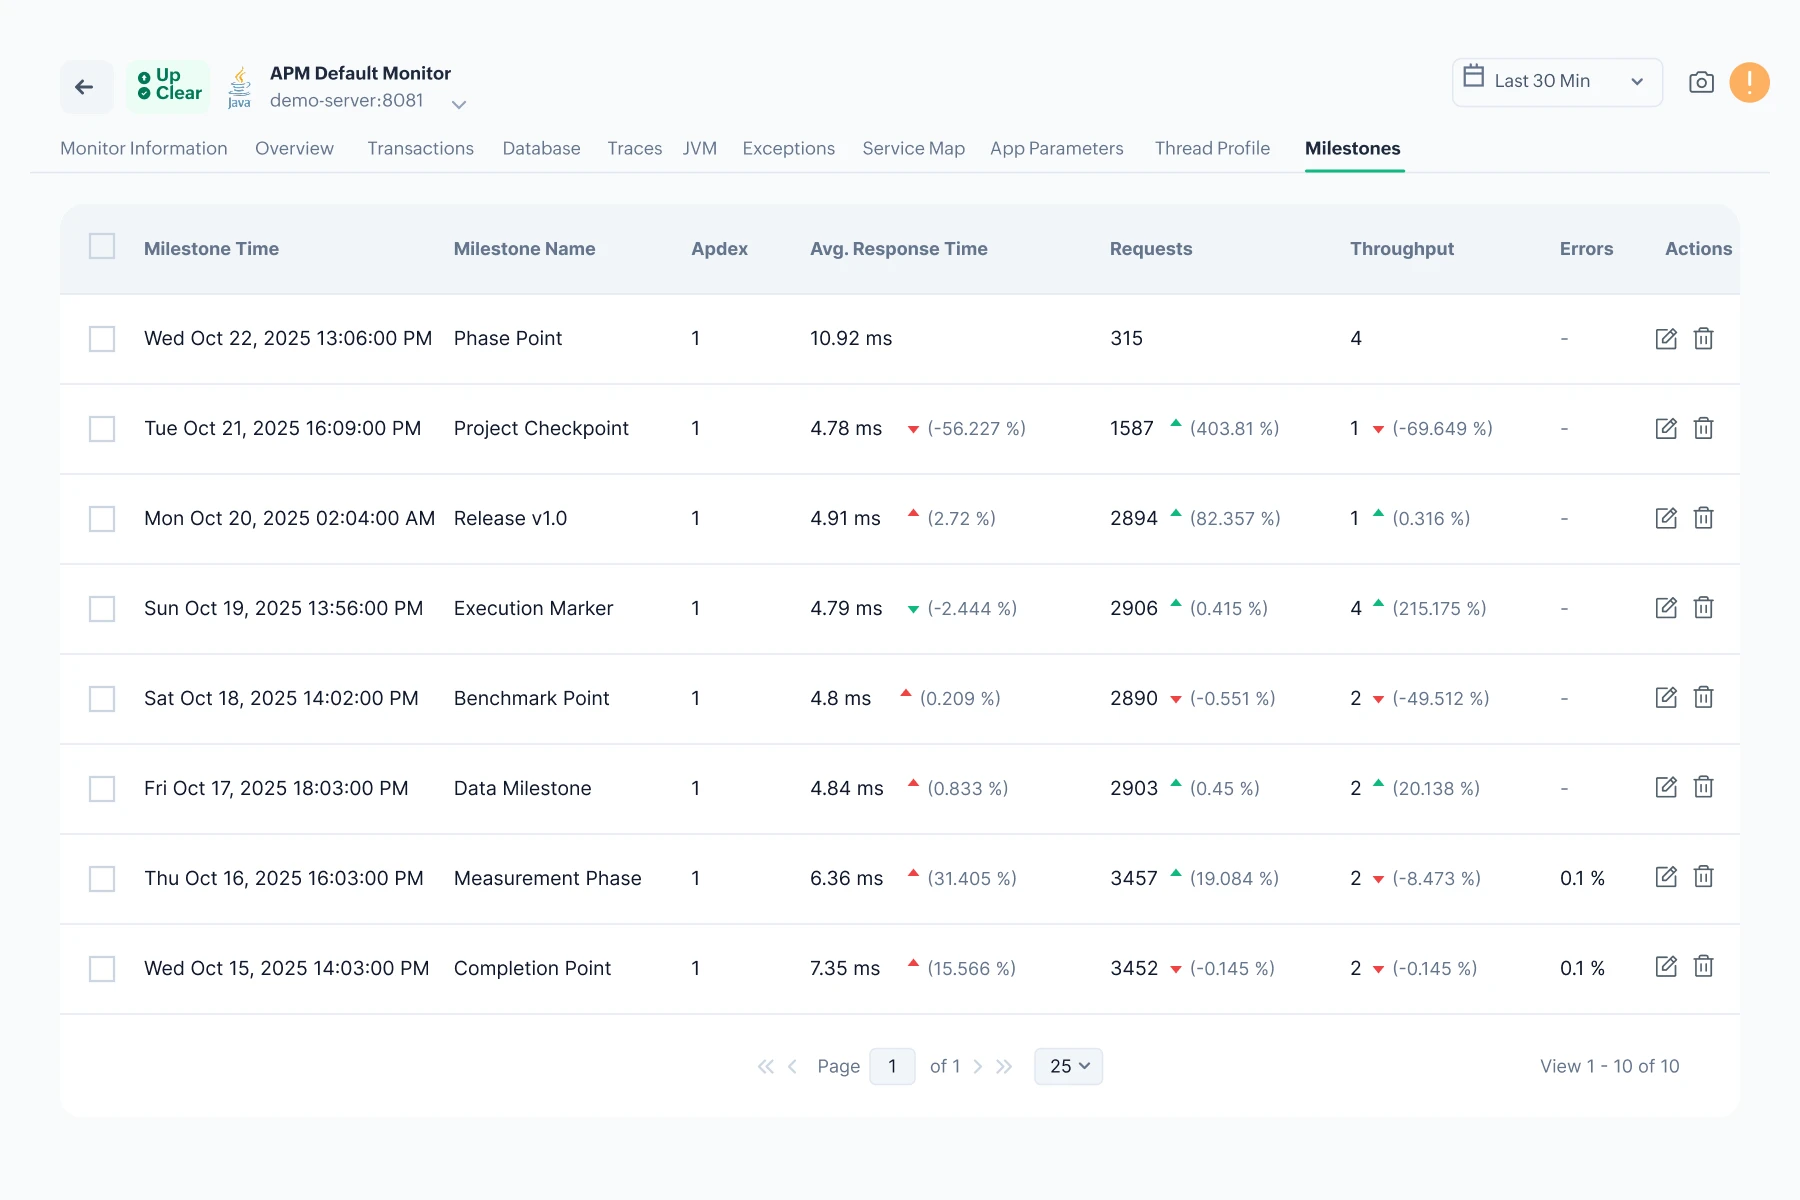
Reports can be generated depicting the availability, health, response time and alarms of the application over a specified period of time. Reporting feature lets you analyze your servers,applications,databases,web servers,web applications across specific timeline without fuss.

Performance monitoring

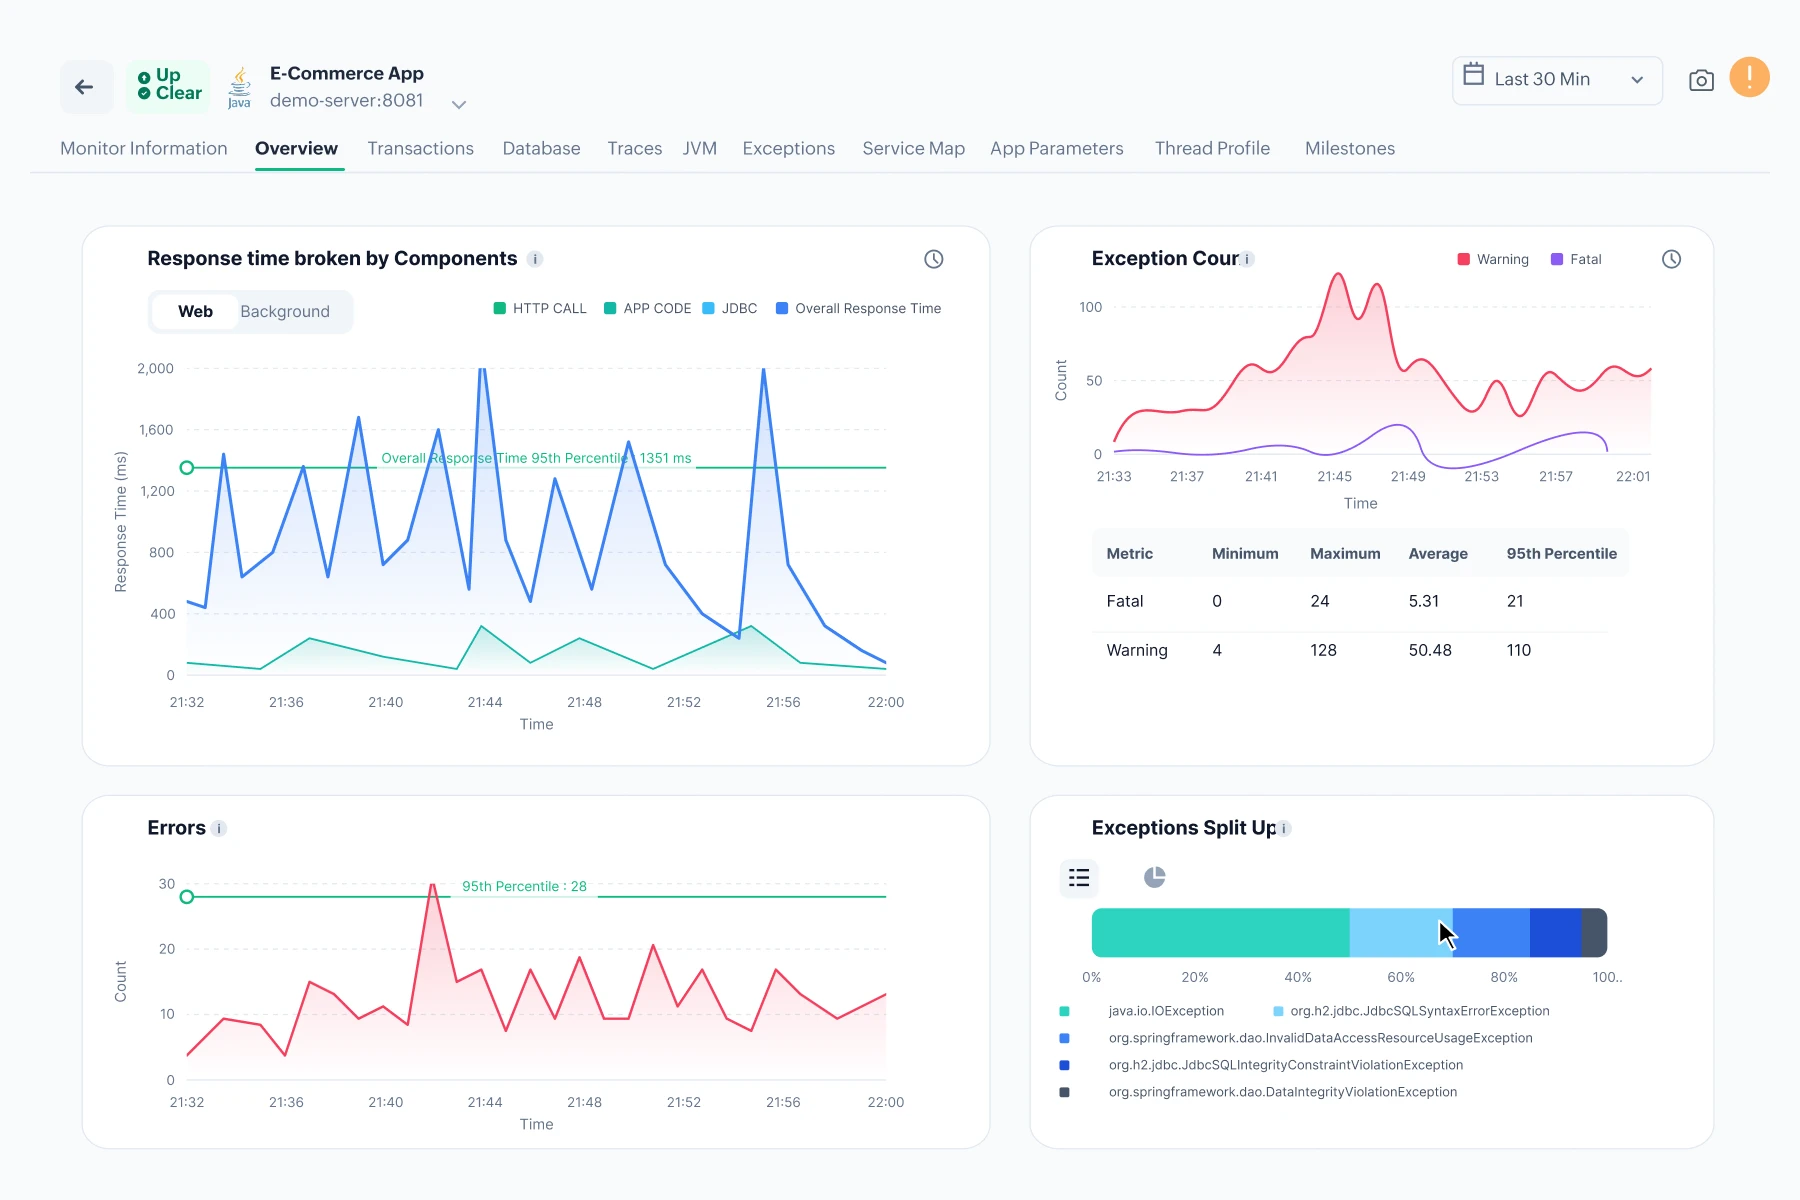
With OpManager Plus' application performance monitoring capabilities, you can monitor over 100 key performance indicators of your applications, including response time, resource availability, CPU utilization and memory utilization. The infrastructure and operational environments that support applications, can also be monitored for performance including network stats, server uptime, disk I/O analytics etc. This enables proactive capacity planning and precise resource allocation to ensure great user experience.

Database Monitoring

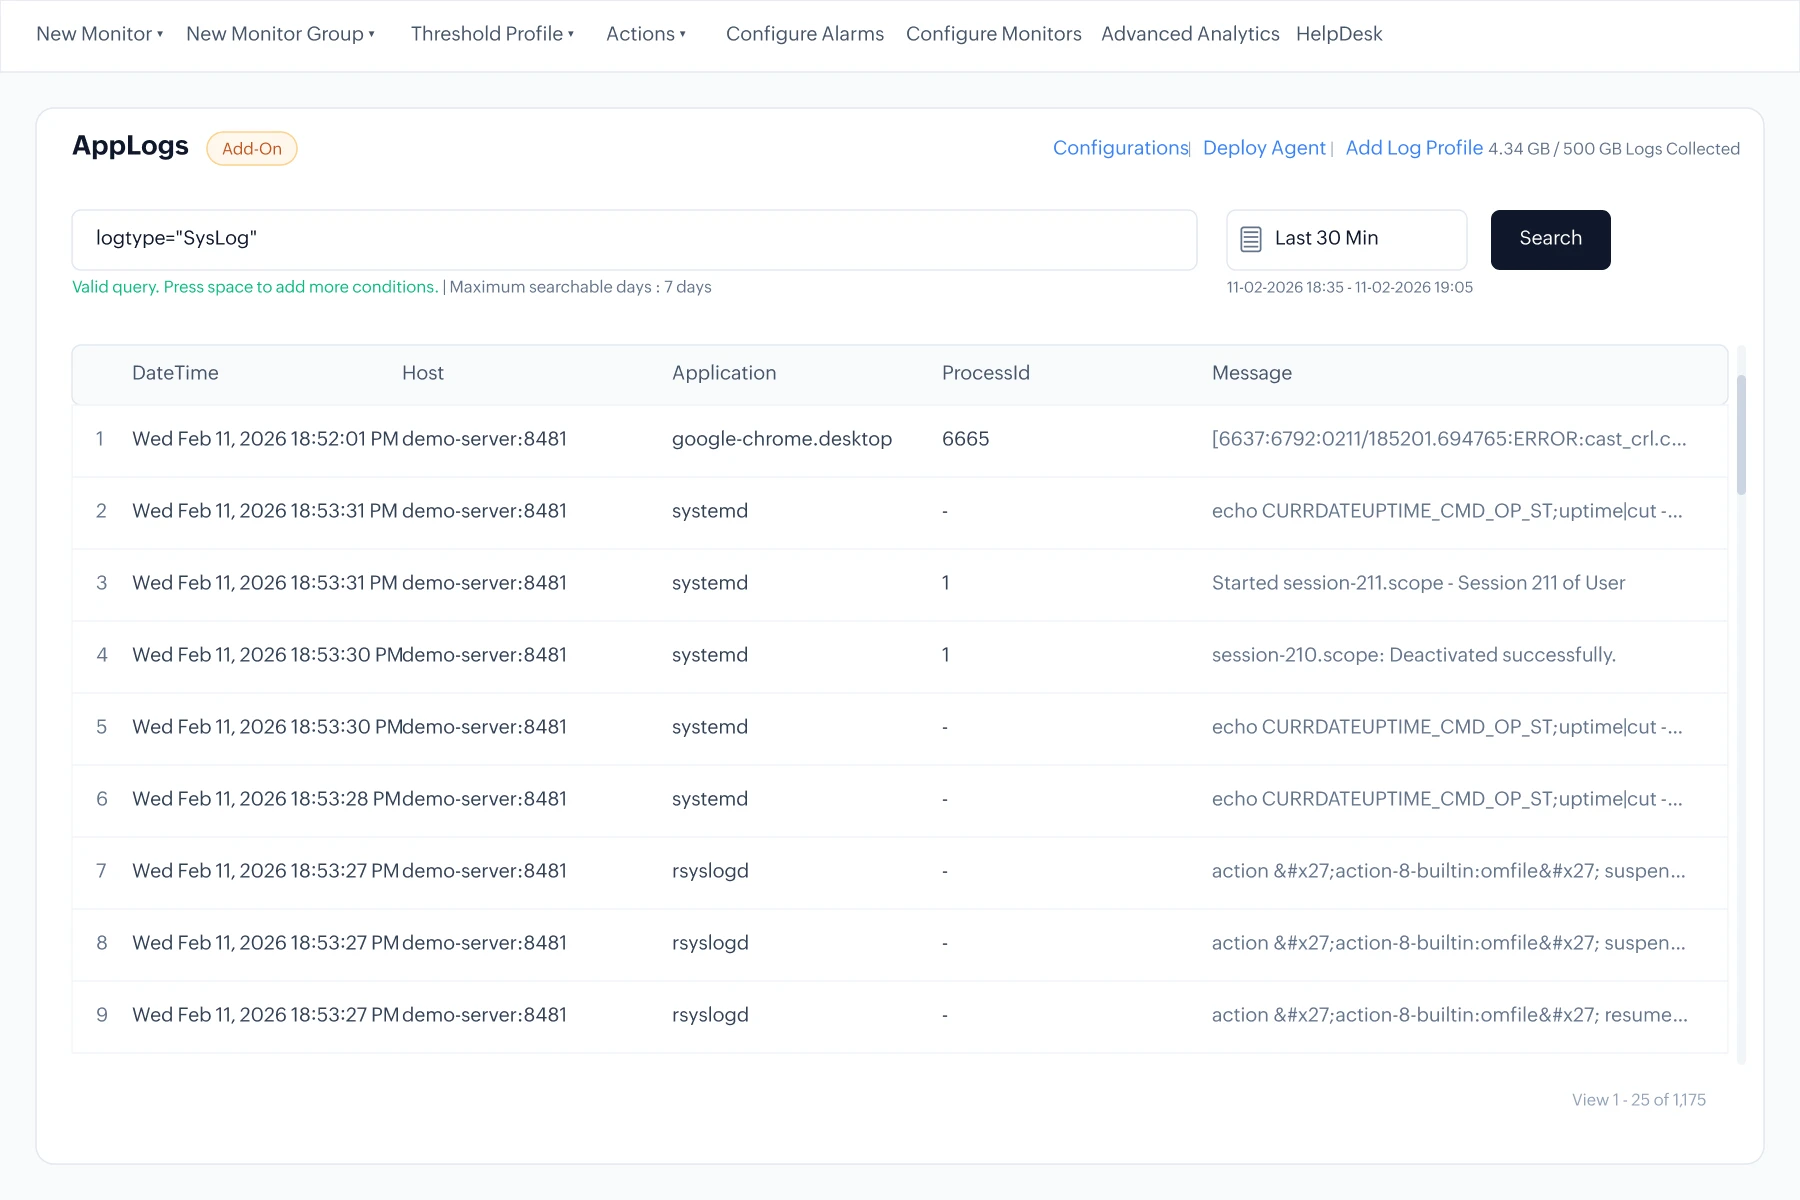
Attain in-depth insights into critical metrics derived from on-premise, cloud, network, and NoSQL databases. Monitor the status and availability of databases in a dynamic, real-time manner. Detect queries that impact database performance negatively, optimizing them to enhance the overall efficiency of applications. Effectively oversee and manage database backup operations to ensure a seamless database experience. Additionally, the APM module offers the convenience of directly integrating databases identified by OpManager Plus, eliminating the necessity for repetitive discovery processes within the APM module.

Key Metrics

  • Jobs
  • Sessions
  • Service Availability
  • Database utilization
  • Resource consuming queries / process
  • Backup / replications

Wide-ranging database monitoring capabilities

Full visibility into application servers, web servers and services.

OpManager Plus' Applications Manager module delivers unmatched depth in terms of visibility into the functioning of essential application servers and web servers/services. Achieve a proactive approach by consistently monitoring key performance metrics and promptly detecting issues such as memory depletion errors and heightened disk utilization, mitigating the risk of substantial problems like service interruptions.

Key Metrics

  • Application Response time
  • Cluster Availability
  • Connection Pool Performance
  • Connection statics
  • JVM Performance
  • Thread pool metrics

Full visibility into application servers, web servers and services

Cloud Monitoring

Thoroughly monitor all your application components, including application servers, databases, servers, VMware architecture, and web transactions. Proactively monitor the health and performance of your critical cloud infrastructure, as well as the applications hosted on the cloud. Track the health and performance of Amazon EC2 and RDS instances, 24/7.

Key Metrics

  • Cloud Service Availability
  • Cloud resource usage metrics
    (CPU, Memory & Disk utilization)
  • Requests and Errors
  • Throughput & Latency
  • Average response time
  • Capacity metrics

Supported cloud platforms include

 
 Pricing  Get Quote