Monitoring Proxmox VE in OpManager
OpManager equips you with a comprehensive set of monitoring tools to track the health, availability, and performance of your entire Proxmox Environment — from clusters to individual containers. Once you have discovered your Proxmox Environment, follow the upcoming steps to monitor your Proxmox Environment.
- Accessing Proxmox VE Inventory
- Understanding the Snapshot Pages
- Visualizing Proxmox Data in Maps and Reports.
Accessing Proxmox VE Inventory
All discovered Proxmox VE entities are centrally managed within OpManager's virtualization section.
- Go to the Inventory -> Virtualization -> Proxmox VE tab
- This screen provides a complete list of all your monitored Proxmox Node servers.
- To see a list of your Proxmox Clusters, click on Cluster in the left-hand panel of this page.
Understanding the Snapshot Pages
The snapshot page is your central dashboard for monitoring a specific Proxmox VE entity. You can access it by clicking on any Cluster, Node, VM, or container name in the inventory.
1. Cluster Snapshot Page :
This page provides a high-level overview of an entire Proxmox Cluster. It displays aggregated information about the Cluster's associated Nodes, VMs, Containers, and Storage Pools, including their status and virtual details.
- Rediscover Device : Updates the entire Proxmox inventory for that Cluster, pulling in any new changes.
- Delete Device : Removes the entire Proxmox environment from OpManager, including all its child entities (Nodes, VMs, etc.).

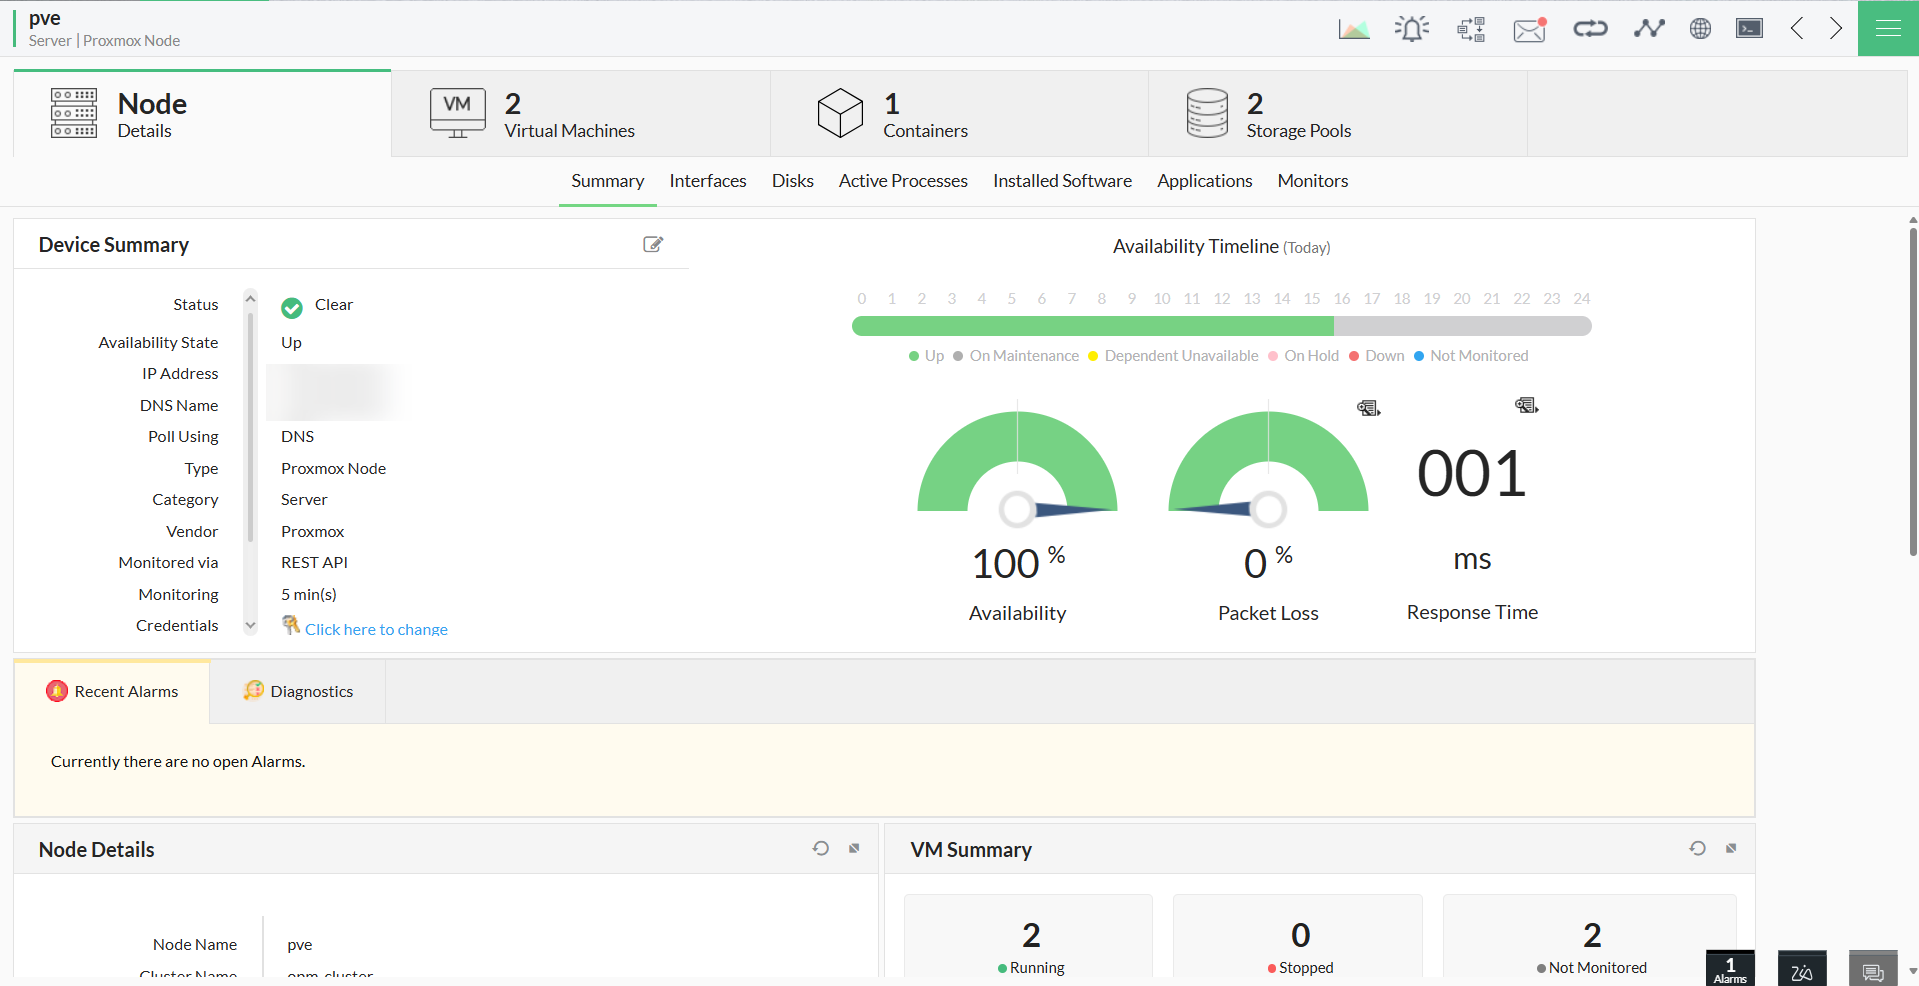
2. Node Snapshot Page :
The Node Snapshot Page provides a detailed monitoring hub for a single Proxmox Node.
- Node Summary & Status :
- The top section provides at-a-glance details like IP Address, Vendor, and CPU Cores.
- Live-status widgets display real-time Availability, Packet Loss, and Response Time
- Custom dials visualize current CPU and Memory Utilization.
- Summary widgets show the status count of all associated VMs and Containers.
- Performance Monitoring (Monitors Tab) :
- View all performance monitors currently associated with the Node.
- Proactively add new, Node-specific monitors to track performance and prevent potential issues.
- Resource Details (VMs, Containers & Storage) :
- Virtual Machines & Containers: View detailed lists of all VMs and containers running on the Node, including their allotted resources. Any inventory changes are automatically updated here. For unmonitored VMs, you can click the Start Monitoring icon and provide an IP address to add them.
- Storage Pools: See a detailed breakdown of the Node's storage pools and their respective storage volumes.
- VM and Container Snapshot Pages :
These pages offer a focused view of an individual Virtual Machine or container. The layout is similar to the Node snapshot page but is tailored to the specific resource.
- Key Details: View the resource's IP Address, CPU details, and virtual information, along with widgets for availability, packet loss, and utilization.
- Alarms & Workflows: View escalated alarms and associate the device with notification profiles or automation workflows.
- Monitors Tab: See all associated performance monitors and add new ones specific to that VM or container's performance.
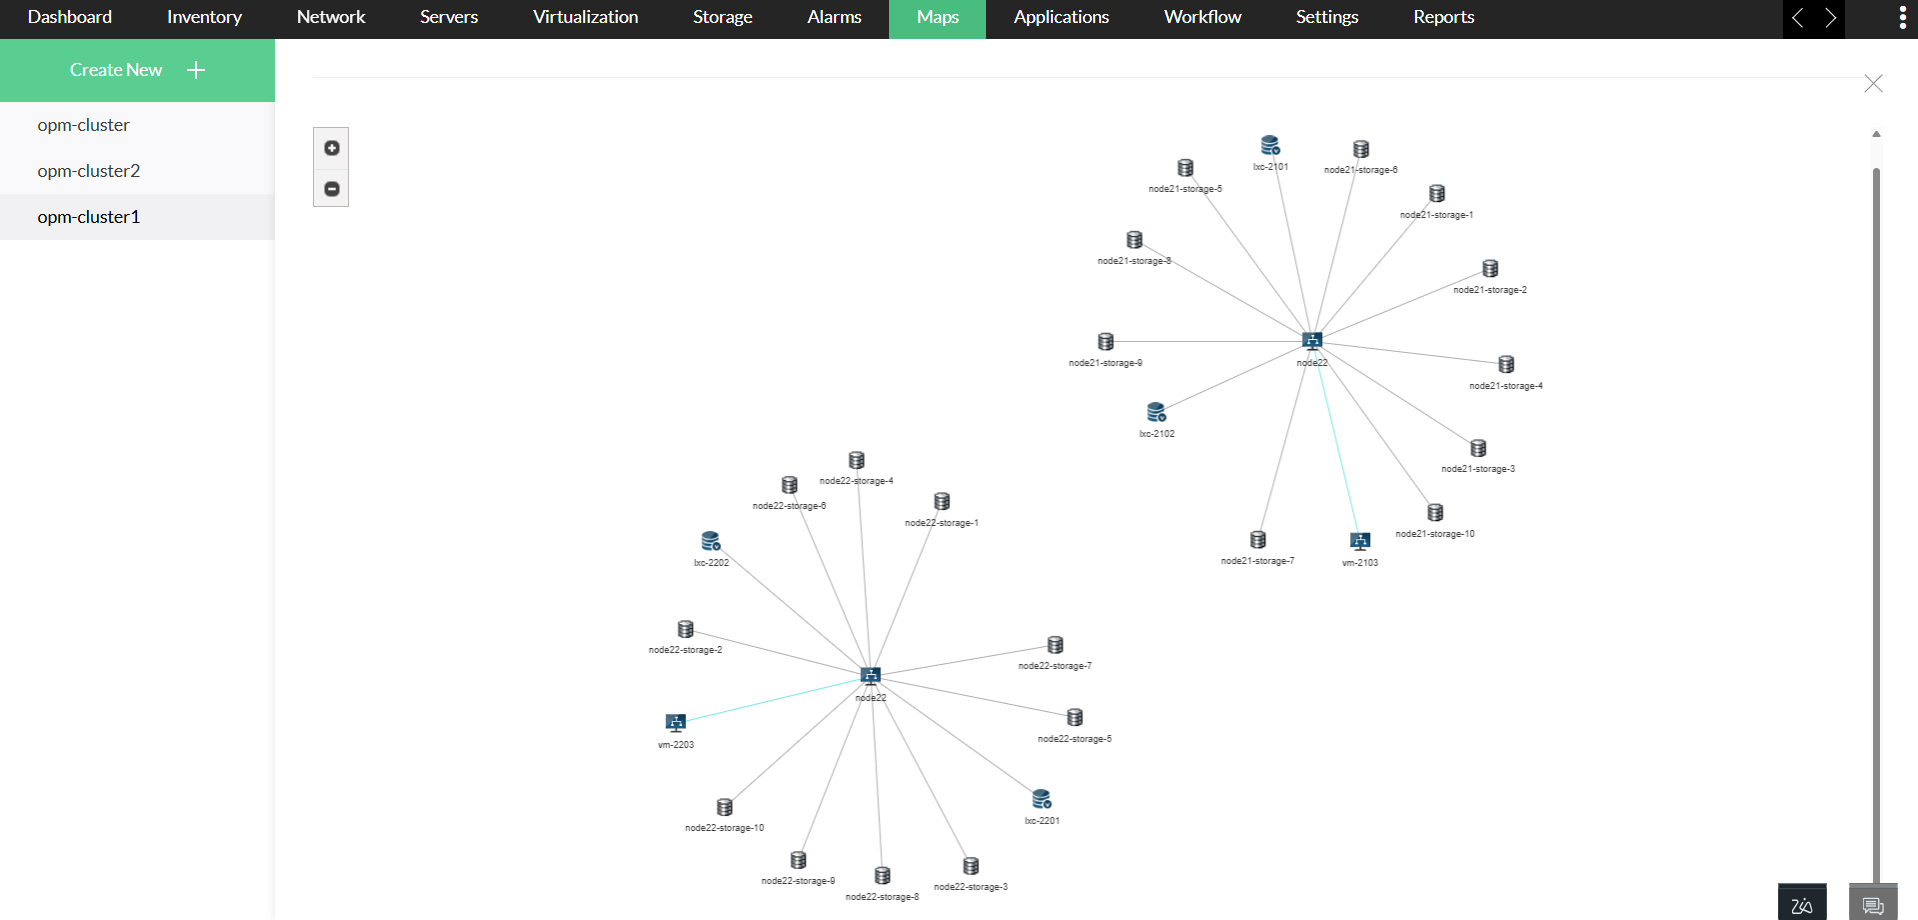
Visualizing Proxmox Data in Maps and Reports
Proxmox data is not isolated. It is fully integrated into OpManager's core features for unified monitoring.
- Maps : In the Maps section, you can visualize your Proxmox Node and its dependencies, showing the clear relationships between the host, its VMs, storage, and containers.
- Advanced Reports : Proxmox-specific properties are available, allowing you to build custom, detailed reports.
- Virtual Server Reports : Proxmox VMs are included in the 'All Virtual Machines' report, letting you analyze them alongside VMs from other vendors.