Managing VMware Alerts
OpManager's dynamic alerting and threshold capabilities are central to a proactive monitoring approach. OpManager seamlessly fetches events from each vCenter/ESX Host, similar to SNMP traps. Currently, a list of important events is supported, and this list is updated every release. Apart from these events, OpManager also monitors threshold for critical performance indicators and raises alerts.
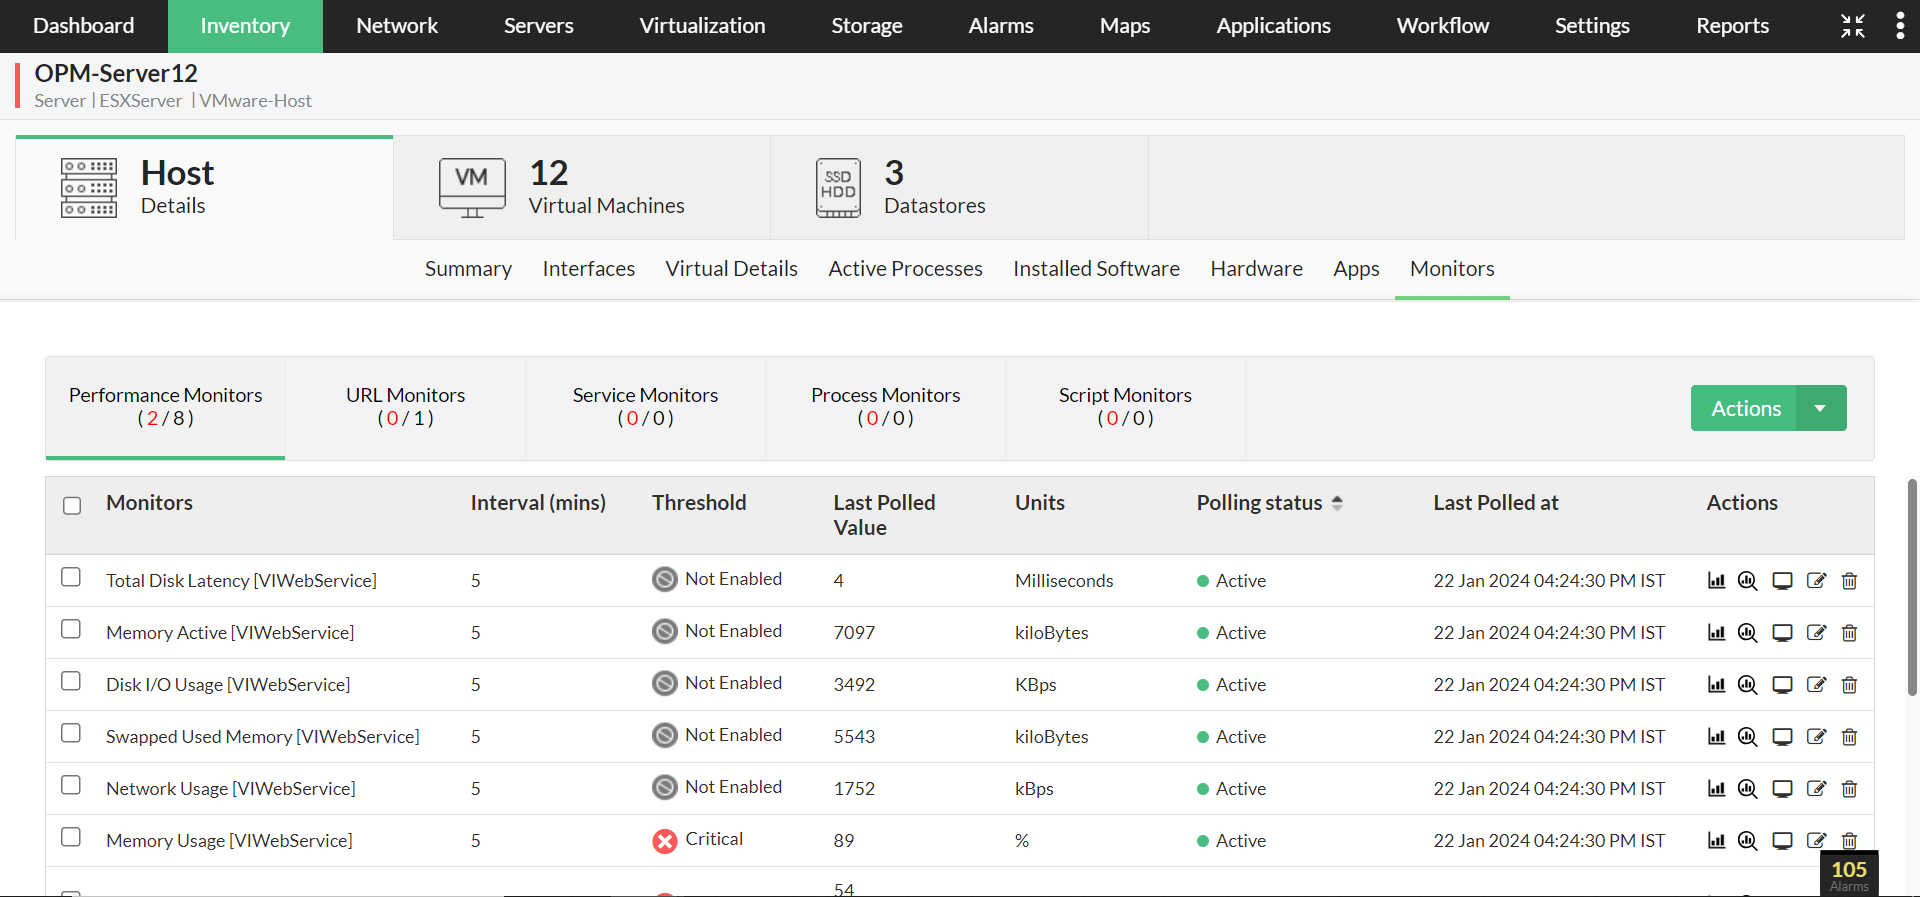
To tailor this system to your requirements, and change the pre-set threshold values for each performance monitor, go to the Monitors section under the snapshot page of the host / VM / Datastore.
To View and Add VMware Monitors
- To access the complete list of available VMware monitors, navigate to Settings → Performance Monitors and apply a filter using the VIWebService protocol.
- To access and add performance monitors for specific VMware components:
- Host-level performance monitors: Host VM Device Snapshot Page → Monitors tab → Actions → Add Performance Monitor → VMware-Host Monitors.
- VM-level performance monitors: VM Device Snapshot Page → Monitors tab → Actions → Add Performance Monitor → VMware-VM Monitors.
- Datastore performance monitors: Datastore Device Snapshot → Monitors tab → Actions → Add Performance Monitor → VMware-Datastore Monitors.
- You can also add performance monitors to VMware devices by clicking Add Monitors under the respective Device Templates. Reapply the templates to ensure the newly added monitors are reflected on the devices: ESXServer for VMware Hosts and VMwareVirtualMachine for VMware VMs.
Table 1: List of few Threshold Monitors for critical performance indicators related to host, datastore & VM's supported by OpManager
| S.No. | Threshold Monitors | Virtual Device Type | Resource |
|---|---|---|---|
| 1. | Host Network Received Packets | Host | Network |
| 2. | Host Network Transmitted Packets | Host | Network |
| 3. | Host Network Usage (avg) | Host | Network |
| 4. | Host CPU Utilization (avg) | Host | CPU |
| 5. | Host Memory Utilization (avg) | Host | Memory |
| 6. | Host Disk Read Latency | Host | Disk |
| 7. | Host Disk Write Latency | Host | Disk |
| 8. | Datastore Freespace | Host | Network |
| 9. | VirtualMachine Network Packets Received | VM | Network |
| 10. | VirtualMachine Network Packets Transmitted | VM | Network |
| 11. | VirtualMachine Network Usage (avg) | VM | Network |
| 12. | VirtualMachine CPU Utilization (avg) | VM | CPU |
| 13. | VirtualMachine Memory Usage (avg) | VM | Memory |
VMware Event Alerts
OpManager allows you to monitor VMware events raised in your environment from a single console. All VMware events associated with the device are listed under the VMware Events section on the Device Snapshot page of the respective vCenter or ESX host. From this page, the severity of event alarms can be updated, and alarms that are no longer required can be removed at any time.
- To access VMware Events for your device:
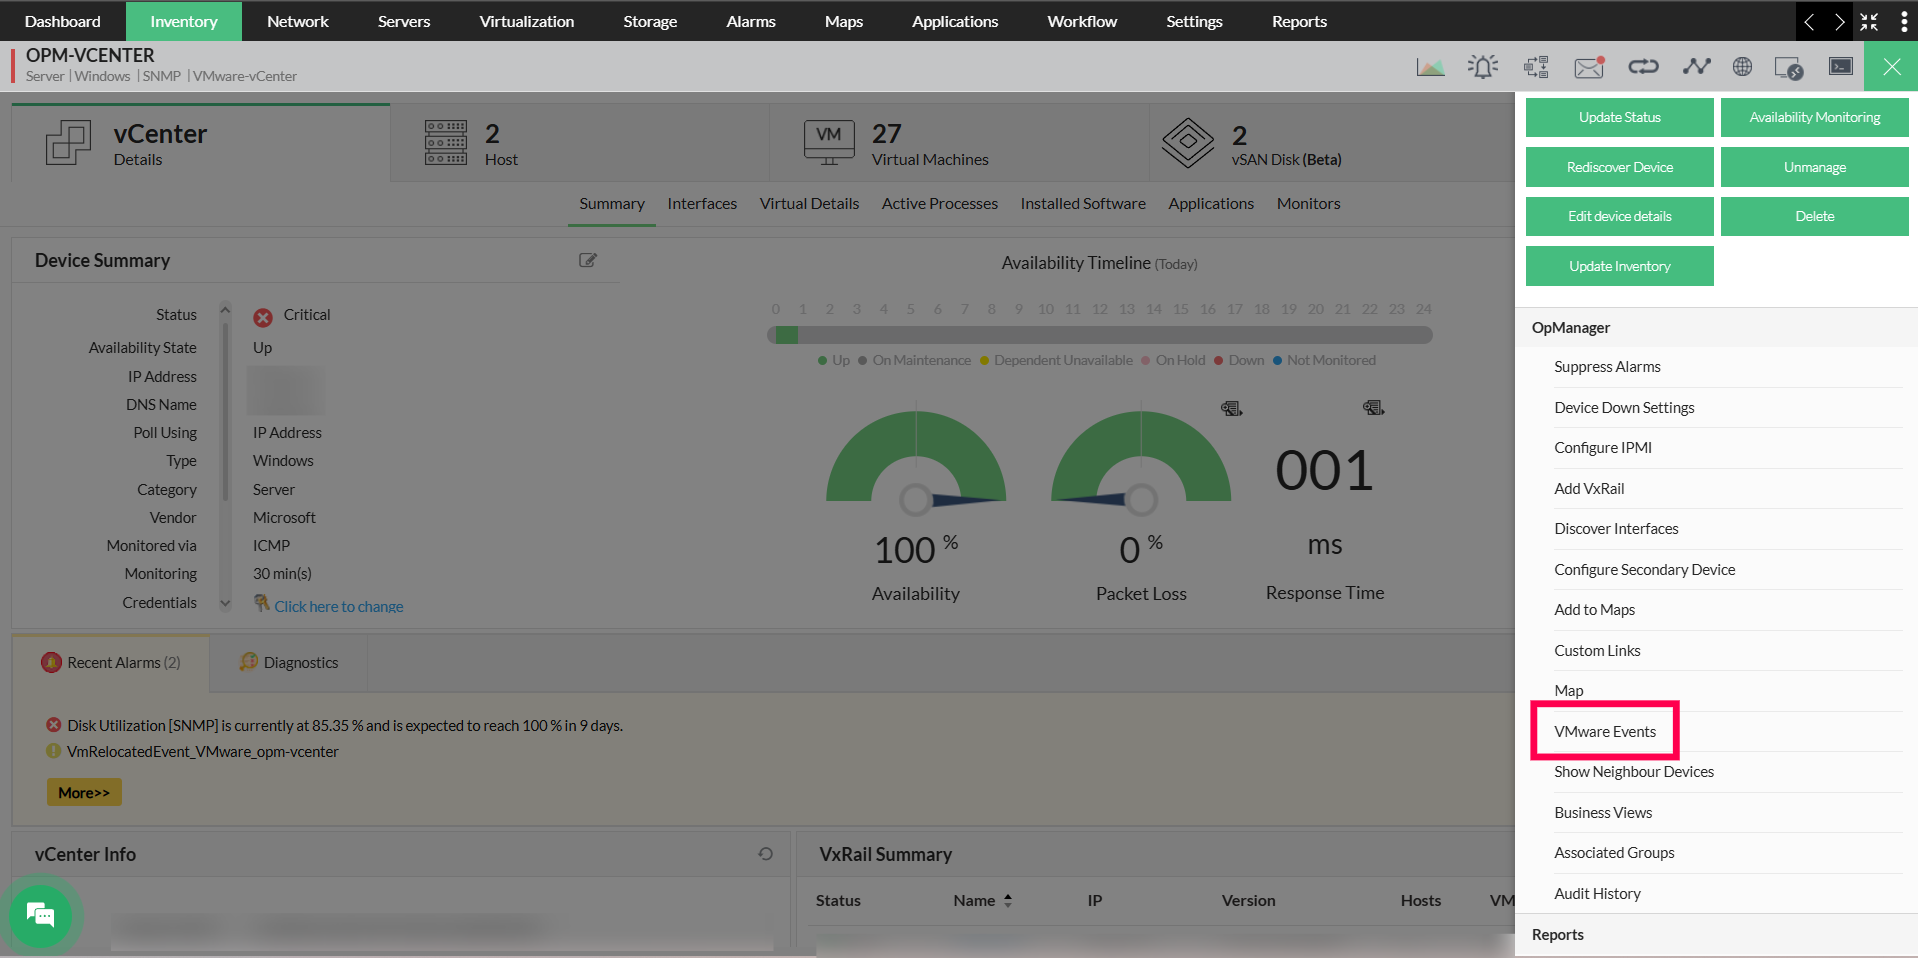
- For vCenter-based discovery, navigate to vCenter Device Snapshot → hamburger icon (top-right) → VMware Events.
- For ESX-based discovery, navigate to ESX Device Snapshot → hamburger icon (top-right) → VMware Events.
- To add and view the complete list of supported ESX host/vCenter events, navigate to Settings → Monitoring → VMware Events. Here, under the Actions column, severities can be updated using the edit icon, and events that are no longer required can be deleted using the delete option.
- Updating Event Severity: From the VMware Events list, locate the event whose alarm severity you wish to modify and use the edit option to update to the appropriate severity level. The severity of an associated event can be updated from Device Snapshot page. The updated severity will be applied to all subsequent alarms triggered by that event.
- Removing VMware Events: To delete an event, locate the relevant event in the VMware Events list and remove it. To remove multiple events at once, select the desired events and use the bulk delete option. Once deleted, OpManager will no longer trigger alarms for those events.
Bulk Association of VMware Events
You can associate multiple VMware events with one or more vCenter servers or ESX hosts in a single flow:
- Navigate to Settings → Monitors → VMware Events.
- Use the checkboxes to select the required events.
- Click Associate (top-right corner) and select the required vCenter(s)/Host(s). Click Save
The selected VMware events will be listed in the respective Device Snapshot → VMware Events section.
Table 2: VCenter and ESX hosts' Events supported by OpManager
| S.No. | Events | Virtual Device Type | Severity |
|---|---|---|---|
| 1. | VmFailedToPowerOffEvent | VM | Critical |
| 2. | VmPoweredOffEvent | VM | Attention |
| 3. | VmPowerOffOnIsolationEvent | VM | Clear |
| 4. | VmFailedToPowerOnEvent | VM | Critical |
| 5. | VmPoweredOnEvent | VM | Attention |
| 6. | VmFailedToSuspendEvent | VM | Critical |
| 7. | VmSuspendedEvent | VM | Attention |
| 8. | VmFailedToRebootGuestEvent | VM | Critical |
| 9. | VmGuestRebootEvent | VM | Clear |
| 10. | VmFailoverFailed | VM | Trouble |
| 11. | VmPrimaryFailoverEvent | VM | Critical |
| 12. | VmUpgradeFailedEvent | VM | Critical |
| 13. | VmUpgradeCompleteEvent | VM | Clear |
| 14. | VmDisconnectedEvent | VM | Attention |
| 15. | VmConnectedEvent | VM | Attention |
| 16. | VmDiskFailedEvent | VM | Critical |
| 17. | VmRelocatedEvent | VM | Attention |
| 18. | VmRelocateFailedEvent | VM | Critical |
Physical NIC and Host Bus Adapter Alerts
OpManager can also raise alerts based on the status of Physical NICs and Host Bus Adapters (HBAs) on your VMware parent devices. These alerts can be enabled during discovery of that parent device or from the Update Inventory page, by enabling the "Raise alerts for Physical NIC & Host Bus Adapter" option. Once enabled, you can also suppress alarms for physical NICs and storage adapters that do not require monitoring.
| S.No | OpManager status message | Corresponding NIC status |
|---|---|---|
| 1 | Clear | Connected |
| 2 | Critical | Disconnected |
Host Bus Adapter status messages:
| S.No | OpManager status message | Corresponding HBA status |
|---|---|---|
| 1 | Clear | Online |
| 2 | Attention | Unbound (or) Offline |
| 3 | Trouble | Fault |
To gain in-depth insights into OpManager's VMware monitoring practices, explore the following help documents.