
Trusted by leading enterprises across the globe
Get in-depth insights into your database performance — Instantly
Discover real-time, unified visibility into database performance across all engines—relational, NoSQL, and cloud-native—with deep insights into queries, locks, replication, and resource usage. Our observability platform delivers intelligent baselines and anomaly detection to help DBAs diagnose issues faster, identify bottlenecks, and optimize workloads without guesswork. Stop reacting to outages—start proactively ensuring predictable, high-performing database operations.
Understand & improve query behavior instantly
- Pinpoint the exact queries slowing down your system and prioritize them by execution time, wait events, and resource consumption.
- Catch performance regressions the moment they appear and roll back or tune before they escalate.
- Break down execution plans visually to uncover inefficient operations and apply targeted optimizations.
- Spot missing, unused, or bloated indexes and fix them to eliminate hidden latencies.
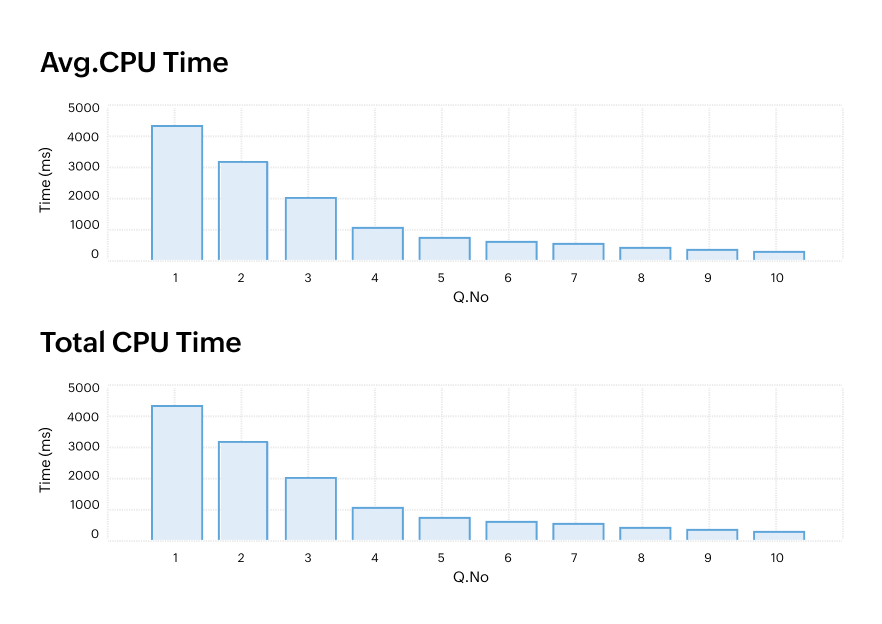
- Trace how query patterns affect CPU, disk, memory, and I/O so you can reshape workloads intelligently.
You don't just identify queries — you understand and take decisive action to optimize them.
Spot bottlenecks 5x faster
- Identify resource pressure early by tracking CPU, memory, buffer pools, and cache behavior in real time.
- Catch connection storms and spiking sessions before they exhaust your database engine.
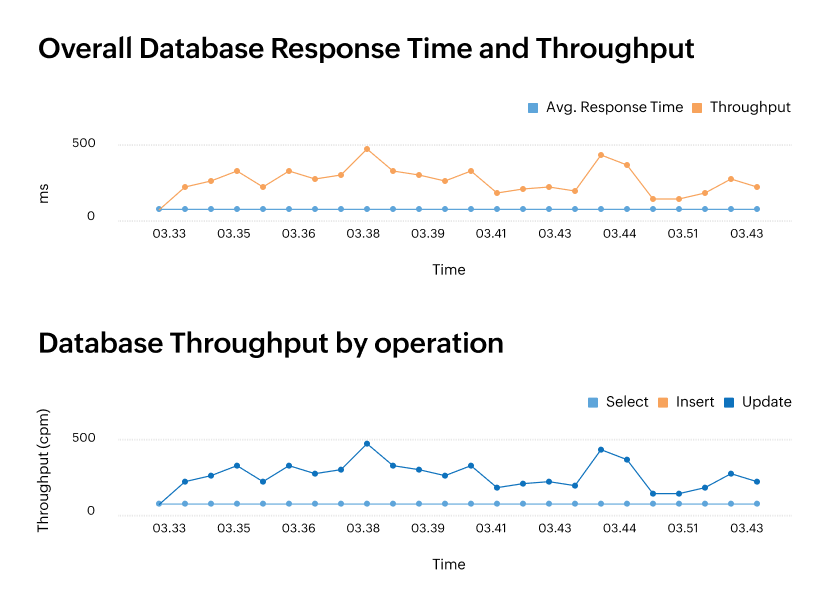
- Expose storage-level friction by tracking disk latency, IOPS, throughput, and read/write imbalance.
- See when tempdb/undo/redo usage is spiraling and intervene before it chokes transactions.
- Detect thread pool saturation and contention and eliminate the exact cause of bottlenecks.
Turn early signals into proactive fixes, not post-incident root cause investigations.
Monitor locks, blocks & deadlocks in real time
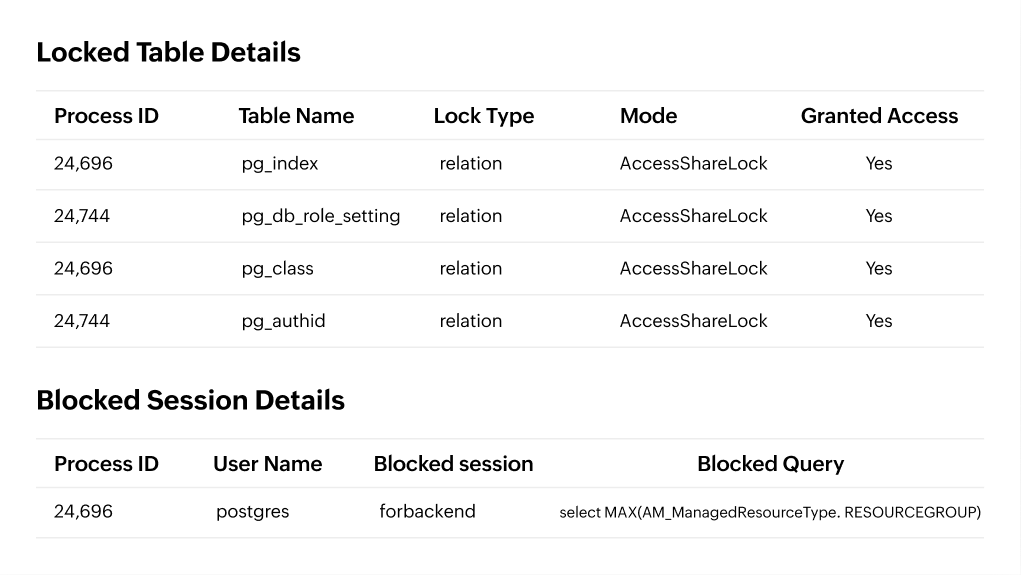
- Visualize every locking chain and immediately identify which session is holding up the queue.
- Stop blocking sessions before they snowball into application-wide slowdowns.
- Capture deadlocks with complete context and fix the exact queries, objects, or patterns causing them.
- Break down wait times to understand why sessions are stuck and how to restore smooth concurrency.
Keep transactions flowing by removing contention at the source.
Track replication, clustering & high availability health
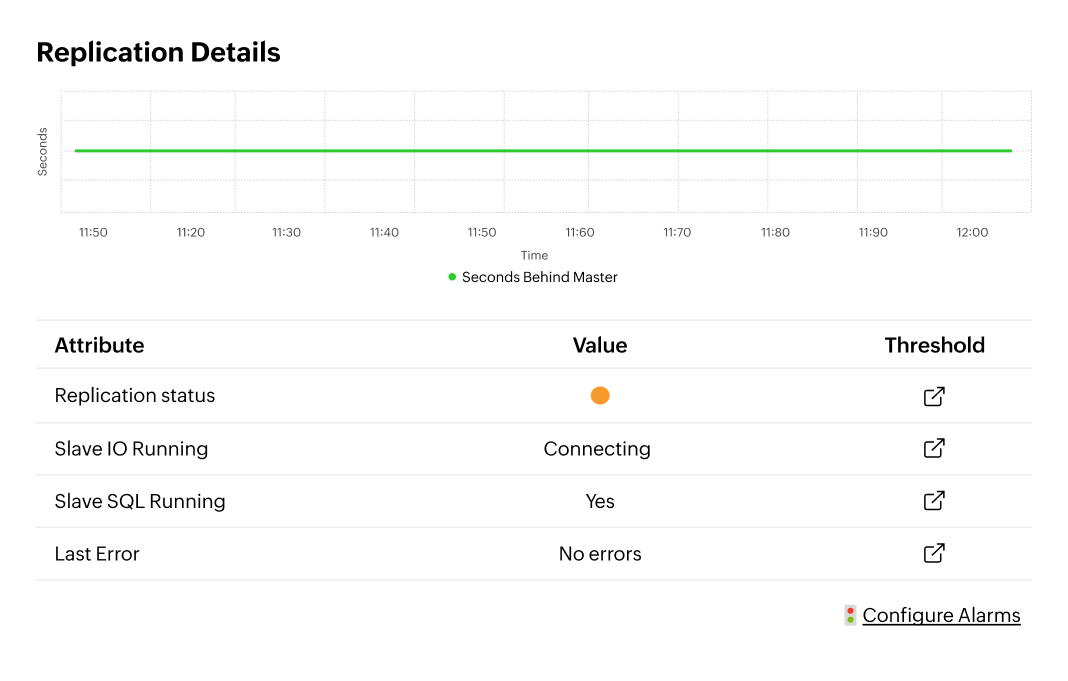
- Detect replication lag instantly and act before it threatens data consistency.
- Monitor every node's health and sync status to preempt failover surprises.
- Spot cluster-wide performance drift and rebalance before the impact spreads.
- Identify primary/secondary behavior changes and correct workload skew or misconfiguration.
Ensure your distributed databases stay fast, synchronized, and failover-ready at all times.
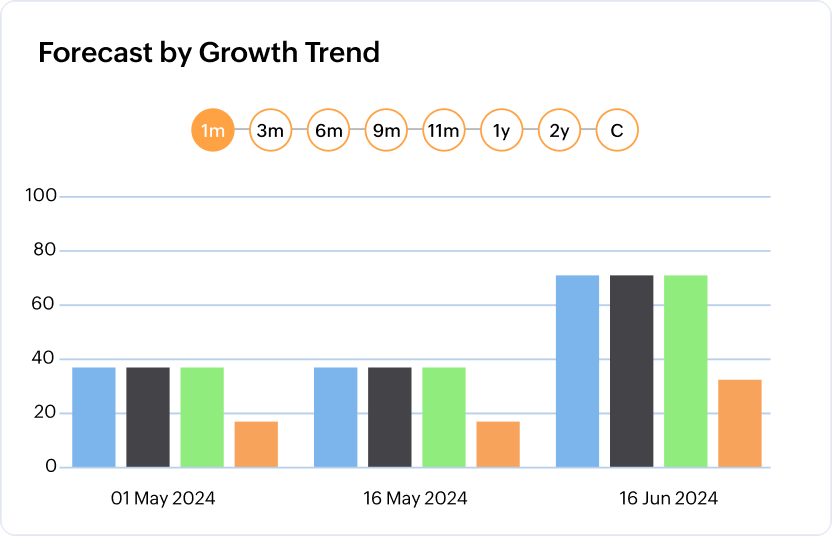
Forecast capacity to prevent resource exhaustion
- Predict when CPU, memory, or storage will run out using trend analysis and growth modeling.
- Anticipate connection pool saturation and increase limits or rebalance workloads proactively.
- Track table and index growth to prevent storage bloat from causing outages.
- Spot long-term usage patterns and adjust capacity before workloads break through thresholds.
Plan ahead with confidence and eliminate surprises before they become emergencies.
One observability layer, unlimited database types
Monitor on-premises, virtualized, and cloud databases seamlessly. Optimized for diverse database ecosystems:
- Relational
databases - NoSQL
databases - In-memory
databases - Key-value
stores - Cloud-native
databases
Relational databases
In-memory databases
Key-value Stores
Cloud databases
Why teams choose Applications Manager for database observability?
For DBAs
- Shorter MTTR
- Fewer firefights
- Clear query behavior insights
- Better planning for growth
For SREs
- Faster RCA
- Fewer incidents
- Healthy system-wide performance
For Application teams
- Improved app responsiveness
- Better collaboration with DBAs
For Leadership
- Higher uptime
- Predictable performance
- Better cost efficiency
Ready to transform your database operations?
Unlock complete visibility, eliminate blind spots, and deliver peak database performance consistently — every single day. Experience the clarity your databases have been missing like never before.
