Windows Service Performance Monitoring
Monitor the performance of your Windows services developed in the .NET platform with the APM Insight .NET agent from Applications Manager. Analyze the method calls of your Windows services and enhance their performance.
How it works
In general, .NET web applications hosted in IIS servers will have contextual information instrumented with their HTTP requests. These requests are also reported as web transactions. Windows services, on the other hand, don't have HTTP requests, meaning that default methods like OnStart, Run, OnPause, OnContinue, OnStop, OnSessionChange, OnShutdown, and other similar service methods can be monitored using Custom Instrumentation Manager.
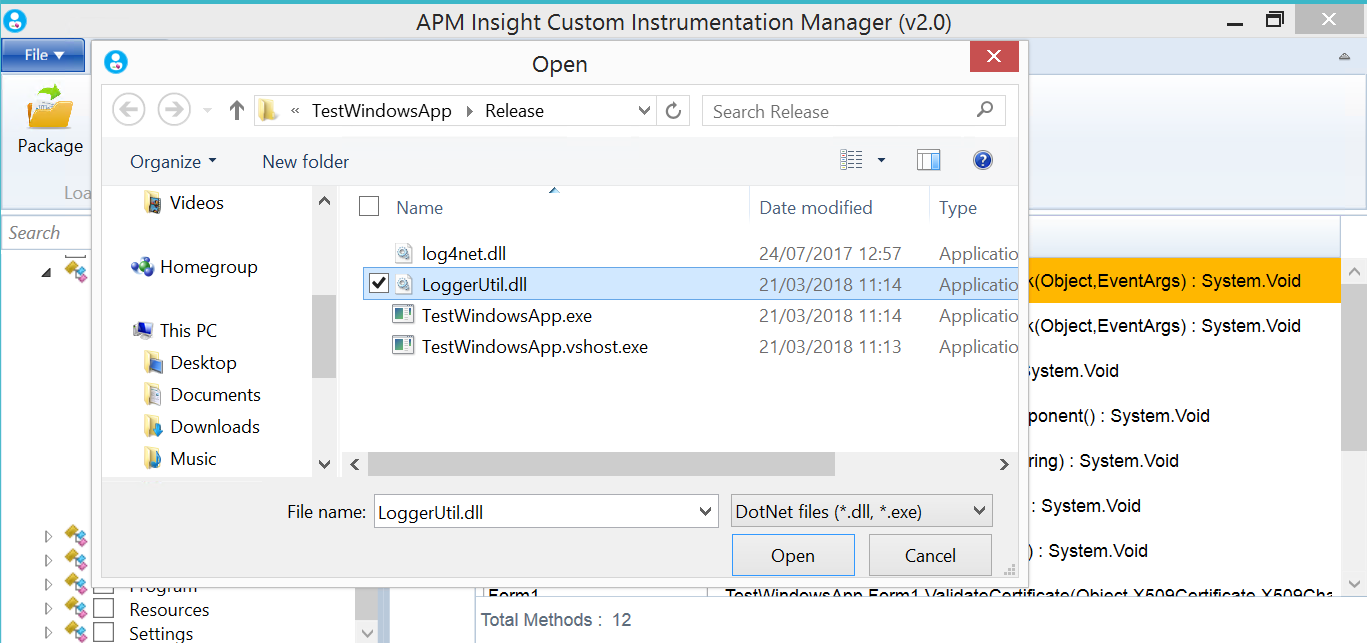
By adding methods to Custom Instrumentation Manager, you can monitor the performance of exceptions, database calls, web service calls, and third-party packages like loggers, caches, and NoSQL calls. Use Custom Instrumentation Manager to add more methods from service-dependent dynamic-link library (DLL) files, allowing you to view the performance of every individual transaction.
Configuration steps
- Log in to your Applications Manager account, then go to APM Insight tab and download the .NET agent. For details, refer to these installation instructions.
- In the Edit configuration dialog box—which appears at the end of agent installation—select the Enable windows service monitoring checkbox under the Windows services tab.
- Click Save.
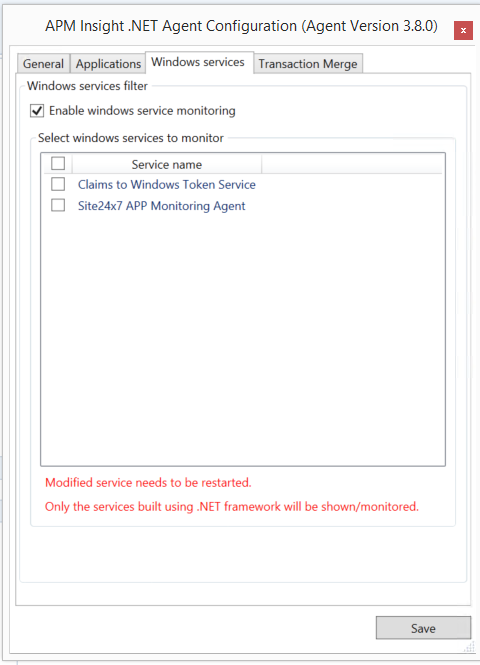
- Windows services developed in .NET will populate a list. Select the services that you want to monitor and click Save.
- Upon saving, the executable file for corresponding services will be added to Custom Instrumentation Manager.
- Use the services.msc console to restart each of the Windows services from this list.
- You can now view the monitors you added from the Applications Manager web client and the basic methods of these services will now be tracked.
- If you want to monitor any dependent DLL methods for particular service processes, just add them using Custom Instrumentation Manager.
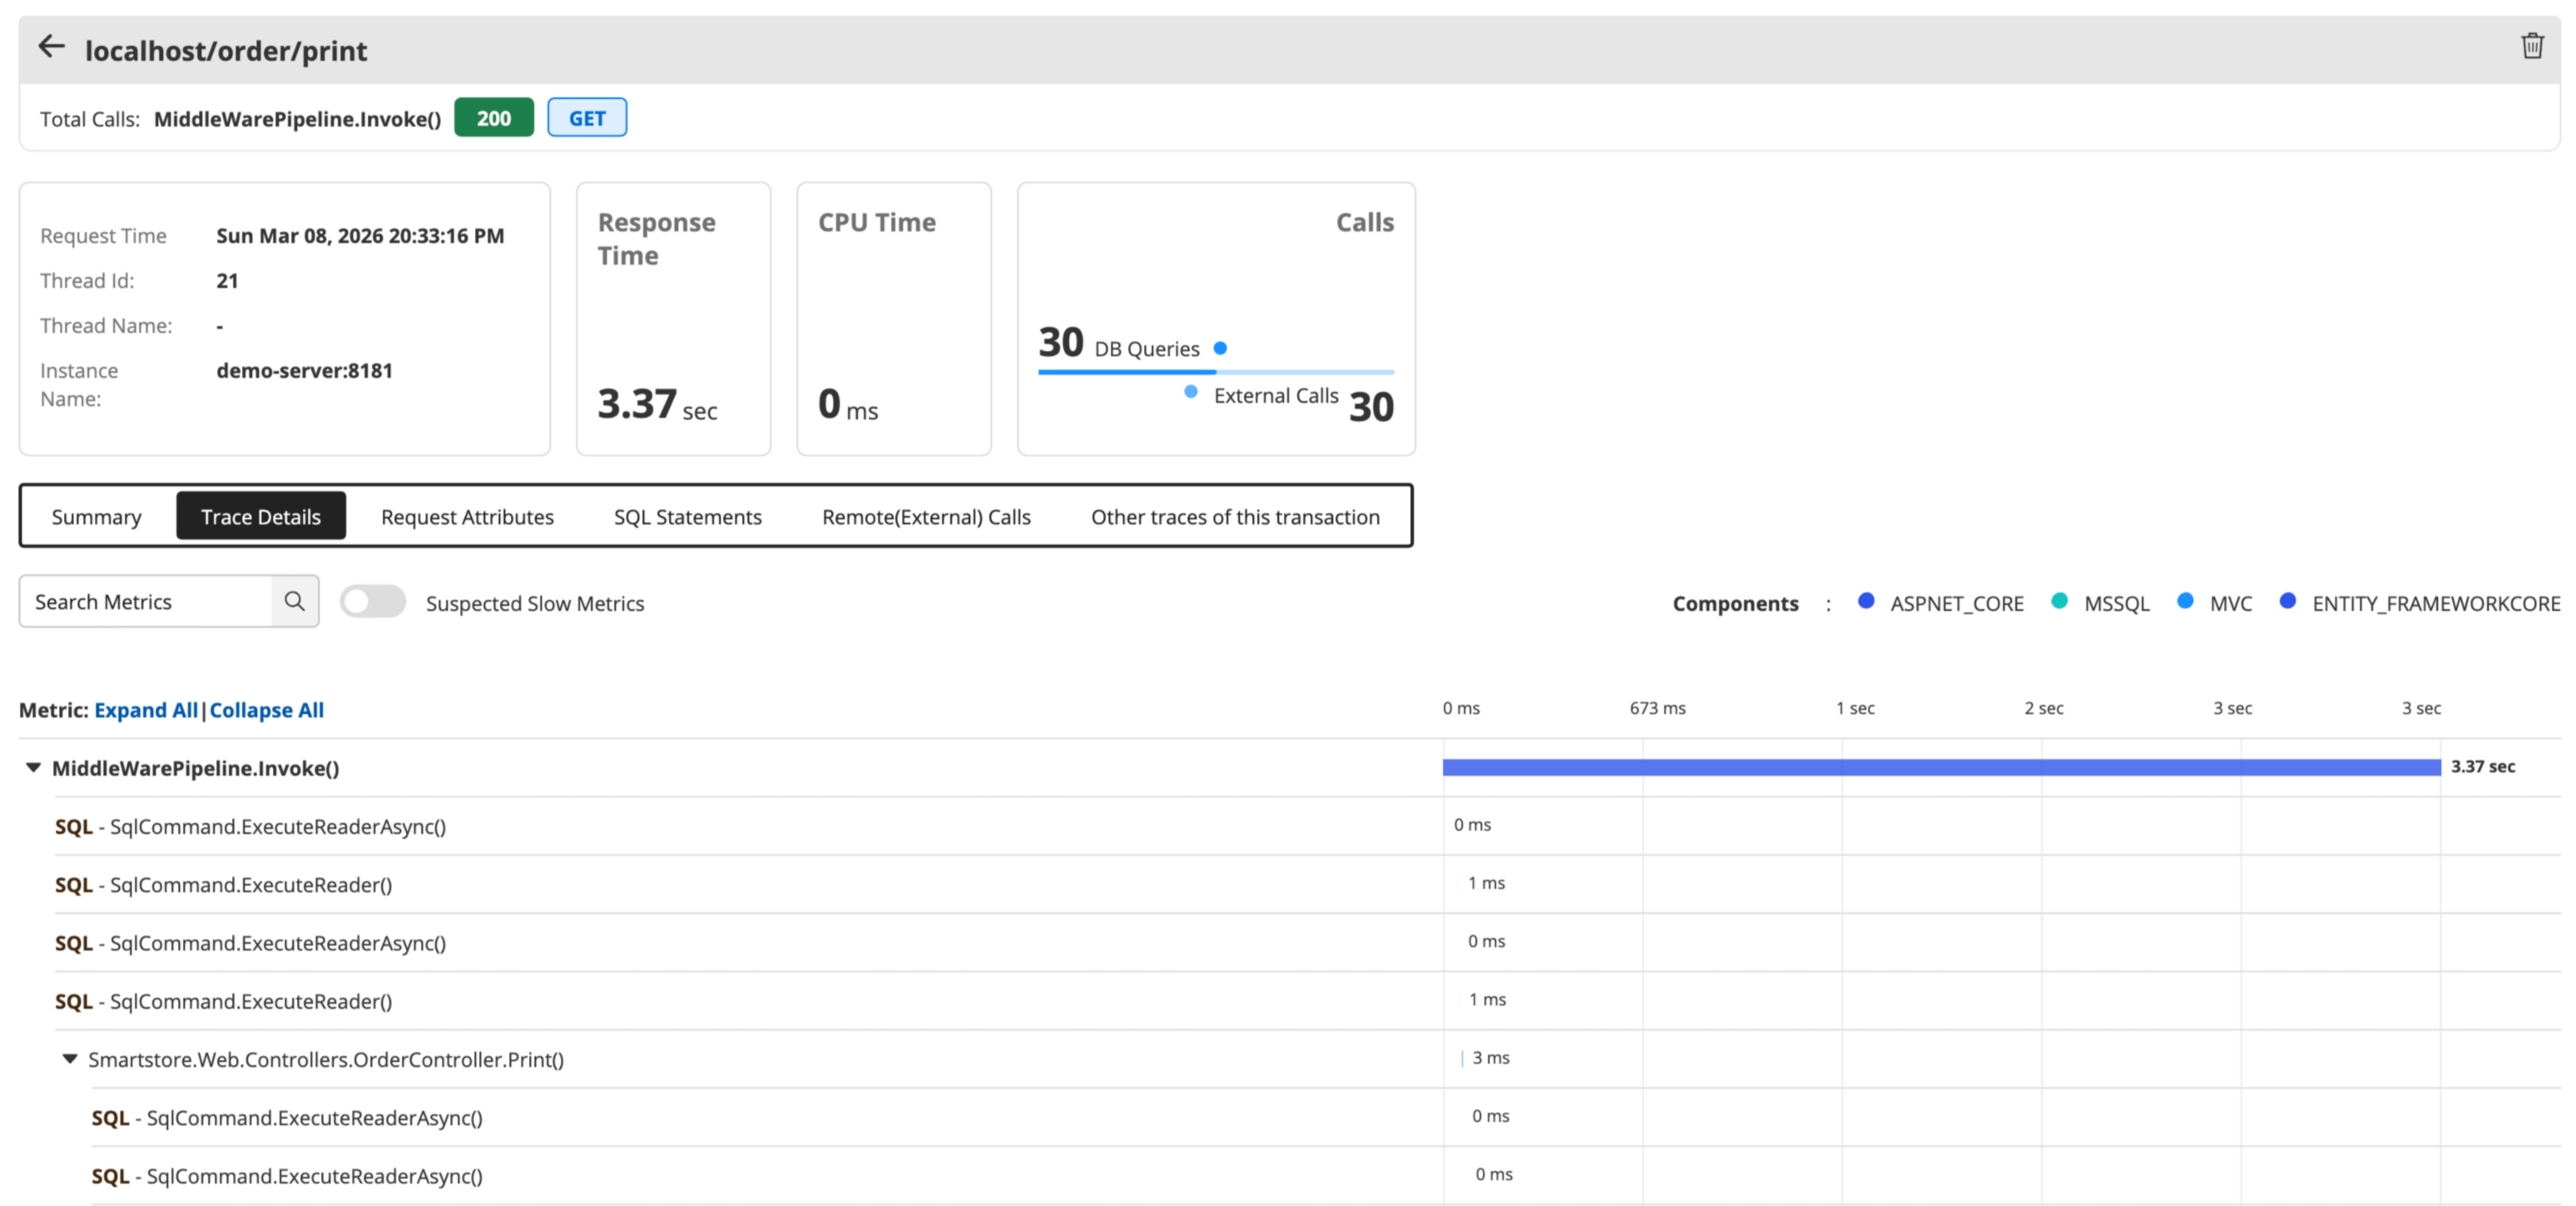
View the performance of each your services' executed methods under the Traces tab.
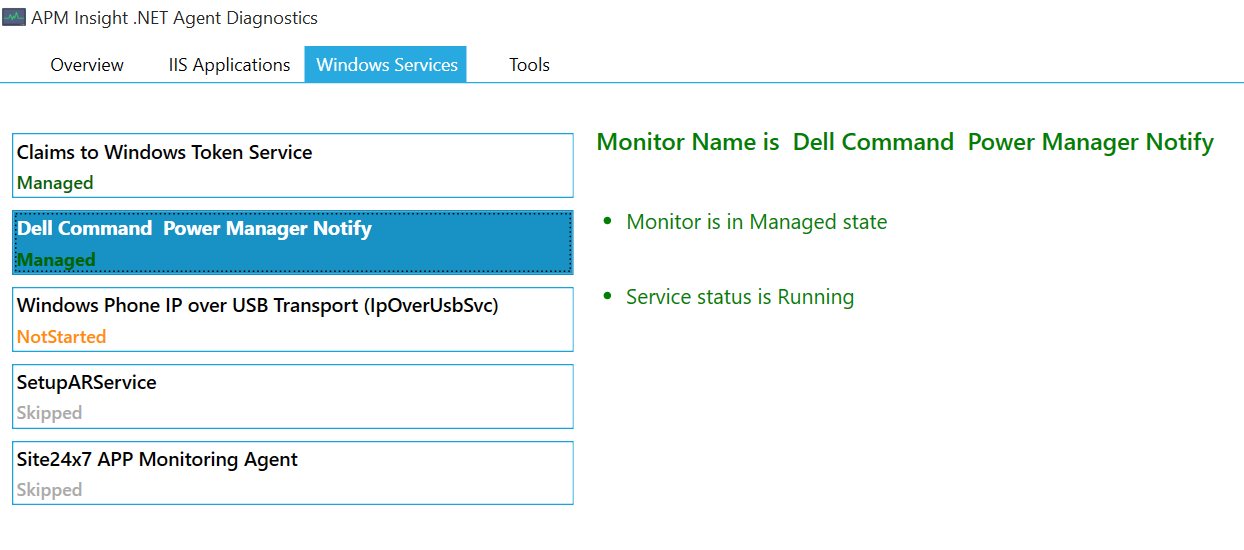
- View the status of your Windows service monitors using the Health Monitor. This tool also provides the status of monitors and Windows services.
Note:
- Whenever you make any changes to Windows services in Edit configurations, you must manually restart the modified services.
- Add additional service-dependent DLLs to Custom Instrumentation Manager to track the performance of methods.
- Only services developed in .NET will be shown in Edit configurations.
