Practical use cases & troubleshooting with APM Insight
Table of contents
- How to use this guide
- Real-world scenario 1: "My application is slow"
- Real-world scenario 2: Diagnosing slow or failing transactions
- Real-world scenario 3: When queries kill performance
- Real-world scenario 4: Diagnosing external bottlenecks
- Alerts and proactive monitoring
- Using Milestones to track performance changes
- When to escalate or optimize further
- Common troubleshooting mistakes to avoid
- In this series
How to use this guide
This document is designed to help you troubleshoot real-world application performance issues using APM Insight.
Instead of listing features, each section is built around common symptoms you might encounter in production—slow pages, failing transactions, database delays, or external service bottlenecks—and walks you through how to diagnose and resolve them using APM Insight.
When to use each section
| Your Situation | Start Here |
|---|---|
| Users report slowness or poor UX | Start with Scenario 1 |
| A critical business transaction is slow or failing | Go to Scenario 2 |
| Database performance seems to be the bottleneck | See Scenario 3 |
| Issues appear only when calling external services | Jump to Scenario 4 |
| You want to prevent issues before users complain | Review Alerts and Proactive Monitoring |
Real-world scenario 1: "My application is slow"
Symptoms
- Pages are loading slowly
- API response times are higher than usual
- Users report degraded experiences or timeouts
- No obvious errors, but the application "feels slow."
How APM Insight helps
APM Insight gives you an immediate, high-level view of application health using:
- Apdex scores to measure user satisfaction
- Response time trends to detect performance degradation
- Component-level breakdowns to isolate where time is being spent
Step-by-step diagnosis
Step 1: Assess overall application health
Start with the Overview page of the APM Insight monitor.
Check the Apdex score:
- A sudden drop indicates user impact.
- A consistently low score points to systemic performance issues.
Step 2: Identify response time spikes
Look for spikes in response time graphs.
- Correlate spikes with traffic patterns or deployment times.
- Focus on periods where response time increased without a traffic surge.
Step 3: Use "Response time broken by components"
This view breaks down each request into three categories, showing where time is actually spent:
| Component | What it means |
|---|---|
| App code | Time spent executing your application logic |
| DB components | Time spent on database queries |
| Other components | Time spent on external services and APIs |
What to look for:
- App code spike → Inefficient code or slow method execution
- DB component spike → Slow or expensive database queries
- Other components spike → External services or APIs causing delays
At this stage, you'll know where the problem lies—even before drilling deeper.
When Server Metrics Look Good But Users Still Complain
If "Response Time Broken by Components" shows everything is fast (App Code ✓, DB Components ✓, Other Components ✓) but users report slowness, the issue may be client-side:
- Browser rendering delays
- JavaScript execution time
- Slow network
- Large assets
Next step: Check the RUM Analytics tab (if RUM is integrated) to see:
- Page load times in user browsers
- JavaScript errors
- Performance by device/browser/location
Learn about RUM integration in Document 1.
Real-world scenario 2: Diagnosing slow or failing transactions
Example scenario
A critical transaction like Login, Checkout, or Payment Processing is:
- Taking too long to complete
- Failing intermittently
- Timing out during peak usage
How APM Insight helps
APM Insight lets you:
- Identify the slowest transactions
- Analyze transaction behavior over time
- Drill down into method-level execution traces
Step-by-step diagnosis
Step 1: Identify top slow transactions
- Navigate to the Transactions tab
- Sort transactions by response time
Identify transactions with:
- High average response time
- Frequent spikes
- Low Apdex contribution
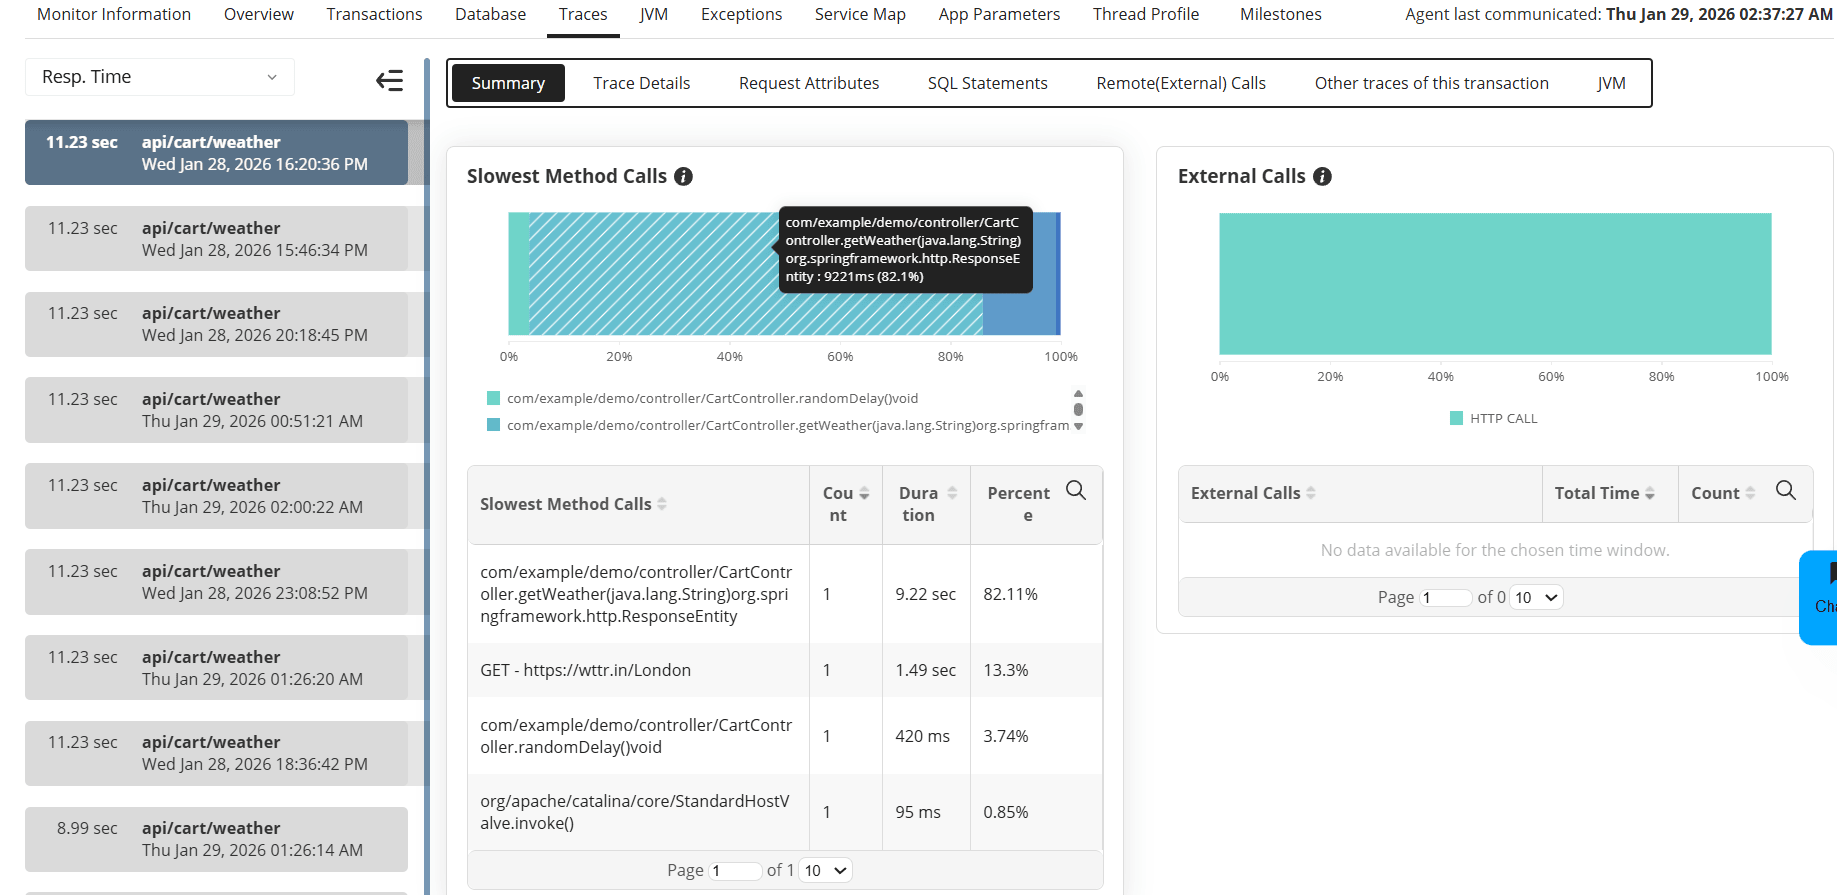
Step 2: Analyze transaction traces
Select a slow transaction and open Available Traces:
- Overall Summary shows where time is spent
- Stack Trace reveals slow or repeated method calls
- Executed Queries highlights slow database operations
Step 3: Handle failed transactions
If the transaction fails:
- Review the error or exception details
- Use the stack trace to identify:
- Unhandled exceptions
- Timeout issues
- Dependency failures
These insights can be directly shared with development teams for faster resolution.
Real-world scenario 3: When queries kill performance
Symptoms
- Application slows down under load
- DB response time dominates overall transaction time
- Performance issues worsen with increased traffic
How APM Insight helps
APM Insight correlates database performance directly with application transactions, helping you:
- Identify expensive queries
- Understand query frequency vs execution time
- See how queries impact end-user experience
Step-by-step diagnosis
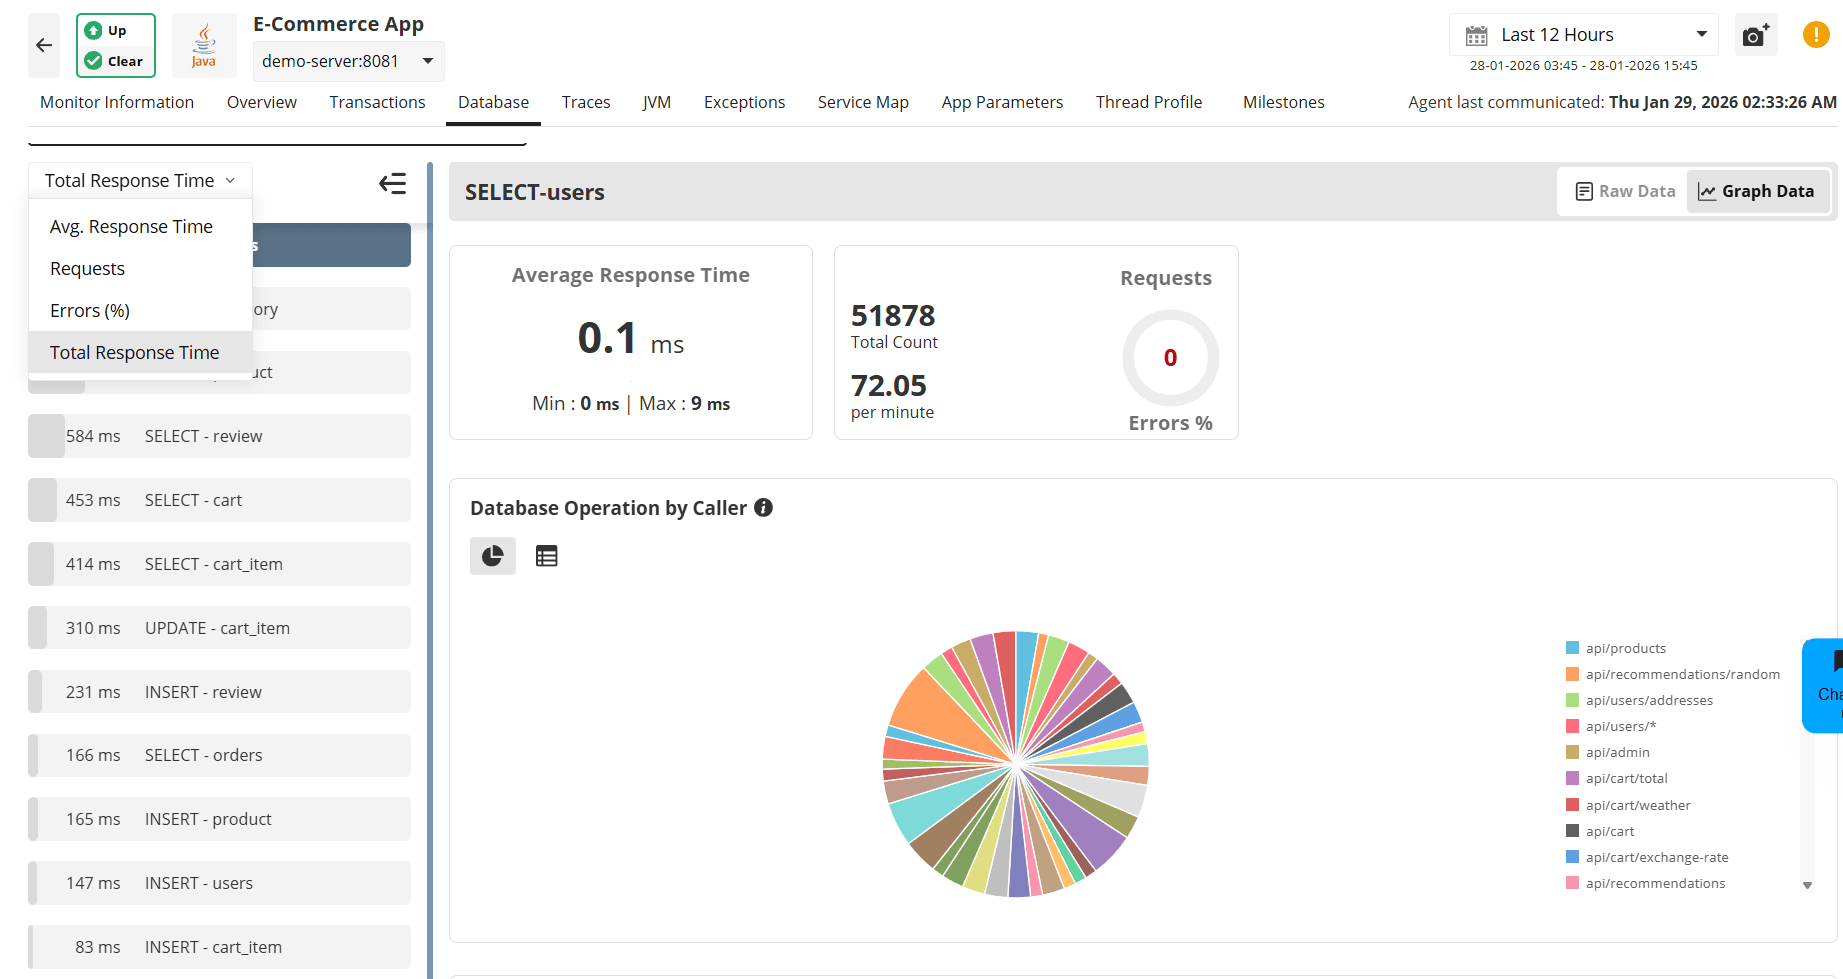
Step 1: Identify expensive queries
- Go to the Database tab
Sort queries by:
- Average Response Time
- Requests
- Errors (%)
- Total Response Time
Step 2: Analyze query behavior
Determine whether:
- A single query is slow due to missing indexes
- Multiple fast queries are executed excessively
- Query patterns change under peak load
Step 3: Optimize using insights
Use this data to:
- Add or optimize indexes
- Reduce unnecessary query calls
- Refactor inefficient query logic
Real-world scenario 4: Diagnosing external bottlenecks
Symptoms
- Performance issues appear only for certain workflows
- Slowness occurs when calling third-party APIs
- Application performance varies based on dependency health
How APM Insight helps
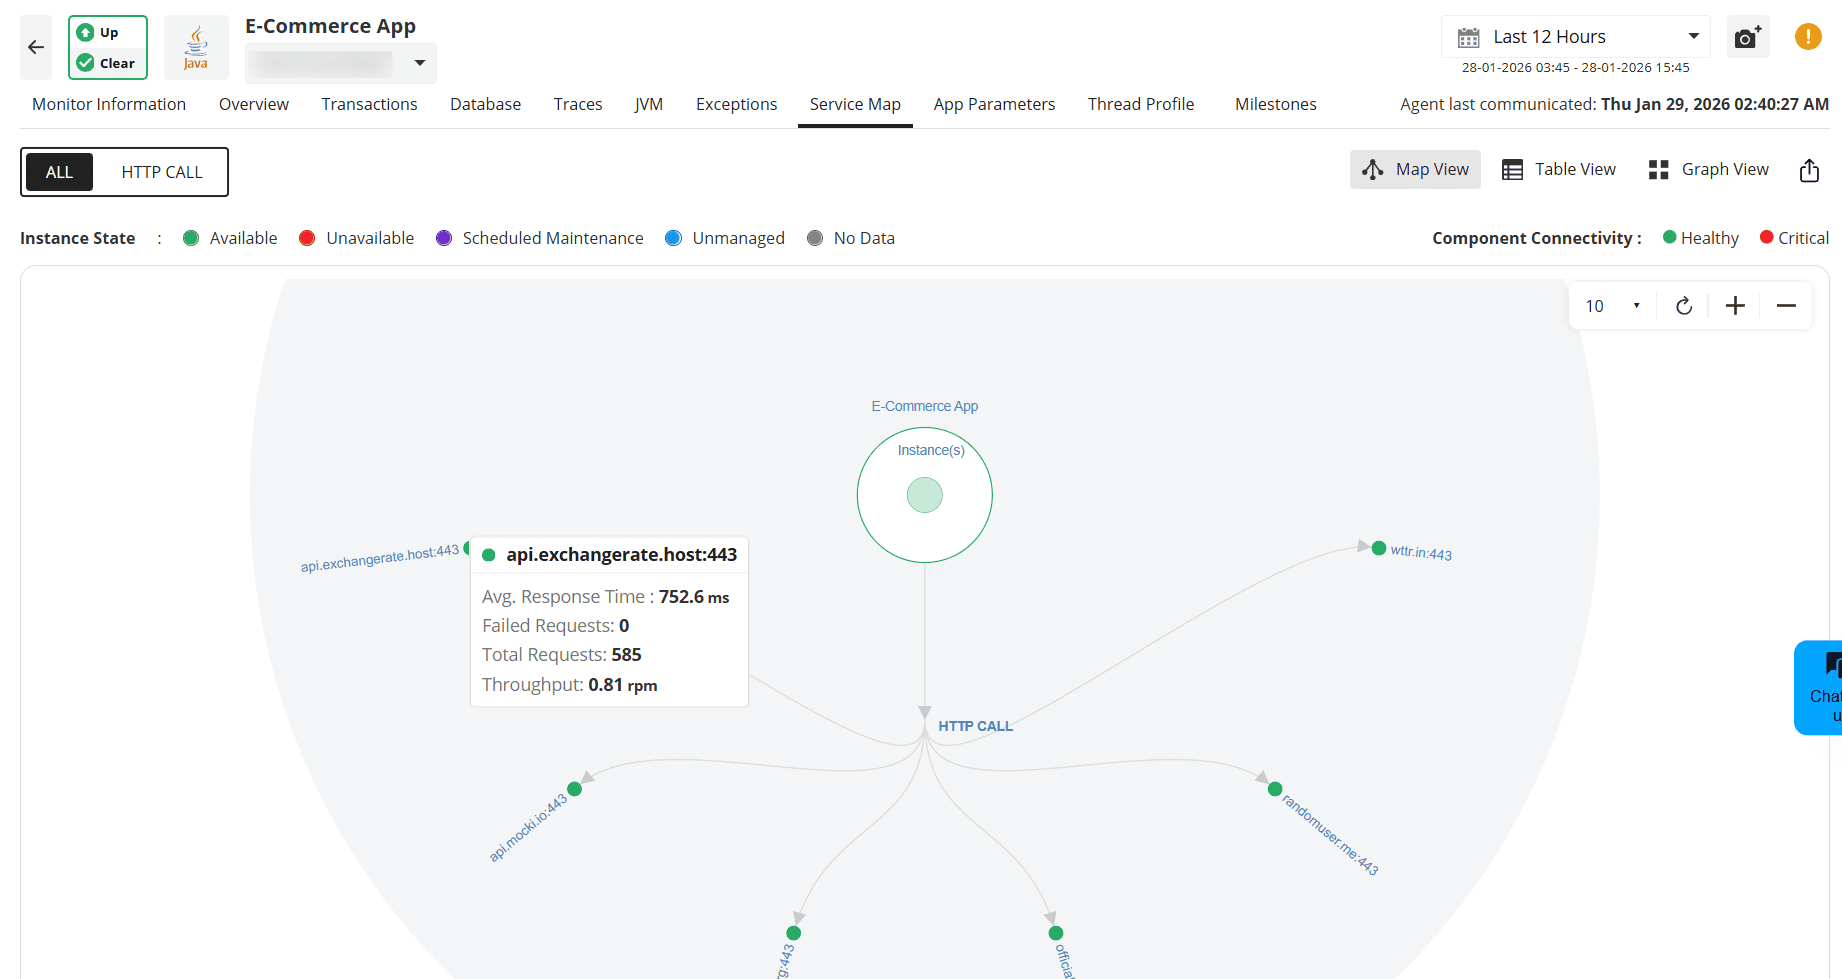
APM Insight visualizes service dependencies using the Service Map, making it easy to identify external bottlenecks.
Step-by-step diagnosis
Step 1: Review the service map
- Understand upstream and downstream dependencies
- Identify services with high response times or error rates
Step 2: Drill down into problematic services
Select a service to view detailed metrics.
Check whether delays originate from:
- Network latency
- Third-party API response times
- Internal service dependencies
This visibility helps teams distinguish between internal issues and third-party failures.
Alerts and proactive monitoring
APM Insight alerting enables early detection of performance issues so teams can act before users are impacted. Alerts should be aligned to business-critical transactions and configured to trigger only on sustained, actionable conditions.
Alerting approach
Use a tiered alerting model to balance visibility and noise:
| Alert Level | Purpose |
|---|---|
| Warning alerts | Early indicators of degradation. Investigate during business hours. |
| Critical alerts | Severe impact or imminent failure. Immediate action required. |
To avoid alert fatigue, configure alerts to trigger on sustained violations, not short-lived spikes. This ensures alerts reflect real issues rather than transient fluctuations.
What to alert on
Focus alerts on metrics that directly affect user experience and reliability:
- Transaction response time
- Apdex score
- Error rate and exception frequency
- Traffic anomalies (sudden drops or spikes)
- Resource saturation (CPU, memory, JVM health for Java applications)
Alerts should be defined per transaction where possible, especially for revenue-generating or SLA-bound flows.
Default alerts
APM Insight monitors key indicators out of the box, including:
- Apdex score degradation
- Response time spikes
Configuring custom alerts
You can create alerts for:
- Specific transactions
- Response time thresholds
- Error rates or exception frequency
Scenario: The 2 AM wake-up call you prevented
Your application's response time starts creeping up at 1:30 AM. By 2 AM, it would have crossed 5 seconds, causing a user-facing outage. But you never see it—because APM Insight alerted you at 1:35 AM, and your automated response scaled up capacity before users noticed.
Default alerts (Already active):
APM Insight monitors these out of the box:
- Apdex score drops below 0.7 (user frustration threshold)
- Response time exceeds 3 seconds for more than 5 minutes
Custom alerts you should configure:
For e-commerce:
- Checkout transaction > 4 seconds → Critical
- Payment API response time > 2 seconds → Warning
For SaaS applications:
- Login transaction > 2 seconds → Warning
- API error rate > 1% → Critical
For financial services:
- Transaction processing > 1 second → Warning
- Any database timeout → Critical
Alert hygiene and maintenance
- Review alert thresholds monthly
- Adjust thresholds as performance improves or workloads change
- Use maintenance windows during deployments
- Disable or tune alerts that do not result in clear action
Goal: Every alert should be meaningful, actionable, and tied to business impact.
Using Milestones to Track Performance Changes
Beyond alerts, milestones help you proactively track performance trends and validate whether your optimization efforts actually worked.
When to Create Milestones
Before and After Deployments
- Create a milestone before releasing new code
- Compare post-deployment performance to detect regressions
- Confirm that optimizations improved key metrics
Example:
Before deploying a caching layer, you create a milestone showing an Apdex score of 0.72 and an average response time of 2.8 seconds.
One week after deployment, the comparison shows:
- Apdex improved to 0.89
- Response time reduced to 1.2 seconds (57% improvement)
This clearly validates the impact of the change.
During Performance Investigations
- Mark, when the issue first appeared
- Track improvements as fixes are applied
- Identify which changes delivered the biggest gains
For Periodic Performance Reviews
- Create monthly milestones to track long-term trends
- Compare peak traffic periods (for example, Black Friday or tax season)
- Detect gradual performance degradation early
Quick Milestone Workflow
Scenario: Validating a Database Optimization
Step 1: Create a "Before" milestone
- Navigate to the Milestone tab
- Click Create Milestone
- Name it clearly (for example, "Before index addition — Customer table")
Step 2: Implement the optimization
- Add database indexes or make query changes
Step 3: Wait 24—48 hours
- Allow enough time for representative production data
Step 4: Create an "After" milestone
- Name it "After index addition — Customer table."
Step 5: Compare results
- Response time: —45%
- Apdex score: 0.68 → 0.87
- Error rate: No increase
Result: Clear, measurable evidence that the optimization was successful. The milestone comparison can be shared with stakeholders to demonstrate impact.
Pro Tip:
Create milestones before major events such as product launches, marketing campaigns, or seasonal traffic spikes. This establishes a reliable performance baseline and helps distinguish load-related issues from code-related regressions.
When to escalate or optimize further
Share insights with development teams
Transaction traces and query data provide concrete evidence of:
- Slow methods
- Inefficient queries
- Problematic dependencies
Use custom instrumentation
For uninstrumented or business-critical code paths:
- Add custom instrumentation
- Gain visibility into specific methods or workflows
This ensures no blind spots in performance monitoring.
Common troubleshooting mistakes to avoid
❌ Don't:
- Jump to conclusions before checking the component breakdown
- Assume database issues without verifying query execution times
- Ignore external service delays when response times vary
- Wait for multiple user complaints before investigating
✅ Do:
- Start with the Apdex score for overall health assessment
- Check the Service Map to understand dependencies
- Use traces to verify assumptions about slow code
- Set up alerts to catch issues proactively
In this series
⬅ Document 1: Getting Started with APM Insight
Core concepts, key terms, and how APM Insight works.
➡ Document 3: Best Practices & Optimization Tips
Learn recommended configurations, alert strategies, and tuning tips to get maximum value from APM Insight.
