Getting started with APM Insight
Who should use this guide?
- Existing APM Insight users
- Evaluation customers
- Prospective users
Table of contents
- Introduction: Why APM Insight?
- What is APM Insight?
- Why use APM Insight?
- How APM Insight works
- Key concepts you should know
- Complete Application Visibility: RUM Integration
- In this series
Introduction: Why APM Insight?
Your checkout page just went from 2 seconds to 12 seconds. Orders are dropping. Support is flooded with complaints. Where do you even start?
This is the reality when applications slow down—and the challenge isn't just knowing something is wrong, but understanding why and where to fix it.
APM Insight helps you see exactly what's happening inside your application, in real time. From slow transactions and inefficient code paths to database delays and external service bottlenecks, APM Insight gives you deep visibility into application performance—so you can diagnose issues faster and fix them with confidence.
This document helps you get started with APM Insight by explaining:
- What APM Insight does
- Why it matters for modern applications
- The core concepts you'll encounter as you begin monitoring
What is APM Insight?
APM Insight is the application performance monitoring (APM) module of Applications Manager that provides code-level visibility into how your application behaves under real user traffic.
It operates as part of Applications Manager, where you'll access dashboards, configure alerts, and analyze performance data through the Applications Manager interface.
By deploying a lightweight agent, APM Insight continuously collects performance data and presents it in a way that makes troubleshooting intuitive—even for complex, distributed applications.
What makes APM Insight different?
Unlike basic monitoring tools that only show you symptoms (slow response times, error rates), APM Insight shows you the root cause—the exact method, query, or external call causing the problem. No more guessing or finger-pointing between teams.
- Monitor application performance in real time
- Identify slow transactions and response time spikes
- Drill down to method-level execution details
- Analyze database queries and external service calls
- Measure user experience using Apdex scores
- Visualize service dependencies using the Service Map (for distributed applications and microservices)
- Integrate with Real User Monitoring (RUM) for complete end-to-end visibility
- Track performance changes over time using Milestones
Why use APM Insight?
1. Faster problem identification
Instead of guessing whether the issue lies in application code, the database, or an external service, APM Insight shows you exactly where time is being spent during a request.
| Without APM Insight | With APM Insight |
|---|---|
| Your team spends hours checking logs, blaming the database, testing the network, and arguing over messages. | You see in 30 seconds that 85% of the response time is from a single unindexed database query. The issue was resolved in 15 minutes. |
2. Code-level visibility
APM Insight traces transactions down to individual methods, helping developers pinpoint inefficient logic, repeated calls, or unhandled exceptions.
getUserProfile() method is making 47 database calls in a loop—giving developers exactly what to fix.3. Better user experience
Apdex metrics provide a clear, standardized way to measure user satisfaction and detect performance degradation before users complain.
4. Proactive monitoring
With alerts and historical reports, teams can identify performance trends early and prevent outages or SLA violations.
How APM Insight works (High-level flow)
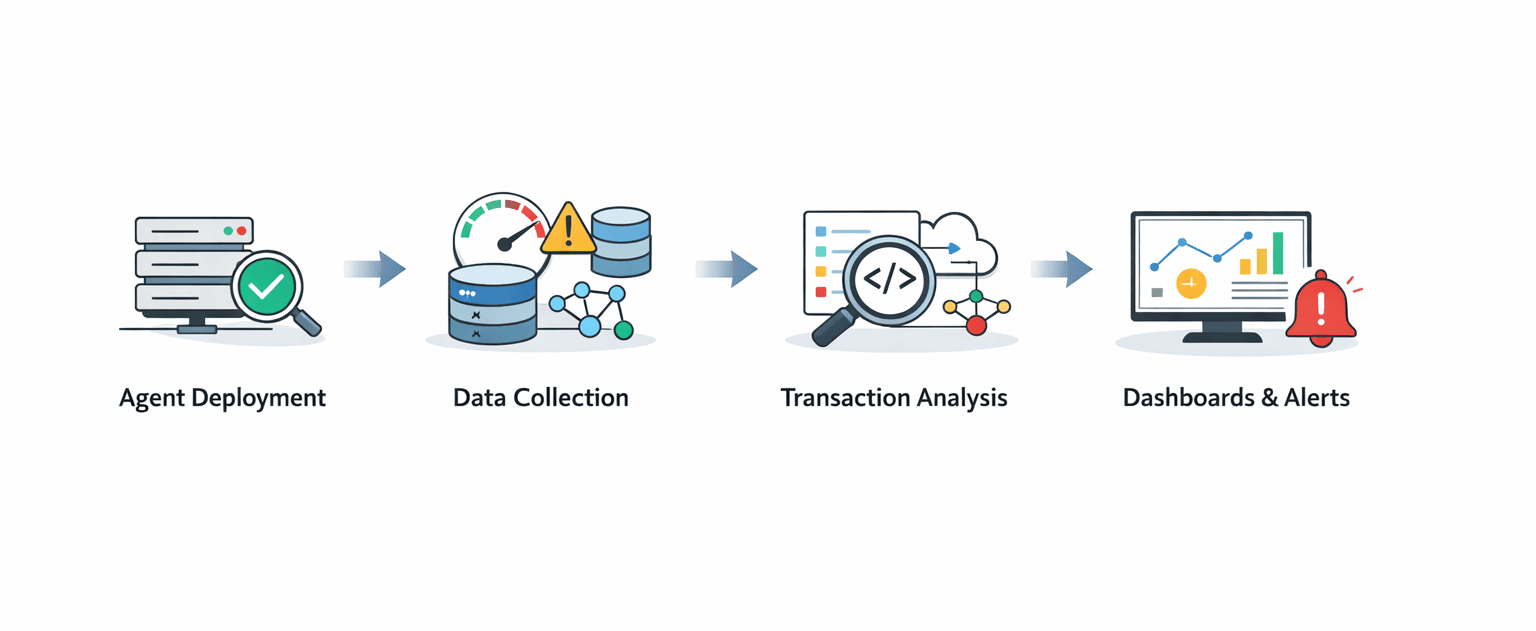
APM Insight follows a simple four-step process to give you complete visibility into your application's performance:
Agent deployment
An APM Insight agent is installed alongside your application. This lightweight agent starts monitoring immediately without impacting performance.
Data collection
The agent captures real-time data such as response times, errors, database calls, and external dependencies—giving you a complete picture of what's happening. Data is collected continuously and transmitted to Applications Manager every 60 seconds, ensuring you see performance changes within 1-2 minutes of occurrence.
Transaction analysis
Each request (transaction) is analyzed end-to-end, including method execution, queries, and external calls. APM Insight traces every step to identify bottlenecks.
Visualization and alerts
Performance data is visualized through intuitive dashboards, with alerts notifying you when thresholds are breached—so you can act before users are impacted.
Key concepts you should know
Understanding these basics will help you navigate APM Insight more effectively.
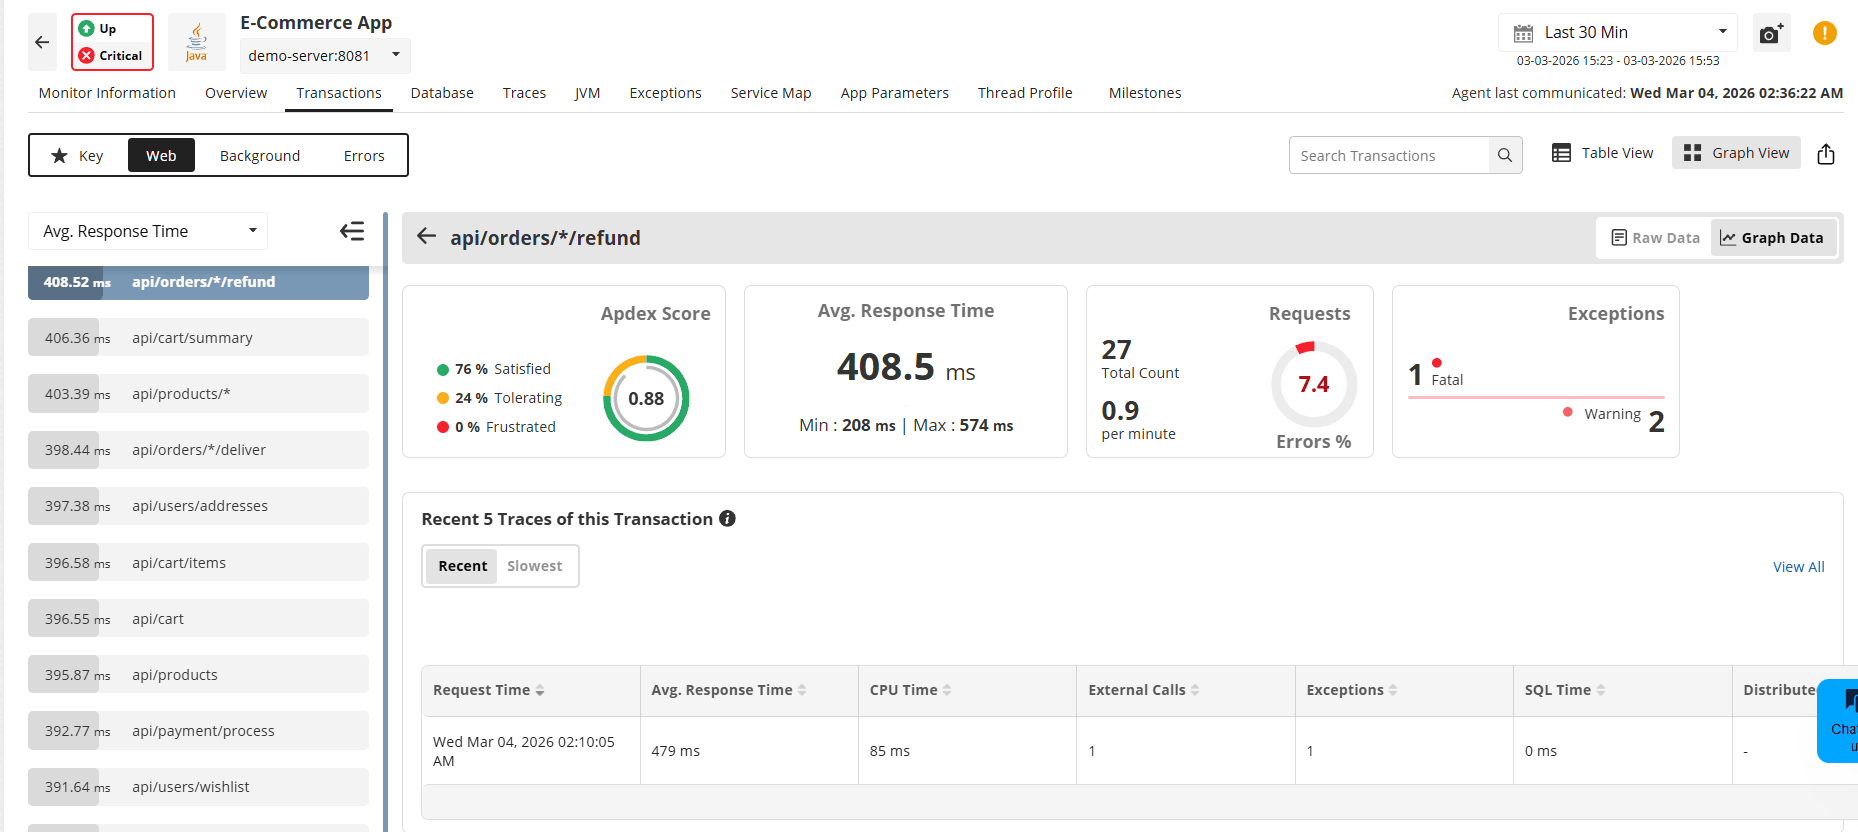
Transactions
A transaction represents any request handled by your application—such as a URL request, API call, or backend operation.
Real-world examples include:
- A customer clicking "Add to Cart" (HTTP POST request)
- An API call checking inventory levels
- A scheduled job processes overnight orders
In APM Insight, each transaction shows you exactly how long it took and where the time was spent.
Traces
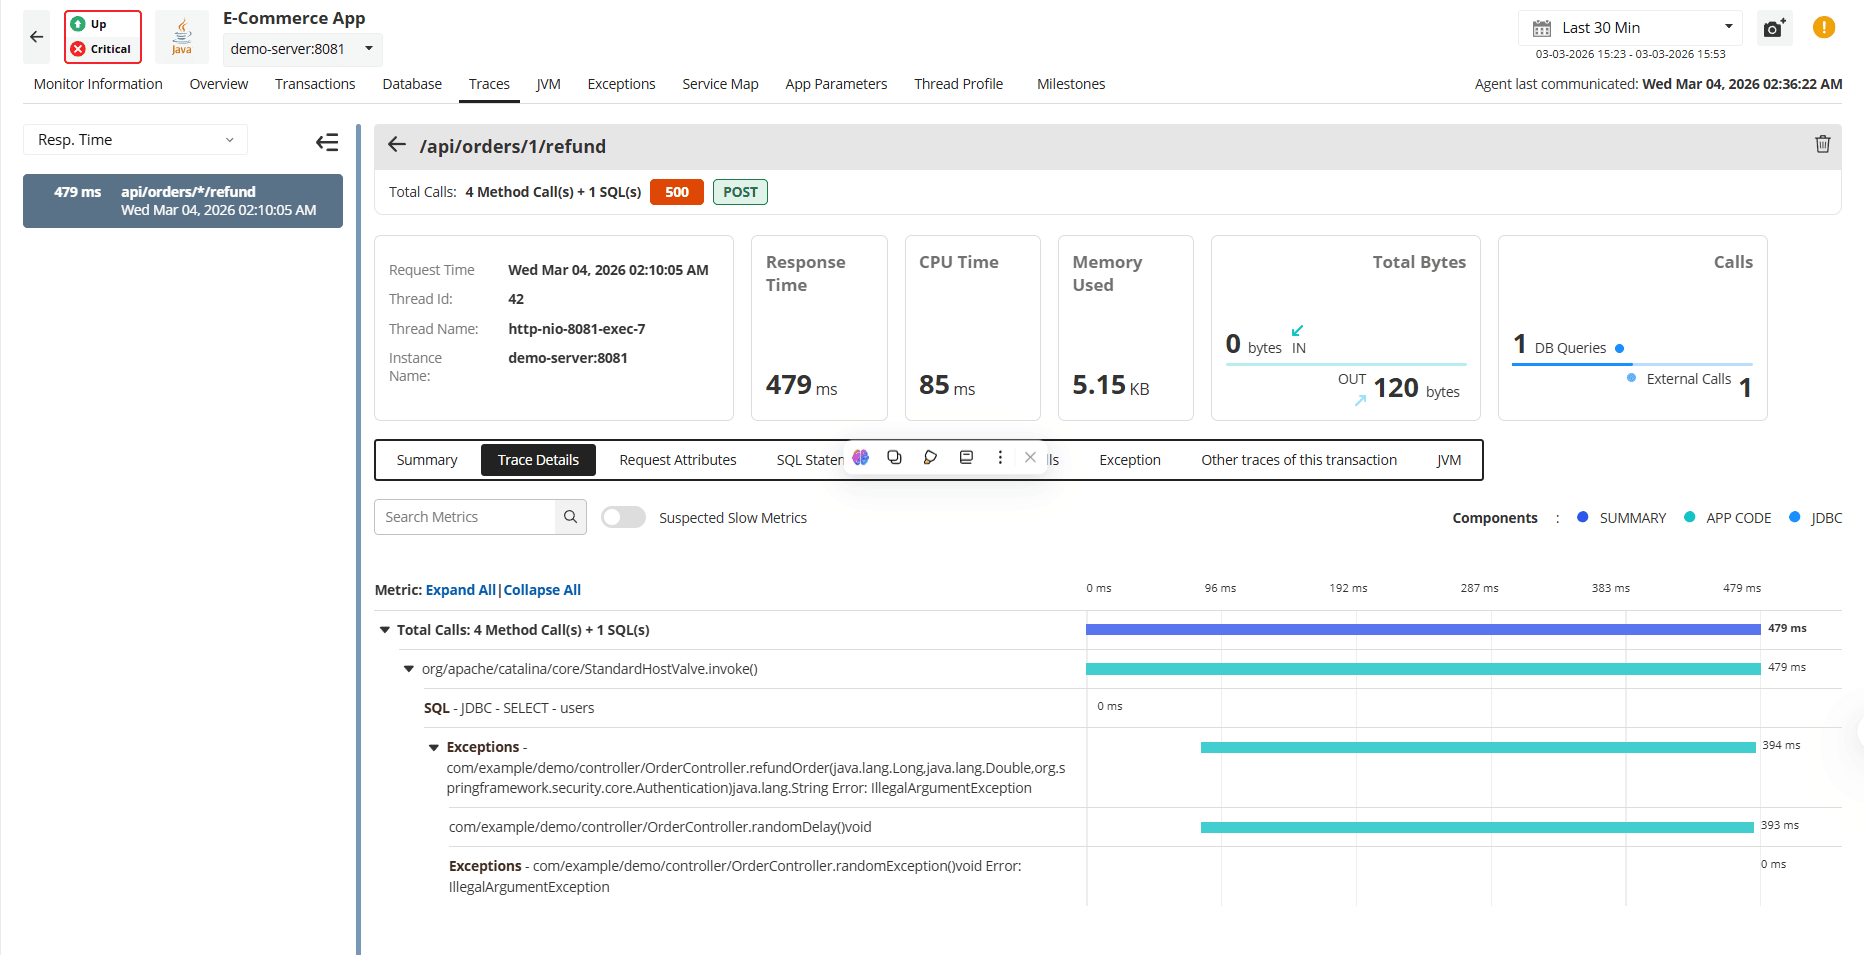
A trace is a detailed execution path of a transaction, showing:
- Method calls
- Execution time per method
- Database queries
- External service calls
Traces are the primary tool for deep troubleshooting.
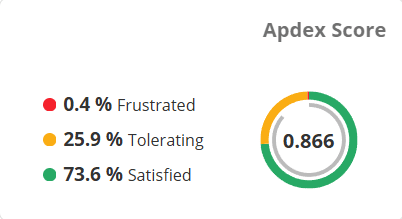
Apdex (Application Performance Index)
Apdex translates response times into a user satisfaction score from 0 to 1, using a configurable threshold value (T) to categorize transaction performance:
- Satisfied: Response time < T (users are fully productive)
- Tolerating: Response time between T and 4T (users notice lag but continue)
- Frustrated: Response time > 4T (unacceptable performance)
How it works:
When you set T = 2 seconds for your checkout transaction:
- Satisfied: < 2 seconds
- Tolerating: 2-8 seconds (automatically 4 × T)
- Frustrated: > 8 seconds
The Apdex score is calculated as:
Apdex = (Satisfied Count + (Tolerating Count ÷ 2)) / Total Samples
Interpreting Apdex Scores
| Score Range | Interpretation |
|---|---|
| 0.94 — 1.00 | Excellent — Most users are satisfied. |
| 0.85 — 0.93 | Good — Most users are satisfied, with a small number tolerating slower responses. |
| 0.70 — 0.84 | Fair — A mix of satisfied and tolerating users. Performance improvements should be considered. |
| 0.50 — 0.69 | Poor — Many users are tolerating slow responses or feeling frustrated. |
| Below 0.50 | Critical — The majority of users are frustrated. Immediate action is required. |
Example (Based on Official Apdex Calculation)
Threshold (T): 500 ms
Total number of samples: 288 transactions
- 40 transactions completed in under 500 ms (Satisfied)
- 200 transactions completed between 500 ms and 2000 ms (Tolerating)
- 48 transactions took longer than 2000 ms (Frustrated)
Apdex formula:
Apdex = (Satisfied + (Tolerating ÷ 2)) / Total samples
Apdex = (40 + (200 ÷ 2)) / 288
Apdex = 140 / 288
Apdex = 0.49
Interpretation: An Apdex score of 0.49 falls in the Critical range and indicates that performance optimization is urgently needed.
Response Time Components
APM Insight breaks down transaction response time into three categories:
| Component | Description |
|---|---|
| App Code | Time spent executing your application logic (Java methods, .NET code, PHP scripts, etc.) |
| DB Components | Time spent on database operations (queries, connections, transactions) |
| Other Components | Time spent on external services, APIs, message queues, and third-party integrations |
This breakdown helps you quickly identify whether slowness originates from your code, your database, or external dependencies.
Instrumentation
Instrumentation is the process of adding monitoring hooks to track how code executes inside your application.
APM Insight automatically instruments many popular frameworks and libraries, providing visibility without manual effort. However, some parts of your application may not be captured by default. To minimize performance overhead, the agent does not instrument the entire codebase automatically.
Automatically Instrumented
APM Insight automatically tracks execution for:
- Framework controllers and routes
- Database libraries (JDBC, Entity Framework)
- Common HTTP clients
This ensures immediate visibility into most standard application workflows.
When Custom Instrumentation Is Needed
Some code paths may require manual instrumentation to gain full visibility, including:
- Legacy or older code modules
- Custom business logic classes
- Internal helper or utility methods
- Third-party libraries that are not auto-detected
Why Some Code Isn't Automatically Instrumented
APM agents selectively instrument code to balance visibility with performance:
1. Performance considerations
Instrumenting every method would create excessive overhead. APM focuses on common entry points (controllers, database calls) while leaving custom business logic uninstrumented by default.
2. Framework detection
APM agents recognize standard frameworks through known package names and annotations (e.g., @Controller, HttpServlet). Your custom classes don't follow these patterns, so they require manual instrumentation.
3. Proprietary and dynamic code
Custom frameworks, runtime-generated code, and reflection-based logic don't match standard instrumentation patterns.
Identifying Uninstrumented Code
A common indicator is when transaction traces show gaps in execution time.
For example:
Transaction: /api/checkout
Total time: 3.0 seconds
Traced methods: 1.5 seconds
Missing time: 1.5 seconds (50% unaccounted for)
The missing 1.5 seconds likely represents uninstrumented code—custom validation logic, proprietary calculations, or legacy helper methods.
Benefits of Custom Instrumentation
Before custom instrumentation:
- Transaction time: 3.0s
- Visible: 1.5s (50%)
- Unknown: 1.5s
After adding custom instrumentation:
- Transaction time: 3.0s
- Visible: 3.0s (100%)
- You now see that
validateOrderData()takes 900ms—your optimization target
Custom instrumentation helps capture these hidden execution paths, ensuring accurate transaction traces and complete performance visibility.
Exceptions and Errors
Understanding the difference between exceptions and errors helps you diagnose whether a problem originates from application code, external dependencies, or system conditions.
Exception
An exception is an abnormal event that occurs during application execution and interrupts the normal flow of the program.
Examples include:
- Unhandled runtime exceptions
- Null pointer exceptions
- Database connection failures
- Timeout exceptions
Exceptions are typically thrown by the application or runtime and may be caught and handled within the code.
Error
An error is any condition that results in a failed transaction, degraded performance, or unreliable behavior. Errors may or may not be caused by exceptions.
Examples include:
- HTTP 5xx responses
- Failed API calls
- Transactions exceeding defined response thresholds
- Resource exhaustion (CPU, memory)
- Repeated warning conditions
APM Insight captures both exceptions and errors, along with stack traces for debugging.
External Components
External components are services your application depends on but doesn't control directly, such as:
- Databases
- APIs
- Third-party services
APM Insight tracks their response times to help identify external bottlenecks.
Milestones
Milestones act as performance snapshots, capturing how your application is behaving at a specific point in time. They are especially useful for comparing performance before and after deployments, configuration changes, or major optimizations.
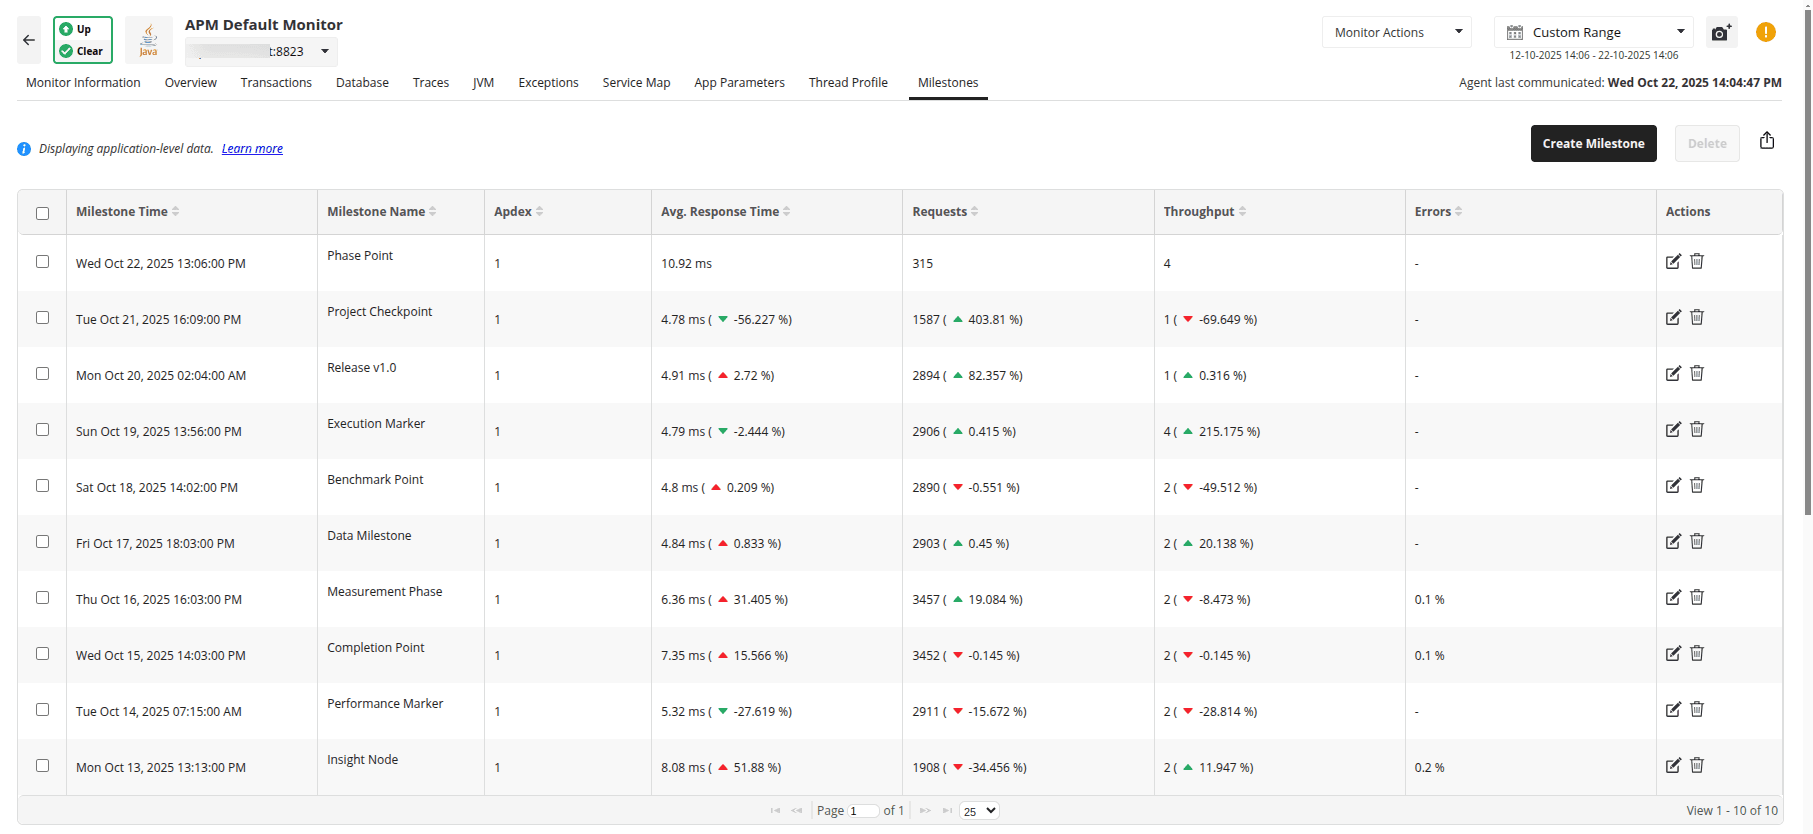
What Milestones Capture
- Apdex score
- Average response time
- Request count and throughput
- Error rates
Why Milestones Matter
Milestones let you compare performance across different points in time so you can clearly answer questions like:
- Did the latest deployment improve or degrade performance?
- How has response time changed over the last few weeks?
- Which release delivered the best user experience?
By viewing deviations between milestones, you can quickly validate whether a change had the intended impact—or introduced a regression.
Real-World Example
Before deploying a database optimization, you create a milestone. After deployment, APM Insight shows:
- Response time improved by 35%
- Apdex increased from 0.78 to 0.91
This confirms that the optimization was successful and positively impacted user experience.
How to Create a Milestone
- Navigate to the Milestones tab in your APM Insight monitor
- Click Create Milestone
- Enter a descriptive name (for example, "Before v2.3 deployment")
- Save
APM Insight automatically compares milestones and displays percentage deviations between time periods, making performance changes easy to spot.
Note: Milestones are available in Applications Manager version 178100 and above. A maximum of 50 milestones per application is supported.
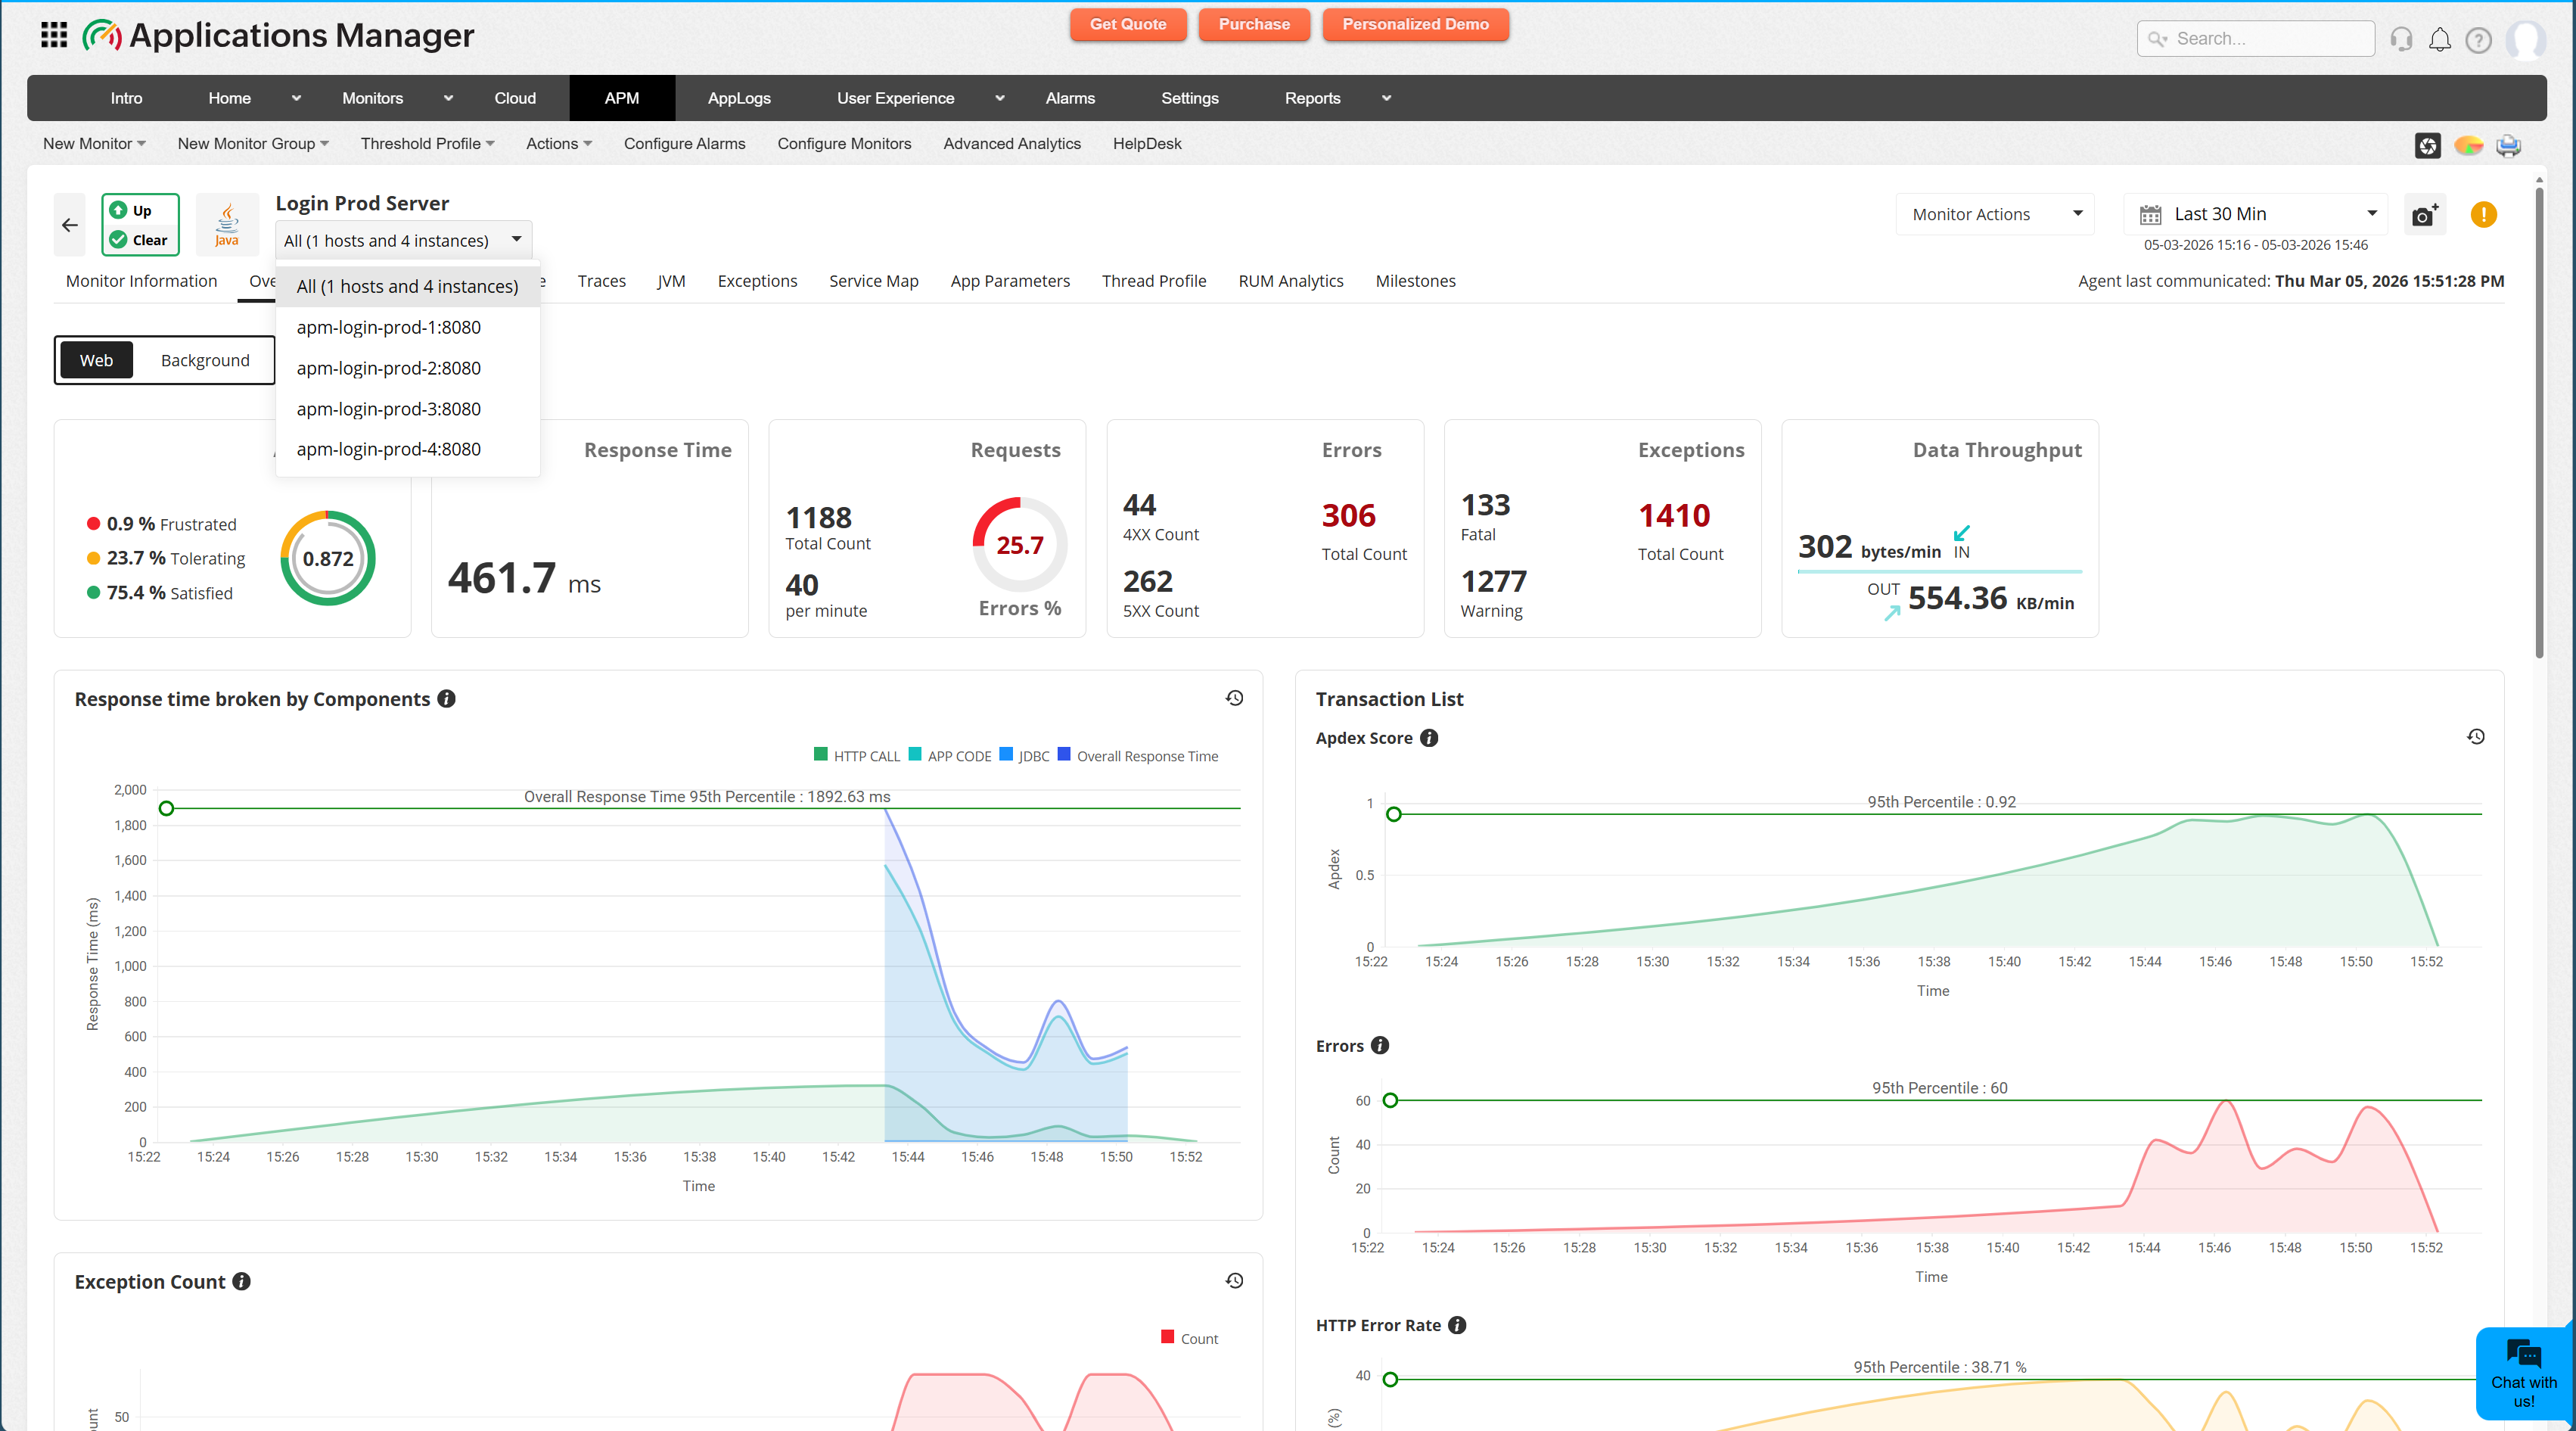
Application vs Instance (Understanding Metric Grouping)
APM Insight separates monitoring into two logical layers:
- Application (Logical Service View)
- Instance (Deployment-Level Monitoring)
Understanding this distinction is essential when interpreting metrics in scaled environments.
Application (Logical Service)
An Application represents the logical business service being monitored.
For example: Ticket Desk (App Name)
This is the overall service — regardless of how many servers or containers it runs on.
To see this in the UI, navigate to: APM Tab → APM Insight Monitor → Monitor Information tab
This screen shows:
- App Name
- Agent Type
- OS Details
- Instance ID
- Host and Port
If multiple instances are deployed under the same application name, APM Insight logically groups them under this single application.
Instance (Deployment-Level Monitoring)
An Instance represents a specific running deployment of the application.
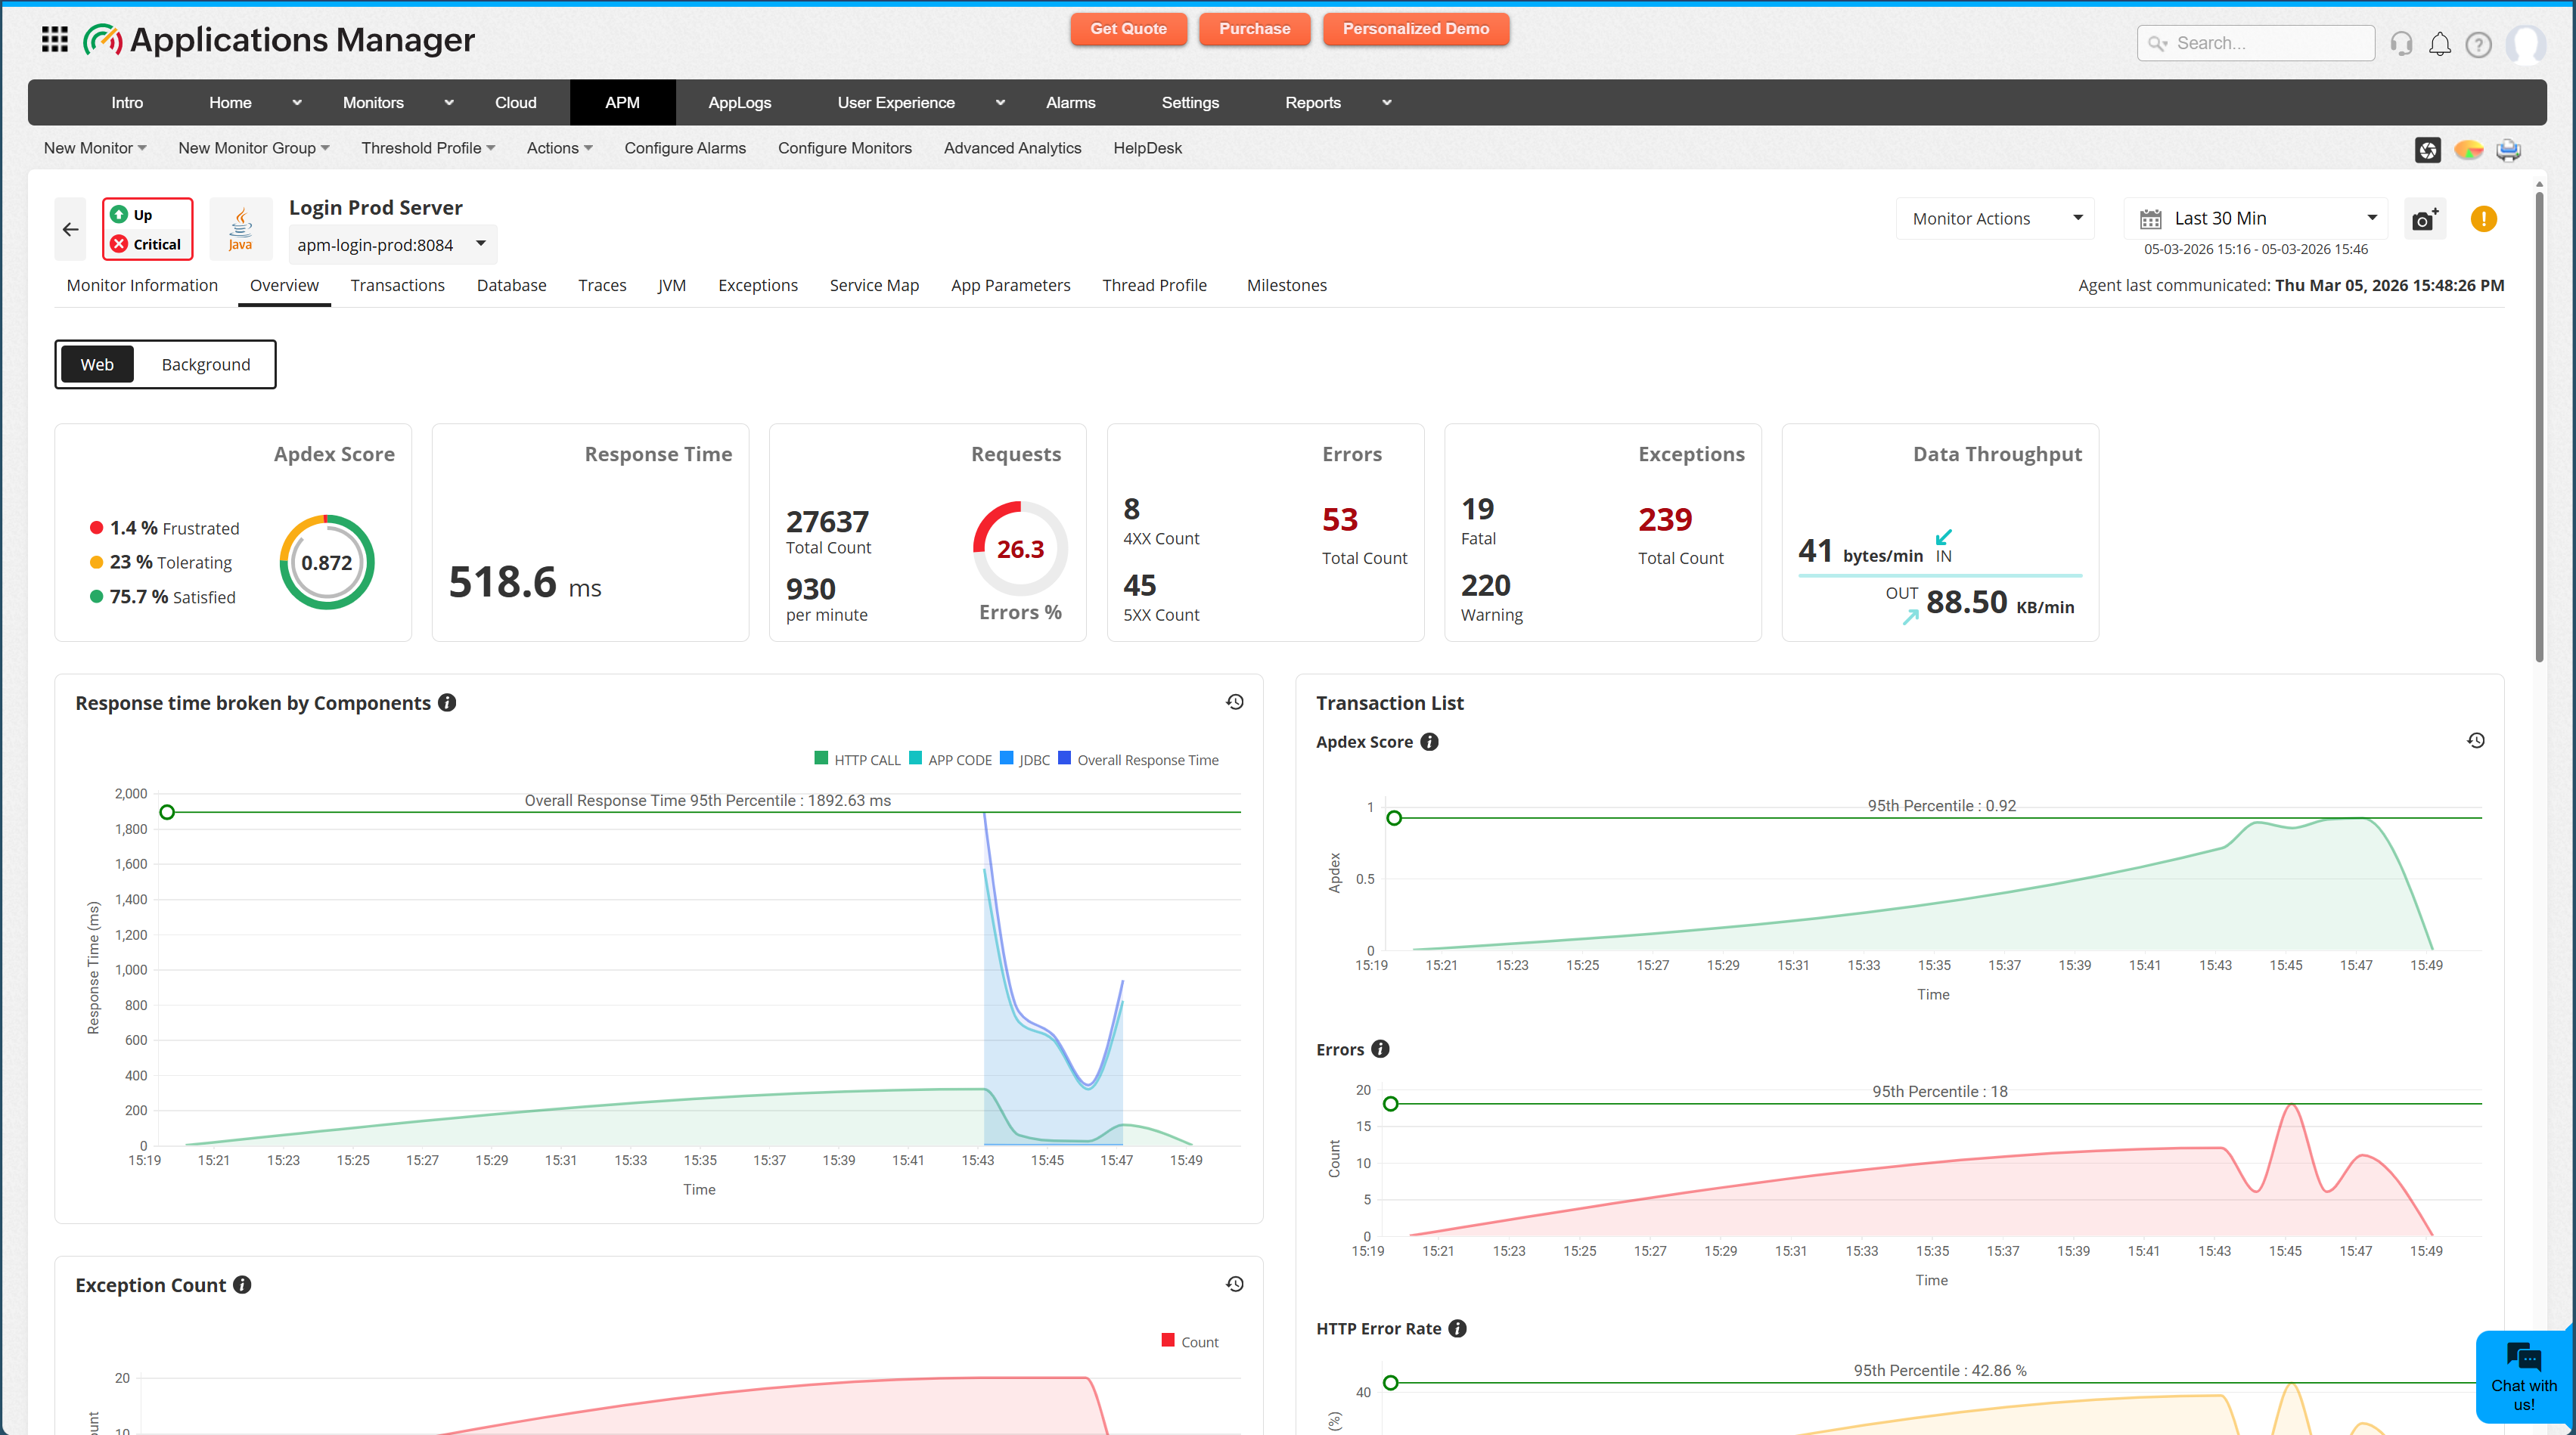
Each instance has its own:
- Response time
- Errors
- Apdex
- CPU/Memory metrics
- Transaction traces
- Component breakdown
APM Insight monitors each instance independently to provide granular diagnostics.
Architecture Example (How Grouping Works)
Consider this architecture:
              Load Balancer
                       |
      -----------------------------------
      |                |                |
  App Server 1     App Server 2     App Server 3
  (Instance A)     (Instance B)     (Instance C)
In APM Insight:
- Application View → Aggregated metrics across all 3 instances
- Instance View → Metrics for each server individually
If App Server 2 has high CPU usage, only Instance B shows a slow response time. You can isolate the issue without affecting the overall application perspective.
Metric Grouping Behavior
When multiple instances exist:
| Level | Metrics Represent |
|---|---|
| Application | Aggregated response time, combined Apdex, and total throughput |
| Instance | Deployment-specific performance and errors |
Why This Matters
In horizontally scaled or containerized environments:
- Aggregated metrics may hide localized bottlenecks
- One unhealthy instance can degrade user experience
- Root cause analysis requires instance-level inspection
APM Insight allows you to move seamlessly between both views.
Licensing Note:
- Each monitored instance (server, container, or VM) requires one APM Insight license.
- For example, if your application runs on 5 servers, you will need 5 licenses.
- For enterprise-scale deployments, contact the sales team for volume pricing.
Complete Application Visibility: RUM Integration
APM Insight monitors your server-side performance (application code, databases, APIs). But what about what users actually experience in their browsers?
RUM (Real User Monitoring) Integration connects APM Insight with RUM, giving you a unified view of both:
| Server-Side (APM Insight) | Client-Side (RUM) |
|---|---|
|
|
Why This Matters
The Complete Performance Picture:
Imagine your server responds to a checkout request in 800ms (fast!), but users report the checkout taking 5 seconds. Where's the problem?
Without RUM integration, you'd only see the 800ms server time—missing the 4.2 seconds of client-side JavaScript execution, slow asset loading, or browser rendering issues.
With RUM Integration, you see:
- ✅ Server processing: 800ms (APM Insight)
- ✅ Network transfer: 200ms (RUM)
- ✅ Client-side rendering: 3.5s (RUM) ← The actual bottleneck
- ✅ JavaScript execution: 700ms (RUM)
Setting Up RUM Integration
Prerequisites:
- Active APM Insight monitor (what you're setting up now)
- RUM monitoring is enabled for your application
Setup Options:
Option 1: Auto-Injection (Java & .NET only) - Recommended
For Java and .NET applications, APM Insight can automatically inject RUM monitoring code into your web pages—no manual code changes required.
Quick setup (2 minutes):
- Navigate to your APM Insight monitor in Applications Manager
- Go to Admin → Edit Monitor → RUM Configuration
- Enable "Auto-inject RUM script."
- Configure URL patterns to monitor (optional: default monitors all pages)
- Save configuration
Benefits:
- ✅ Zero code changes
- ✅ No deployment required
- ✅ Instant RUM visibility
Option 2: Manual Integration (All platforms)
For non-Java/non-.NET applications or when you need a custom control:
Setup steps (5-10 minutes):
- Set up a separate RUM monitor in Applications Manager
- Add RUM JavaScript snippet to your application's HTML pages
- Deploy your application
- Navigate to your APM Insight monitor
- Click on the RUM Analytics tab
- Select your RUM monitor from the dropdown
- Click Associate
- Data from both monitors now appears in one unified view
When to use manual integration:
- Node.js, PHP, Python, Ruby applications
- Single-page applications (SPAs) requiring custom placement
- Fine-grained control over which pages include RUM
Verification
After enabling RUM (using either method):
- Open your application in a browser
- Navigate to the RUM Analytics tab in APM Insight
- Confirm data appears within 2-5 minutes
Note:
- RUM Analytics is available in the APM Insight application monitors, not individual instances
- Monitor-specific actions apply only to APM Insight data
- Enterprise Edition Central Server: Contact your administrator for RUM association
When to Use RUM Integration
Ideal for:
- ✅ Web applications with significant front-end complexity
- ✅ E-commerce sites (track complete user journey)
- ✅ SaaS applications with rich JavaScript interfaces
- ✅ Global applications (understand regional performance)
- ✅ Mobile-responsive applications
Less critical for:
- Backend APIs with no user interface
- Batch processing systems
- Internal microservices
Quick Example: E-Commerce Checkout
Without RUM Integration:
- APM Insight shows: Checkout API responds in 1.2s ✓
- Users complain: "Checkout is slow!"
- Team puzzled: Server performance looks fine
With RUM Integration:
- APM Insight shows: Server responds in 1.2s ✓
- RUM shows: Total page load = 6.8s ⚠️
- Network: 0.3s ✓
- Client-side rendering: 4.2s ❌ (bottleneck!)
- JavaScript execution: 1.1s ⚠️
- Root cause identified: Unoptimized client-side rendering
- Solution: Lazy load non-critical components
- Result: Page load reduced to 2.1s, user complaints disappear
In this series
➡ Document 2: Practical use cases & troubleshooting
Learn how to diagnose real-world performance problems using APM Insight.
