AppLog Query Monitor
- Overview
- Prerequisites
- Creating an AppLog Query Monitor
- How the queries are monitored
- Monitor details page
- Configuring and viewing alarms
- Modifying queries in an existing monitor
Overview
The AppLog Query Monitor lets you continuously monitor the queries you save in the AppLogs Explorer. At every poll, the monitor runs each associated query, exposes the results as monitor attributes, and raises alarms when the thresholds you configure are violated.
With the AppLog Query Monitor, you can:
- Get alerted when the count of a log event, such as audit failures, crosses a limit
- Track log data grouped by a field, such as the number of events per error level, and alert on each group individually
- Run queries only against specific servers or monitor groups
- Monitor up to five saved queries from a single monitor
Prerequisites
Before creating an AppLog Query Monitor, make sure that:
- The FSO Agent is installed with AppLogs monitoring enabled, and a log profile is associated with the agent. Refer to What is AppLogs? for more information.
- Log collection is working, and you can see the logs in the AppLogs tab.
- The query you want to monitor is saved in the AppLogs Explorer.
Creating an AppLog Query Monitor
Associating a saved query with a monitor
- In the AppLogs tab, enter and run the query you want to monitor in the Explorer. For help with writing queries, refer to the AppLogs Explorer help.
- Click the star icon at the end of the search bar to mark the query as a saved search and enter your preferred configuration details. For detailed steps on saving searches, refer to the AppLogs Explorer saved searches help.
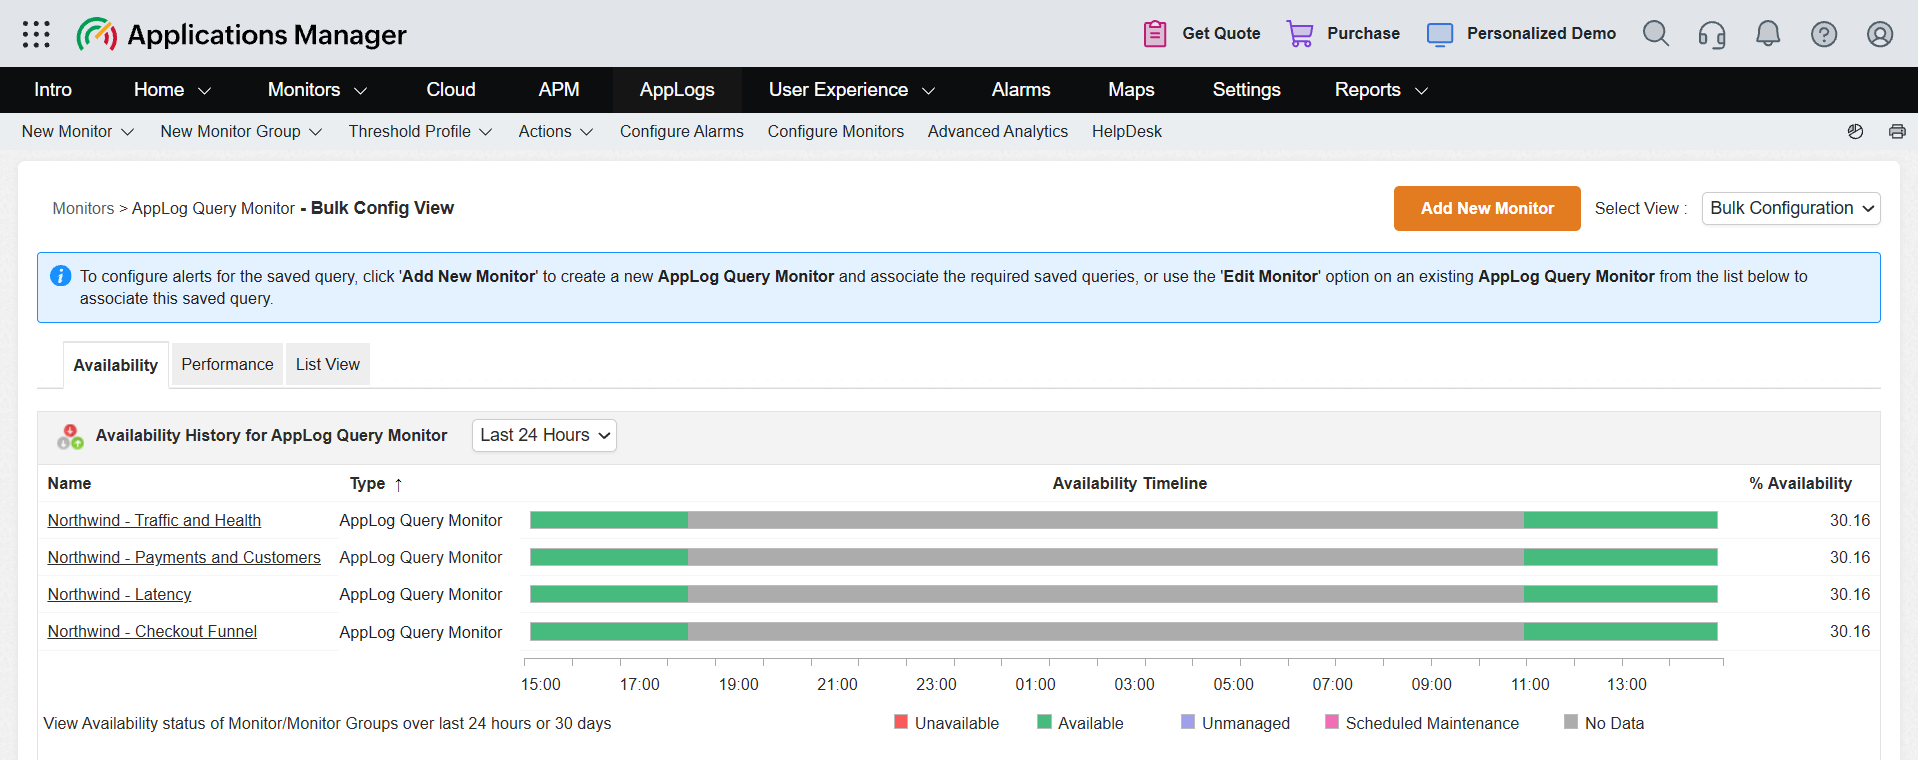
After the query is saved, the Configure Query Alert Monitor panel appears. Click Configure. This opens the AppLog Query Monitor bulk configuration page.
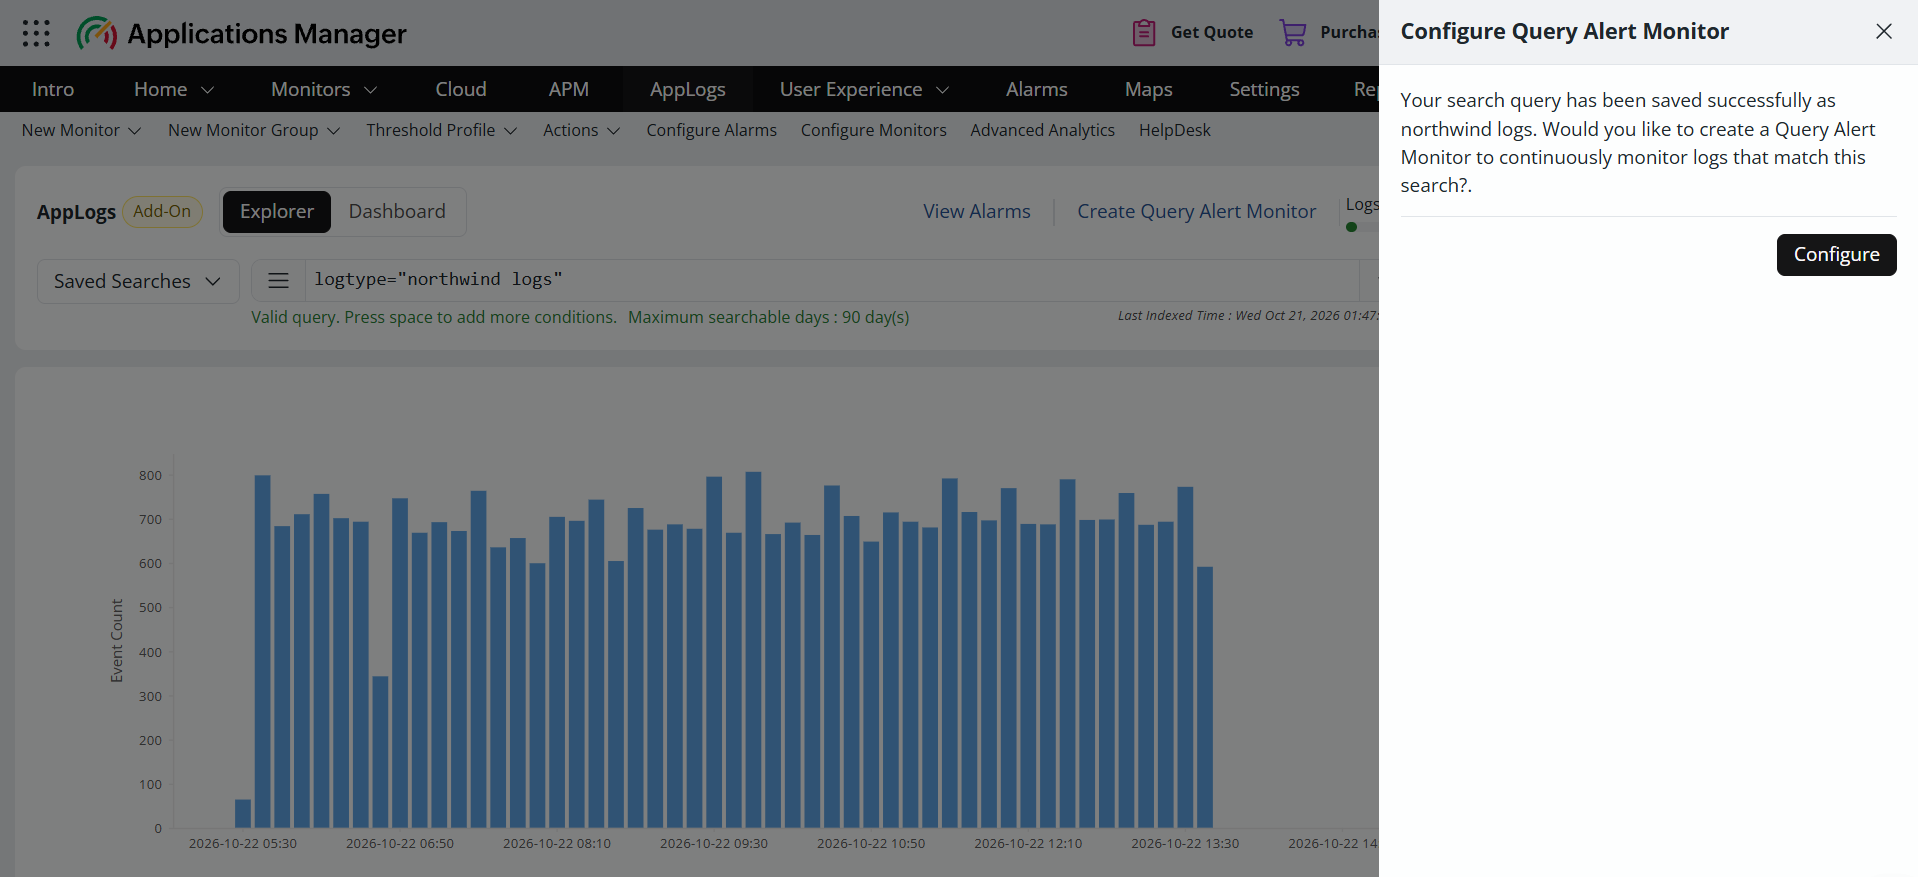
If you closed the panel, or if the query is already saved, click Create Query Alert Monitor at the top of the AppLogs tab instead.
- On the bulk configuration page, choose how to associate the saved query:
- With a new monitor: Click Add New Monitor, and then configure the monitor as described in Configuring a new monitor.
- With an existing monitor: Click the monitor you want to associate the saved query with. On the monitor details page, click Edit Monitor on the right side of the page, select the saved query under Search Queries, and save the changes.
Note: A single monitor supports up to five saved queries. Before you associate a query with an existing monitor, make sure it hasn't reached this limit. If it has, choose a different existing monitor or create a new one.
Configuring a new monitor
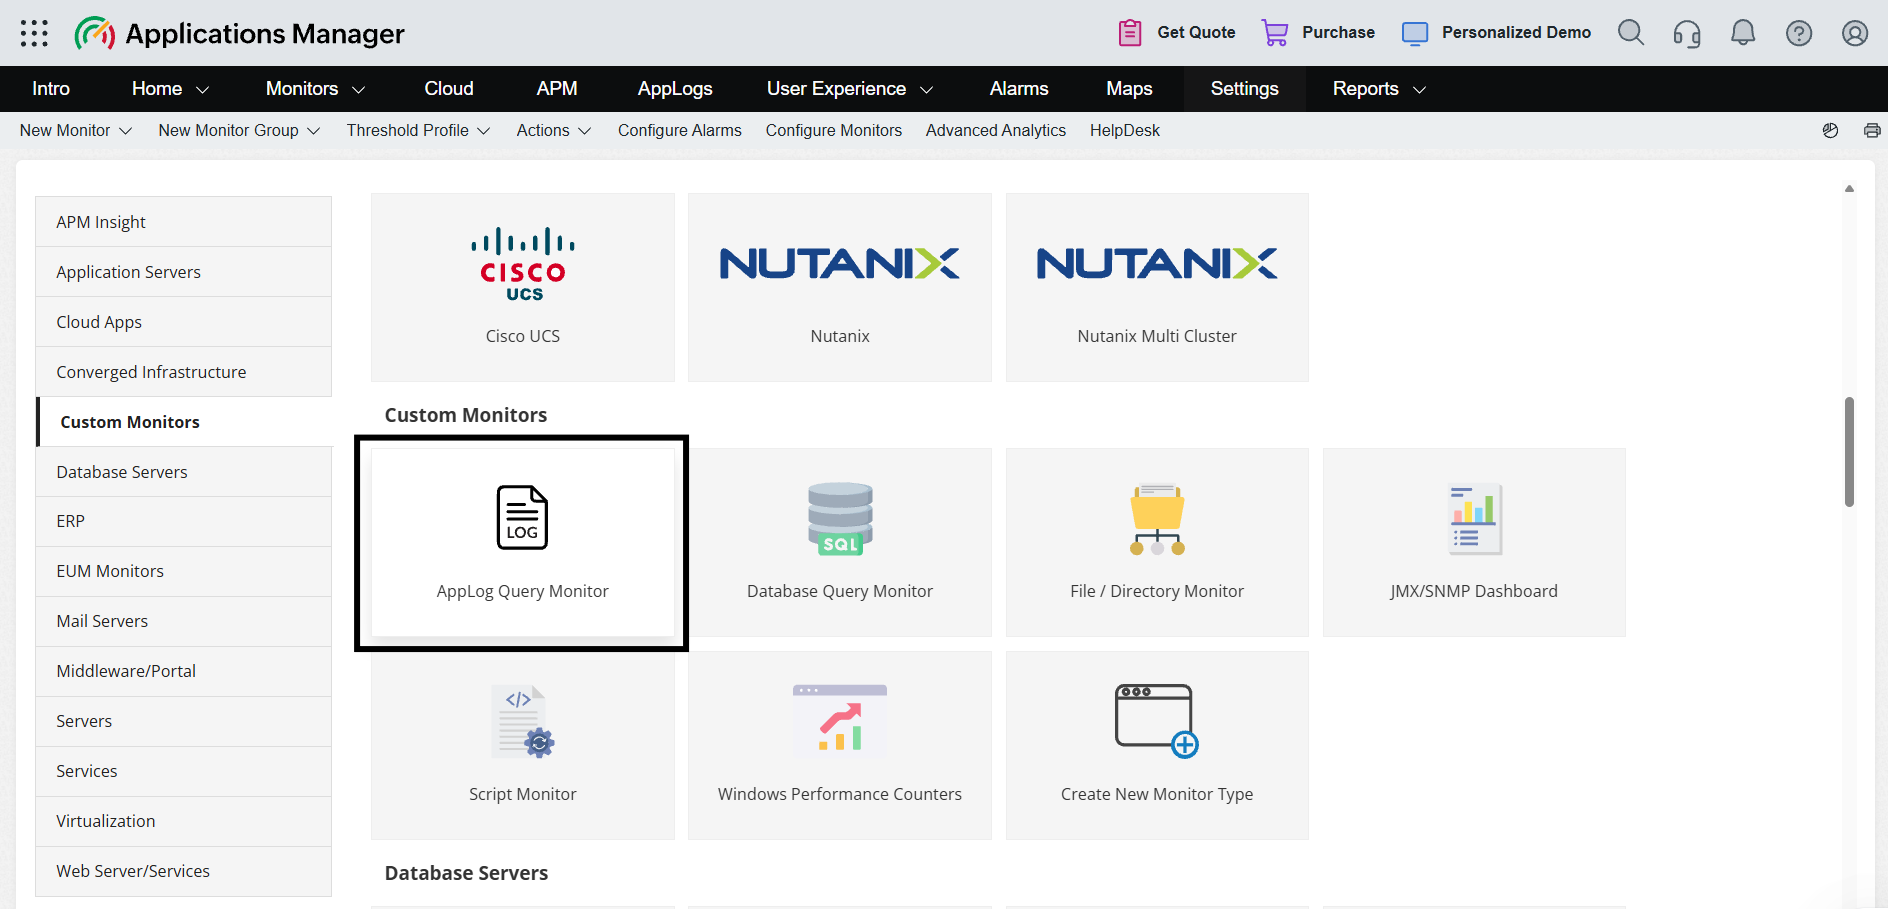
You can also create a new monitor from the New Monitor page by selecting the AppLog Query Monitor in the Custom Monitors category.
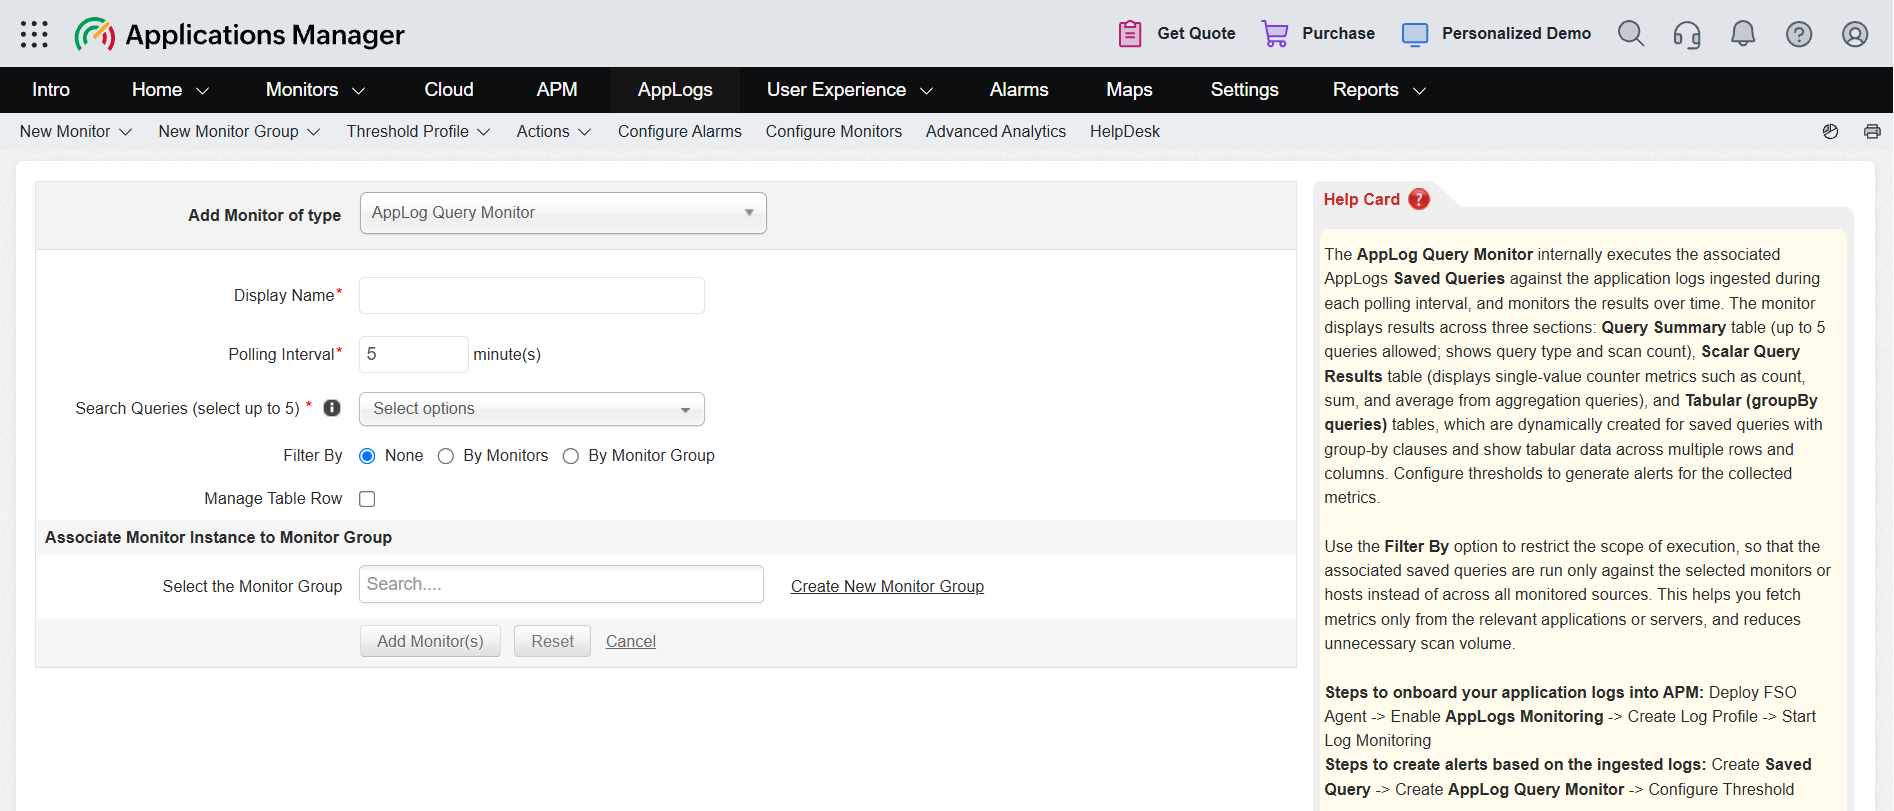
On the Add Monitor page, specify the following details:
- Display Name: The name of the AppLog Query Monitor.
- Polling Interval: Defines how frequently the saved queries are executed.
- Search Queries: Select up to five saved queries to monitor. Each query is monitored and alerted on independently.
- Filter By: By default, a query searches the logs of all hosts that have the log type. Select By Monitors or By Monitor Group to restrict the search to specific servers or monitor groups.
- Manage Table Rows: Configure how monitored rows are handled when the query results change, such as deleting rows that no longer appear in the results.
You can also associate the monitor with a monitor group. Click Add Monitor(s) to save the configuration.
How the queries are monitored
At every poll, all the configured queries are executed, and the results are processed as monitor attributes. Alerting and reporting are handled by the existing Applications Manager alarm framework. Each query is monitored independently, and how its results appear depends on the type of query:
| Query type | Example | How it is monitored |
|---|---|---|
| Aggregation | logtype="Windows Event Log" and level EQUALS "audit failure" and user EQUALS "Auth" count | Each aggregation is treated as an individual attribute and listed under Scalar Query Results. Thresholds are applied to the result value. |
| Group by | logtype="Windows Event Log" and computername EQUALS "db-server-02" groupby level | The results are listed in a table. Each row is monitored independently, and thresholds are evaluated separately for every row. |
Note: If no log entries match a query during a poll, the monitor displays the following:
- Aggregation queries: A
countquery shows 0. Functions that need log entries to calculate a value, such asavg,min,max, andsd, show no value. - Group by queries: The table has no rows because there are no groups to list. Rows from earlier polls are handled as configured in Manage Table Rows.
If you expect results, run the same query in the AppLogs Explorer for the same period, and confirm that log collection is working for the hosts selected in Filter By.
For the aggregation functions and operators you can use in a query, refer to the query reference.
Note: Each query is run over a time window calculated from the polling interval and a buffer period (default: 5 minutes). The buffer helps avoid missing logs that arrive with a slight ingestion delay.
For example, if a poll starts at 12:00 PM with a polling interval of 5 minutes, the query is run for the period from 11:50 AM to 11:55 AM.
Monitor details page
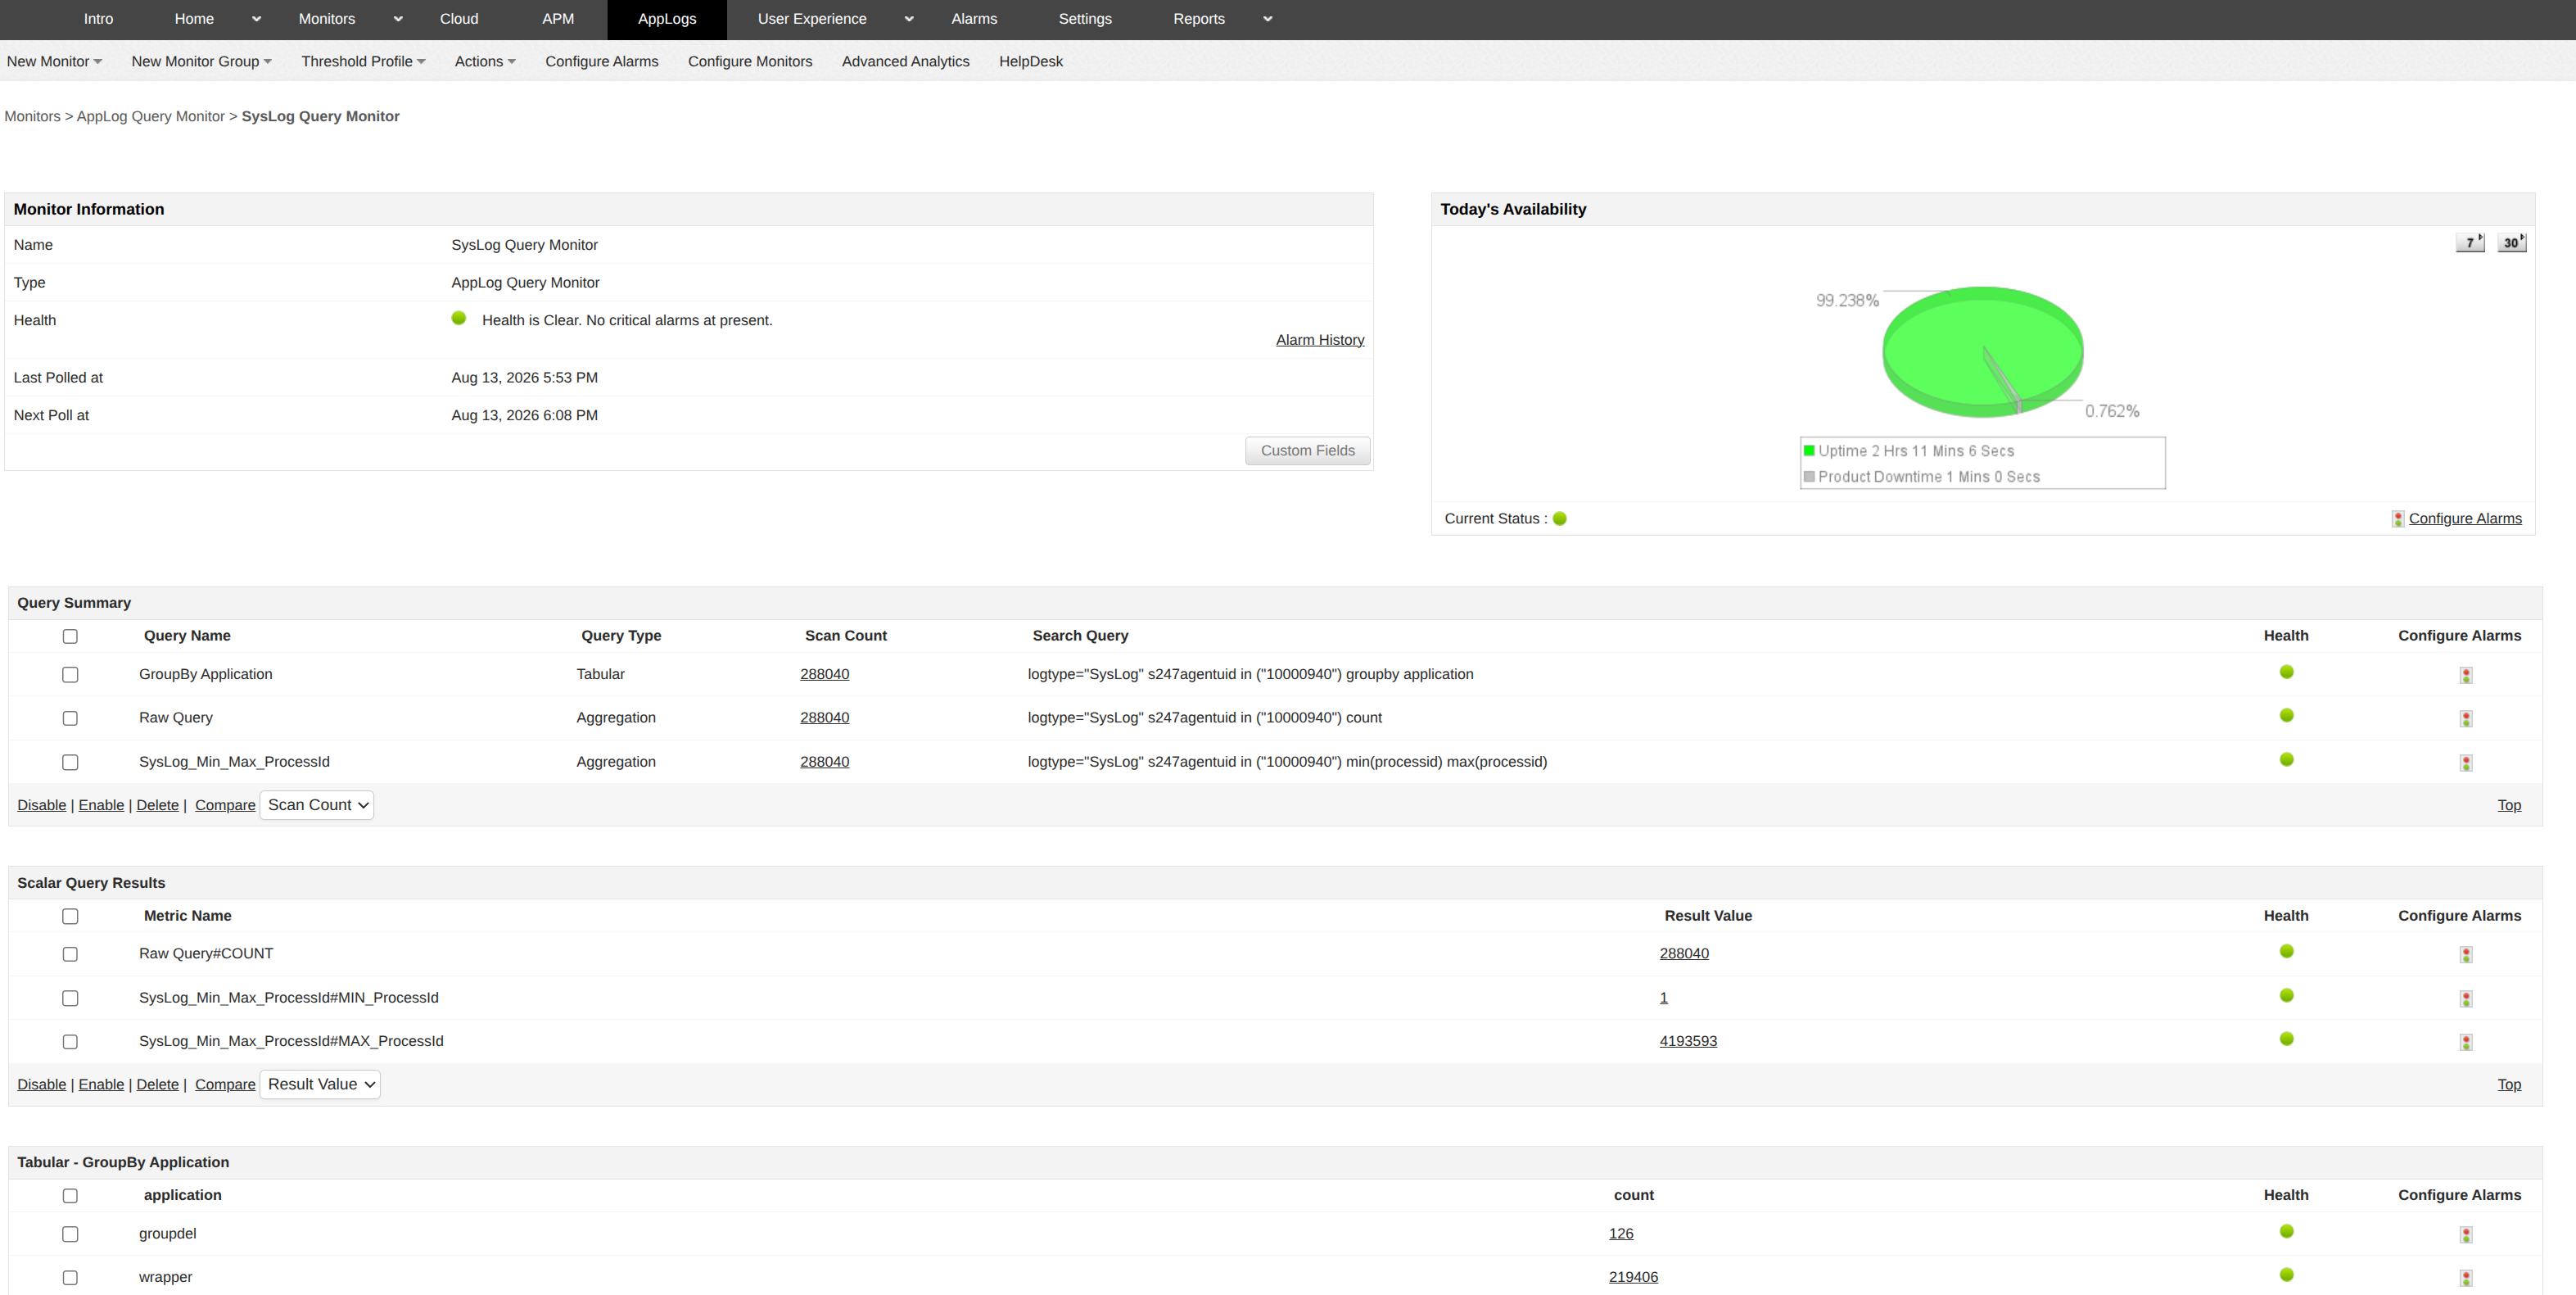
The monitor details page shows the monitor's health, last and next poll times, and availability, followed by the results of the configured queries in three tables:
| Parameter | Description |
|---|---|
| QUERY SUMMARY | |
| Query Name | The name of the saved query associated with the monitor. A single monitor can contain queries on multiple log types. |
| Query Type | Indicates whether the query is an aggregation query or a group by (tabular) query. |
| Scan Count | The total number of log entries scanned by the query at the last poll. This is not the number of results displayed. For example, a group by query that returns 5 rows, one for each group, can scan thousands of log entries. |
| Search Query | The query that is executed at every poll. |
| Health | The health status of the query, based on the thresholds configured for it. |
| SCALAR QUERY RESULTS | |
| Metric Name | The attribute created for an aggregation in a query. Each aggregation is listed separately. |
| Result Value | The value returned by the aggregation at the last poll. |
| Health | The health status of the attribute, based on the thresholds configured for it. |
| GROUP BY RESULTS | |
| Group by column | Each distinct value of the field the query is grouped by is listed as a row, and every row is monitored independently. |
| Count / aggregated value | The value calculated for each group, for example, the count of log entries. |
| Health | The health status of each row, based on the thresholds configured for it. |
Understanding GROUP BY RESULTS
The GROUP BY RESULTS section displays the results of queries that group log entries by a specified field. Each distinct value of the grouping field appears as a separate row, along with its count or aggregated value and health status. Applications Manager evaluates each row independently, allowing you to configure thresholds and alarms for individual groups.
For example, grouping Windows event logs by error level lets you monitor event distribution across levels such as Error, Warning, and Information. You can identify which groups generate more events and configure alarms for groups that exceed the expected threshold.
Relevant use cases
- Investigating server errors: Group log entries by server name to identify systems generating unusually high numbers of errors.
- Monitoring audit failures: Group audit-failure events by user to identify accounts associated with repeated failures.
- Troubleshooting application requests: Group relevant application logs by HTTP status code to identify increases in server-side errors.
Each group can have its own threshold and alarm configuration. This helps you identify the specific group that requires attention instead of relying only on an overall count.
Note: For GROUP BY queries, only the first GROUP BY column is used to identify each row. Combinations of multiple columns as a row identifier are not supported.
Configuring and viewing alarms
To be alerted when query results cross a limit, configure thresholds and actions for the monitor under Configure Alarms. The thresholds determine when an alarm is triggered, and the actions define the response to the alarm. You can associate thresholds with attributes such as Query Summary - Scan Count, Scalar Query Results - Result Value, and the health and availability attributes. Use the Configure Alarms icon next to a query, a scalar result, or a group by row to configure alarms for it individually.
Refer to Associating Threshold and Action with Attributes for more details.
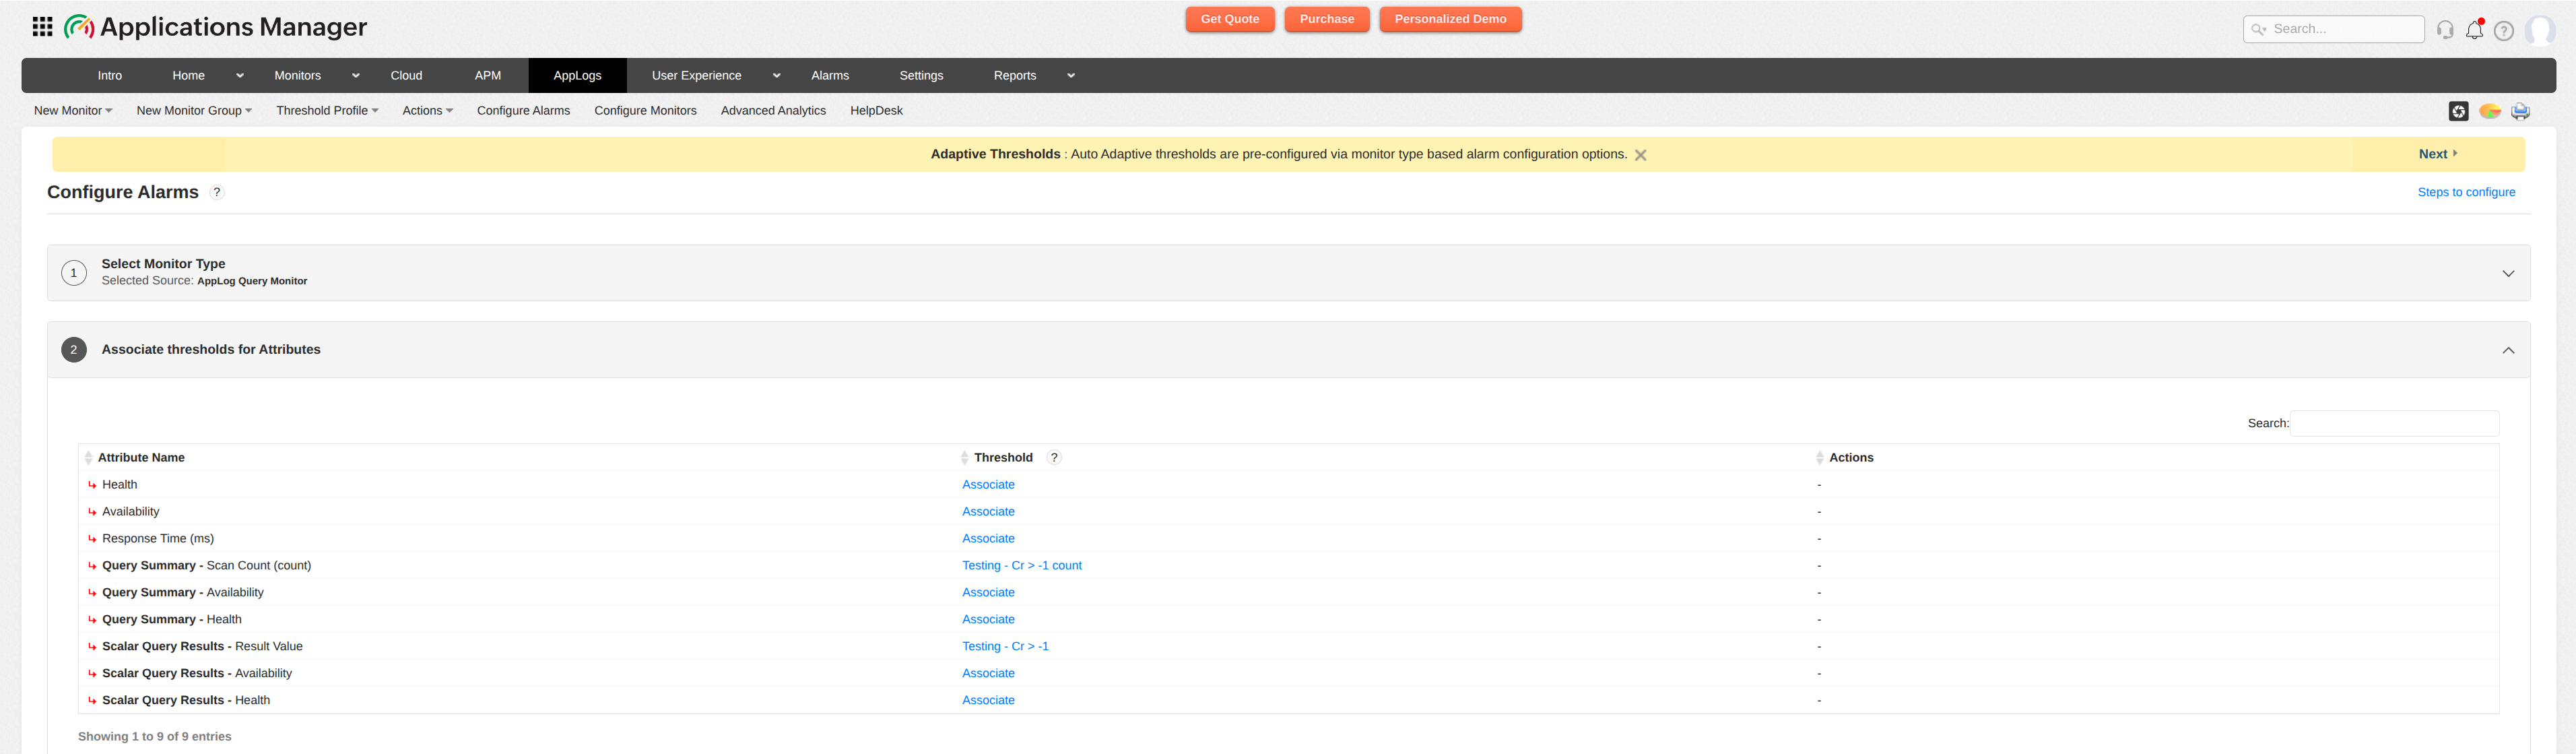
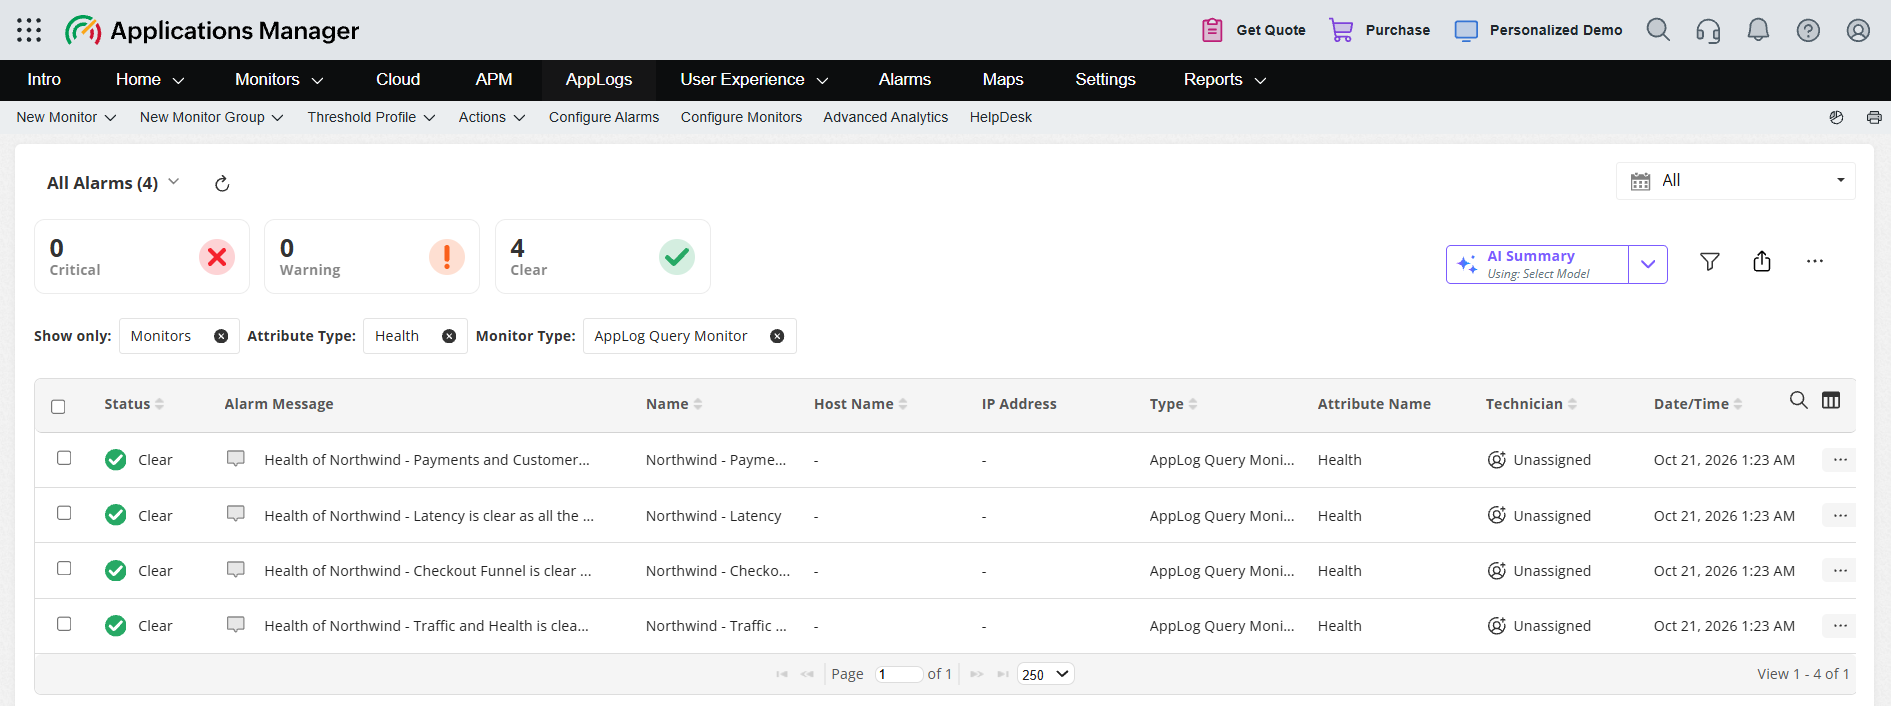
When a configured threshold is violated, the monitor's health status changes and an alarm is generated. You can view the generated alarms in either of the following ways:
- In the AppLogs tab, click View Alarms to view alarms associated with the AppLog Query Monitor.
- Navigate to the Alarms tab to view the generated alarms.
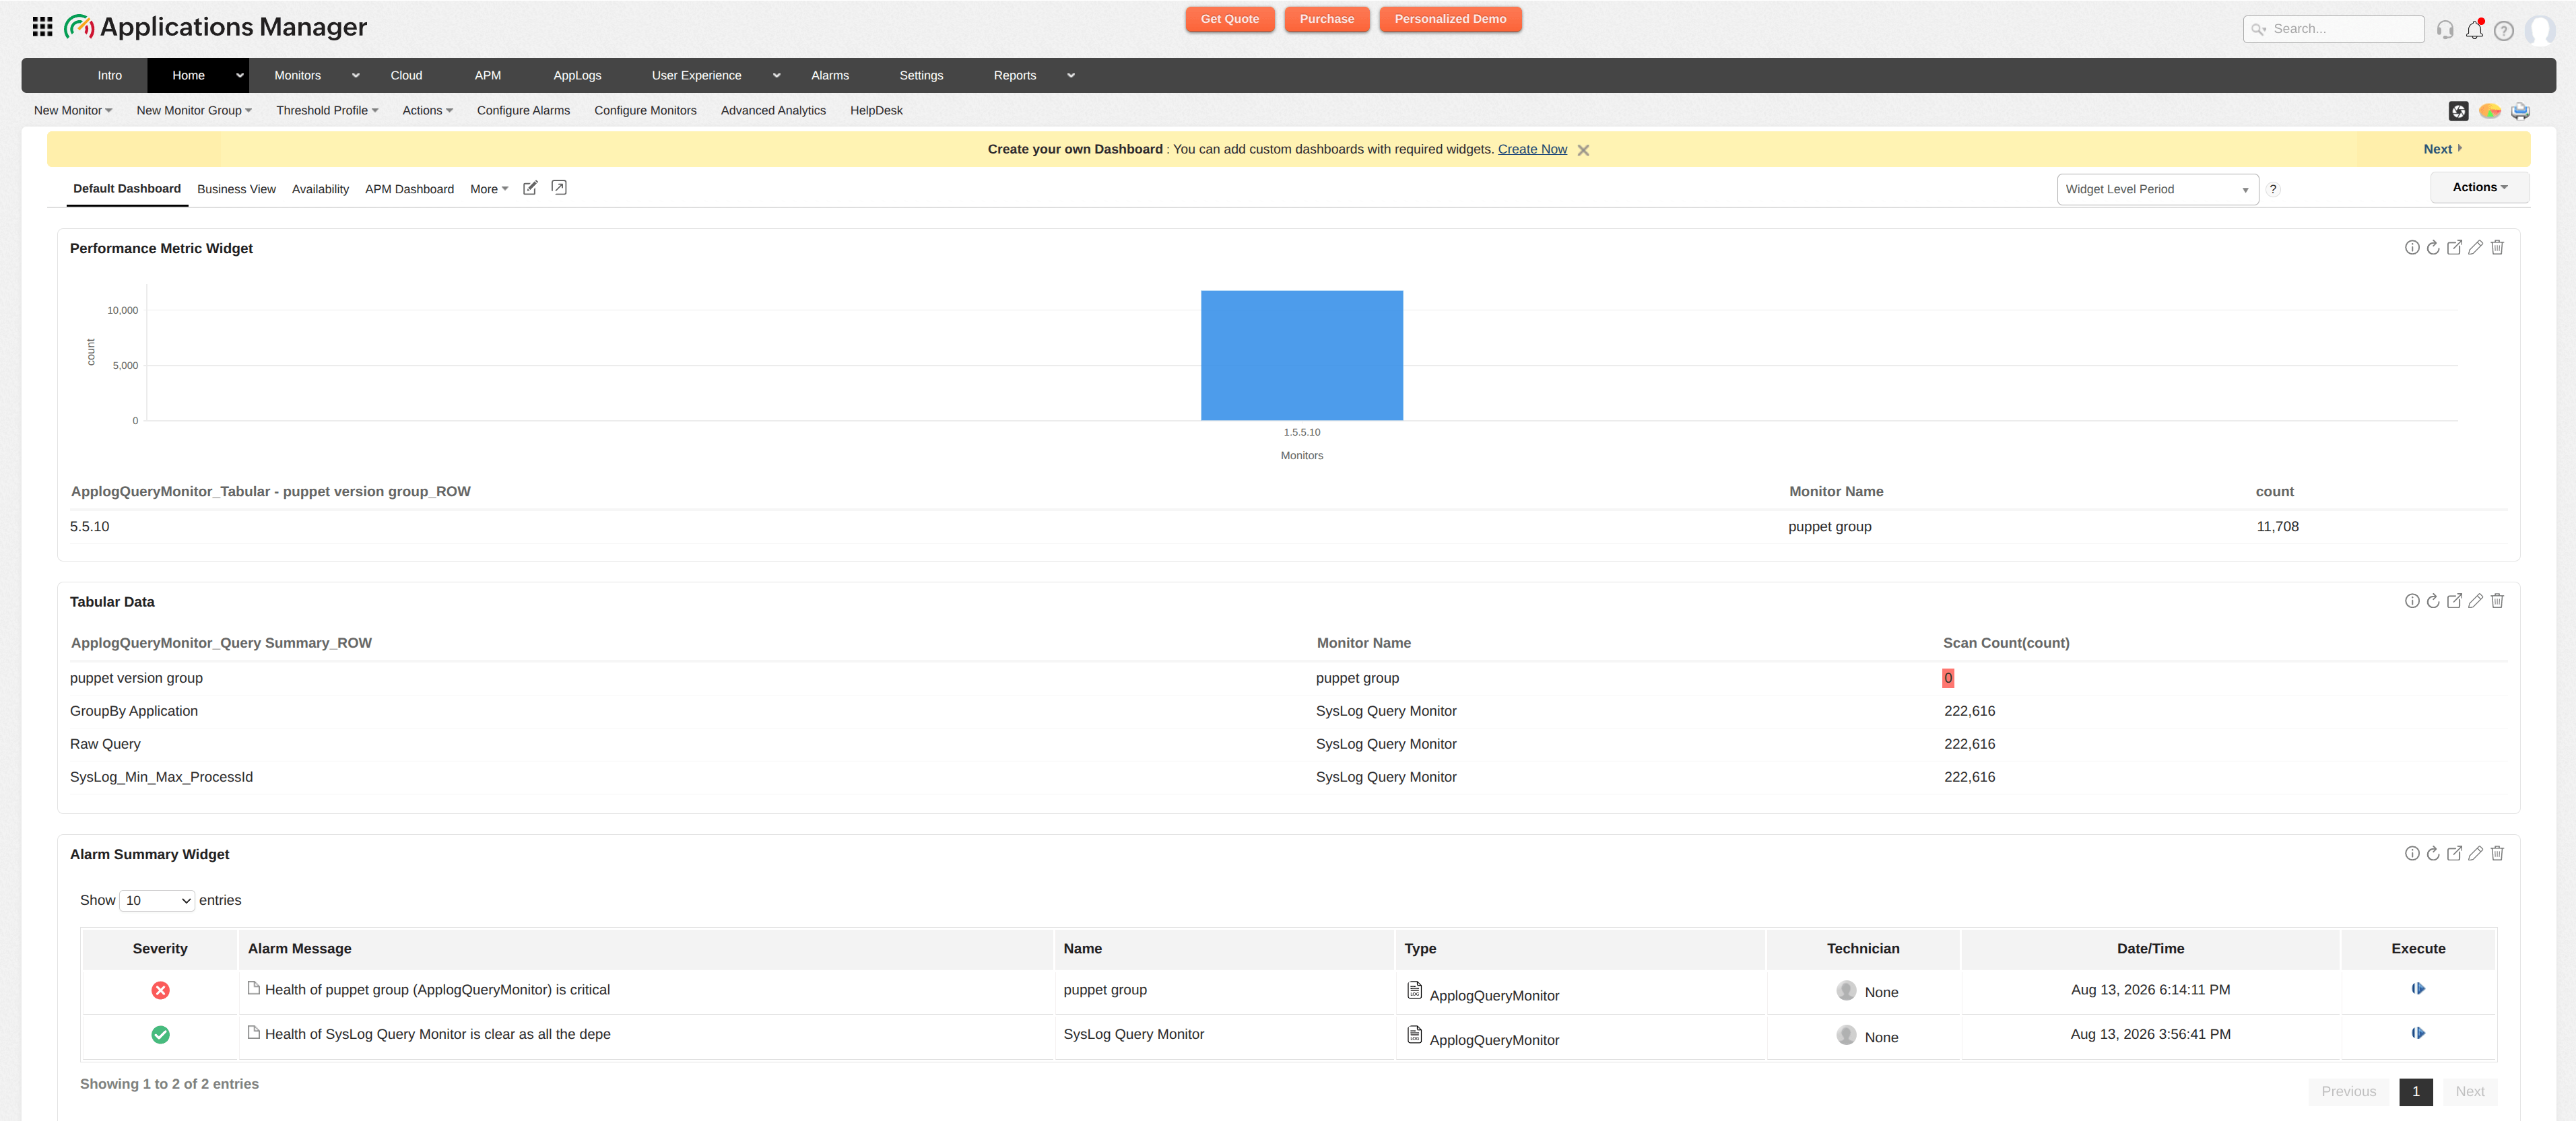
You can also view AppLog Query Monitor data and alarms on dashboards using the Performance Metric, Tabular Data, and Alarm Summary widgets. After saving the monitor configuration, navigate to the dashboard and verify that the widgets display the monitor's collected data, status, and alarm information as expected.
Modifying queries in an existing monitor
- Removing a query: When a query is removed from a monitor, the attributes created for it are deleted. For an aggregation query, its scalar attributes are deleted; for a group by query, its table is deleted.
- Adding a query: Adding new queries to an existing monitor does not affect the queries that are already being monitored.
- Deleting a saved search: A saved search that is associated with an AppLog Query Monitor cannot be deleted. This ensures that queries in use by a monitor are not modified or removed unintentionally.
Note:
- A single AppLog Query Monitor supports a maximum of five saved queries.
- For GROUP BY queries, only the first GROUP BY column is used to identify each row. Combinations of multiple columns as a row identifier are not supported.