What is AppLogs?
AppLogs is a log management capability in Applications Manager that enables you to collect, ingest, search, and analyze logs from applications and servers through a single, unified search interface, the AppLogs Explorer. Logs are collected using the Applications Manager Full Stack Observability (FSO) Agent and are presented in a centralized view, making it easier to correlate and analyze log data across your environment. You can also save frequently used queries and configure alerts on them.
Log monitoring, along with metrics and traces, is a core pillar of observability. AppLogs helps teams gain deeper visibility into system behavior, troubleshoot issues faster, and maintain operational, compliance, and security standards.
Note:
- The AppLogs feature is supported from Applications Manager v179400 and above.
- From v180700 onwards, Applications Manager offers support for the Try Now option, which is a one-time, limited demo usage of AppLogs for registered users without a license, with a default usage limit of 5 GB. Once the limit is reached or the trial is disabled, it cannot be reactivated, and a valid license is required to continue using the feature.
- From v182400 onwards, Applications Manager offers the AppLogs Explorer, saved searches, and alerting on saved searches through the AppLog Query Monitor.
- Why use AppLogs?
- How AppLogs works
- Getting started with AppLogs
- Deploying AppLogs
- What is a Log Type?
- What is a Log Profile?
- Search and analyze logs with the AppLogs Explorer
- Saved searches
- Alert on saved searches
- Stop Log Monitoring
Why use AppLogs?
AppLogs helps you gain actionable insights from logs for the following use cases:
- Troubleshooting and Root Cause Analysis: Correlate logs with performance metrics and alerts to quickly identify the root cause of issues.
- Compliance and Auditing: Maintain an audit trail of application and system activities to meet regulatory and compliance requirements.
- Security and Threat Detection: Detect suspicious behavior, unauthorized access attempts, and security-related events.
- Performance Optimization: Analyze log patterns to identify bottlenecks, inefficiencies, and abnormal behavior that may impact application performance.
- Proactive Alerting: Save frequently used queries and associate them with an AppLog Query Monitor to be alerted when the query results cross the thresholds you define.
How AppLogs works
AppLogs collects logs from monitored servers through the Applications Manager FSO Agent. Once logs are collected, they are:
- Classified based on their associated log type
- Parsed and indexed for faster retrieval
- Made available for searching, filtering, and analysis through the AppLogs Explorer
- Monitored at regular intervals when you associate saved queries with an AppLog Query Monitor, so that alerts are raised on the query results
This enables you to view and analyze logs from multiple applications and servers in one centralized interface.
Getting started with AppLogs
To start using AppLogs in Applications Manager, follow the steps below to configure log collection and analysis:
- Deploy the FSO Agent on the required servers to enable data collection.
- Enable the AppLogs sub-agent within the deployed FSO Agent to allow log monitoring. You can enable AppLogs monitoring in either of the following ways:
- During FSO Agent installation:
- Windows: AppLogs enablement is available as an option in the Windows InstallShield wizard. During the installation process, select the Enable AppLogs Monitoring Agent checkbox to enable AppLogs. No additional configuration is required after installation.
- Linux: While installing the FSO Agent, enable the AppLogs sub-agent using the Enable AppLogs Monitoring Agent checkbox provided in the Linux installation steps in the Applications Manager UI.
- For an existing/onboarded FSO Agent: Navigate to Settings → FSO Agent and enable the AppLogs sub-agent using the SubAgents option (
 ) under the Actions column for an individual agent, or use the Bulk Actions option to enable it for multiple agents at once.
- During FSO Agent installation:
- Select a Log Type that matches the format of your application or system logs. If your log format is not available by default, you can define a Custom Log Type .
- Configure Log Profiles to associate log types with specific log file paths and monitored servers.
- (Optional) Tune AppLogs settings such as retention, ingestion frequency, and indexing behavior based on your requirements.
- (Optional) Save frequently used queries in the AppLogs Explorer and configure alerts on them using an AppLog Query Monitor.
Once these steps are completed, AppLogs automatically begins collecting logs and makes them available for searching, filtering, and analysis through the AppLogs Explorer.
Deploying AppLogs
AppLogs is deployed as a sub-agent within the Full Stack Observability (FSO) Agent of Applications Manager. Once enabled, the AppLogs sub-agent allows Applications Manager to collect and monitor logs from applications and services running on the server.
You can view and manage the AppLogs sub-agent status from the FSO Agent management pages in the Applications Manager UI. The status indicates whether the sub-agent is enabled and shows the last communication time with the server.
To enable the AppLogs sub-agent for an existing/onboarded FSO Agent, follow the steps below:
- Navigate to Settings from the top navigation bar.
- Under Discovery & Data Collection, click on FSO Agent.
- Under the View Agents tab, click on the SubAgents option () of an agent to open the Sub Agent Management panel.
- From the Chosen Agents dropdown, confirm or modify the selected agent(s).
- Click on Enable AppLogs Monitoring.
Once enabled, the AppLogs sub-agent begins reading and forwarding log data from the corresponding servers.

For more information on deploying and managing FSO Agents and sub-agents, refer to the FSO Agent documentation.
What is a Log Type?
A log type defines the format in which an application writes its logs.

Different applications—such as IIS, Apache, Cassandra, and MySQL—generate logs in different formats. Defining these formats as log types helps AppLogs:
- Correctly parse log entries
- Group logs from similar applications
- Enable faster and more accurate searching
If an application’s log format is not available by default, you can create a custom log type to suit your requirements.
Supported Log Types

AppLogs includes 60+ predefined log types for commonly used platforms and services, including:
- IIS and Apache access and error logs
- Windows Event Logs
- Kubernetes audit and pod logs
- Database logs such as MySQL, PostgreSQL, and SQL Server
- Middleware and application framework logs
These predefined log types allow you to start collecting and analyzing logs quickly with minimal configuration.
Custom Log Types

Custom log types allow you to define log formats for applications or services that generate logs in non-standard or unique formats.
This is especially useful in environments such as:
- Microservices-based architectures
- Custom-built or niche applications
- Applications with proprietary logging formats
By defining a custom log type, you ensure that logs are parsed correctly and remain searchable and easy to analyze.
What is a Log Profile?
A log profile associates a log type with specific log sources such as files or directories.

Log profiles define:
- Which logs should be collected
- How long logs should be retained
- Collection limits and advanced collection settings
Using log profiles, you can efficiently manage log collection across multiple servers and applications.
Search and analyze logs with the AppLogs Explorer
The AppLogs tab has two views. The Explorer view provides a centralized interface to search and explore your application logs, and the Dashboard view shows your saved searches as widgets.
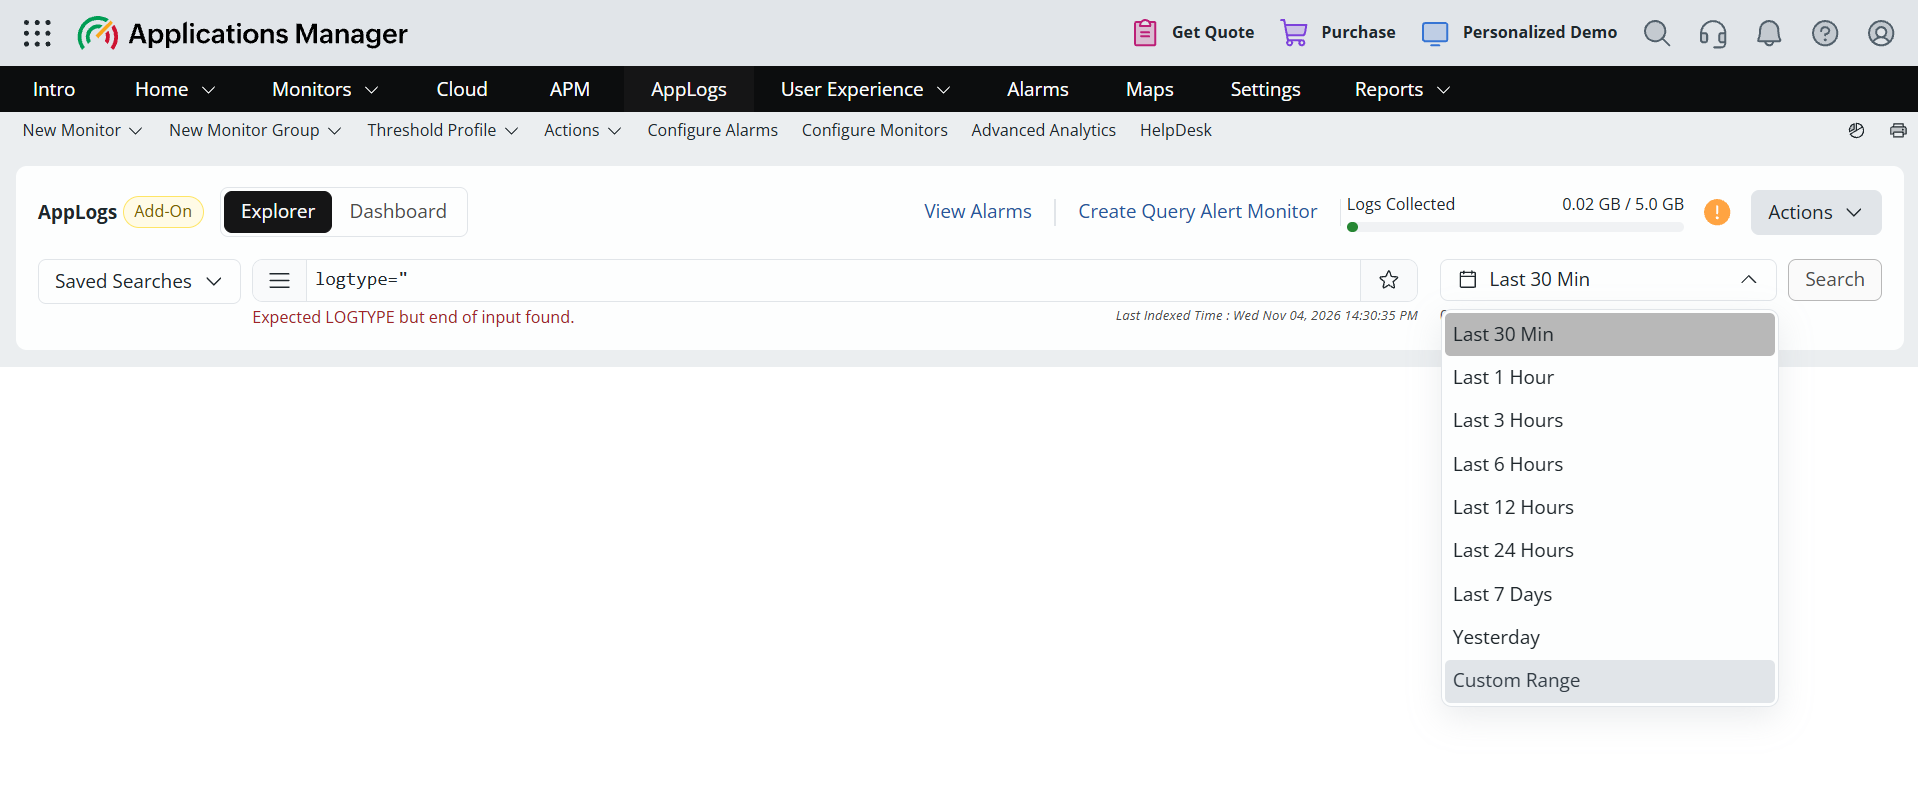
With the Explorer, you can:
- Search logs using keywords and structured fields
- Filter logs based on time range and other available fields such as source, host/IP address, response code, severity, exception, error, and more
- Run advanced queries, including aggregations and grouping, to narrow down results
- View aggregation and group-by query results as graphs
- Perform quick investigations during incidents
- Save queries for future use and quickly access recently executed queries
These capabilities help you move from raw log data to meaningful, actionable insights.
For more information, refer to the AppLogs Explorer documentation. For the operators and sample queries you can use, refer to the log query language reference.
Saved searches
If you run the same queries again and again, save them. A saved search, also called a saved query, lets you run a query without typing it again, keeps the queries you rely on in one place, and can be turned into a dashboard widget or an alert.
Saved searches help you:
- Save time: Run frequently used queries, such as the number of audit failures or the entries per server, in a click.
- Stay consistent: Run the same query every time you check a metric, so that the results are comparable over time.
- Visualize results: Choose a chart type (bar, line, or area) when you save a query, and see it as a widget on the AppLogs Dashboard or on your custom dashboards.
- Get alerted: Use a saved search as the basis for alerting.
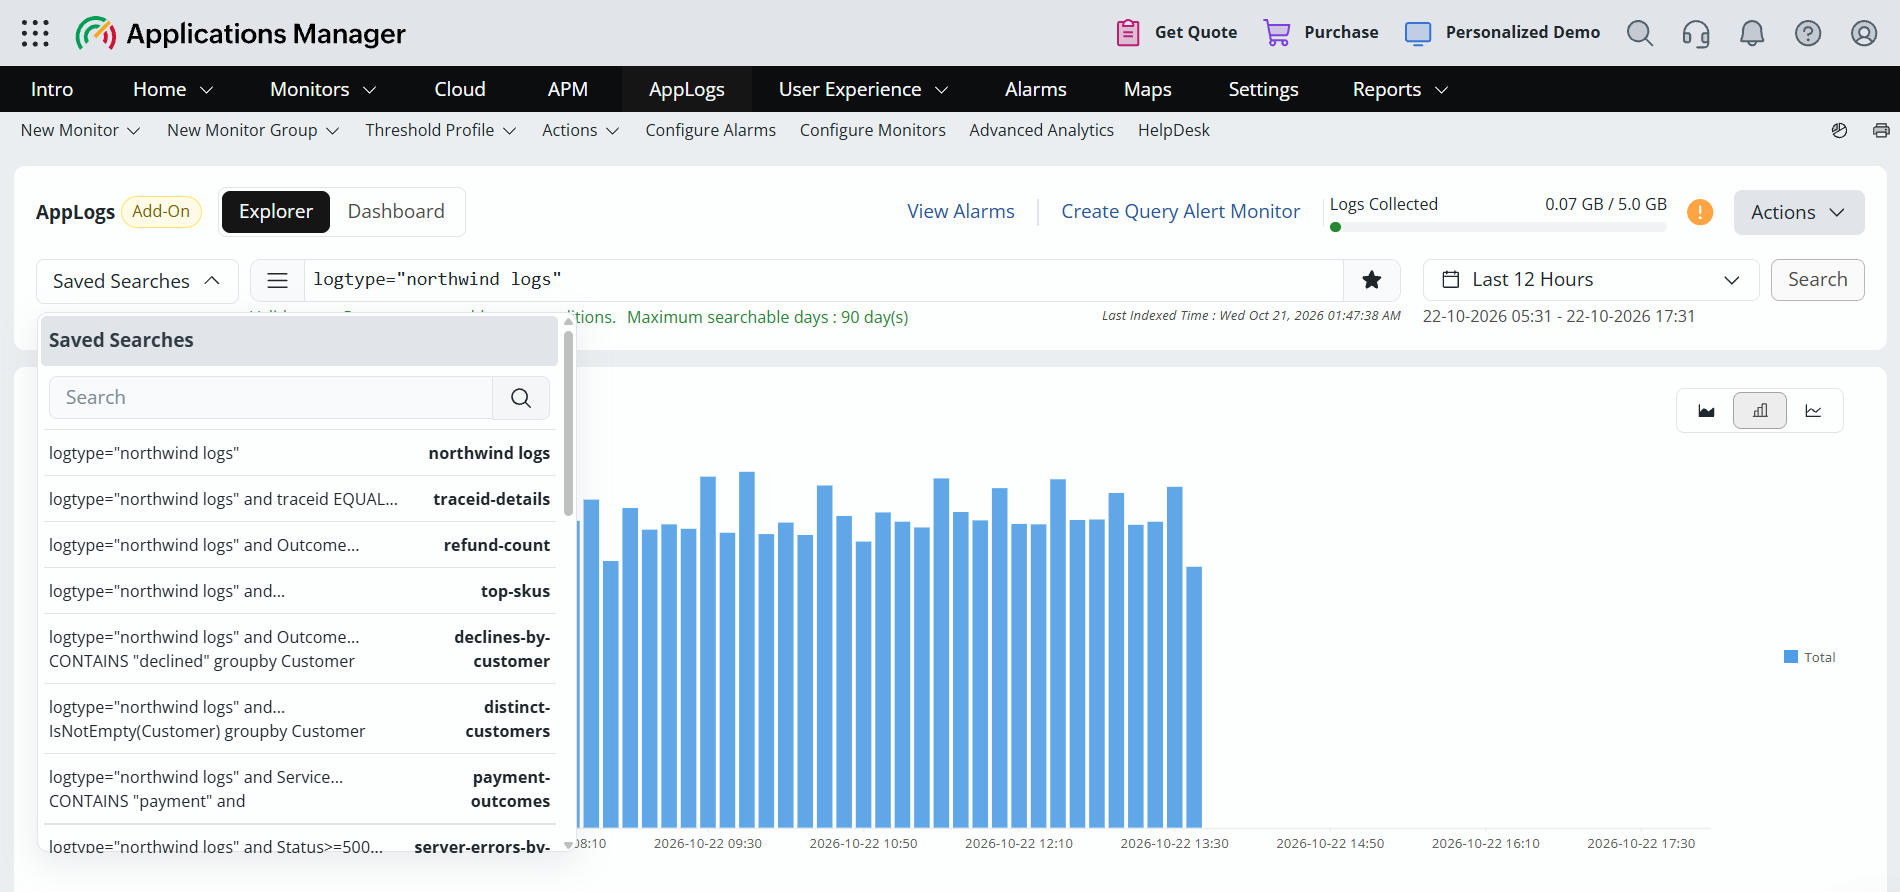
To save a search, enter a query in the Explorer, click the star icon, enter a name, choose a chart type, and click Save. The Explorer also keeps your most recent queries so that you can run them again. For the complete steps, refer to Saved searches and Recent searches in the AppLogs Explorer help.
You can see all your saved searches in the following places:
- AppLogs tab: In the Explorer view, select the Saved Searches drop-down at the left of the search bar to list and run your saved searches. The Dashboard view shows them as widgets.
- Settings tab: Navigate to Settings > Discovery & Data Collection > AppLogs Configuration, and open the Saved Searches tab.
Alert on saved searches
Turn a saved search into an alert with the AppLog Query Monitor. The monitor runs your saved queries at the polling interval you set, exposes the results as monitor attributes, and raises an alarm when the thresholds you configure are violated.
- Monitor up to five saved queries from a single monitor, each alerted on independently.
- For group-by queries, each group is monitored as its own row, so you can see exactly which group needs attention.
- Run the queries only against specific servers or monitor groups.
- View the generated alarms from View Alarms in the AppLogs tab, or from the Alarms tab.
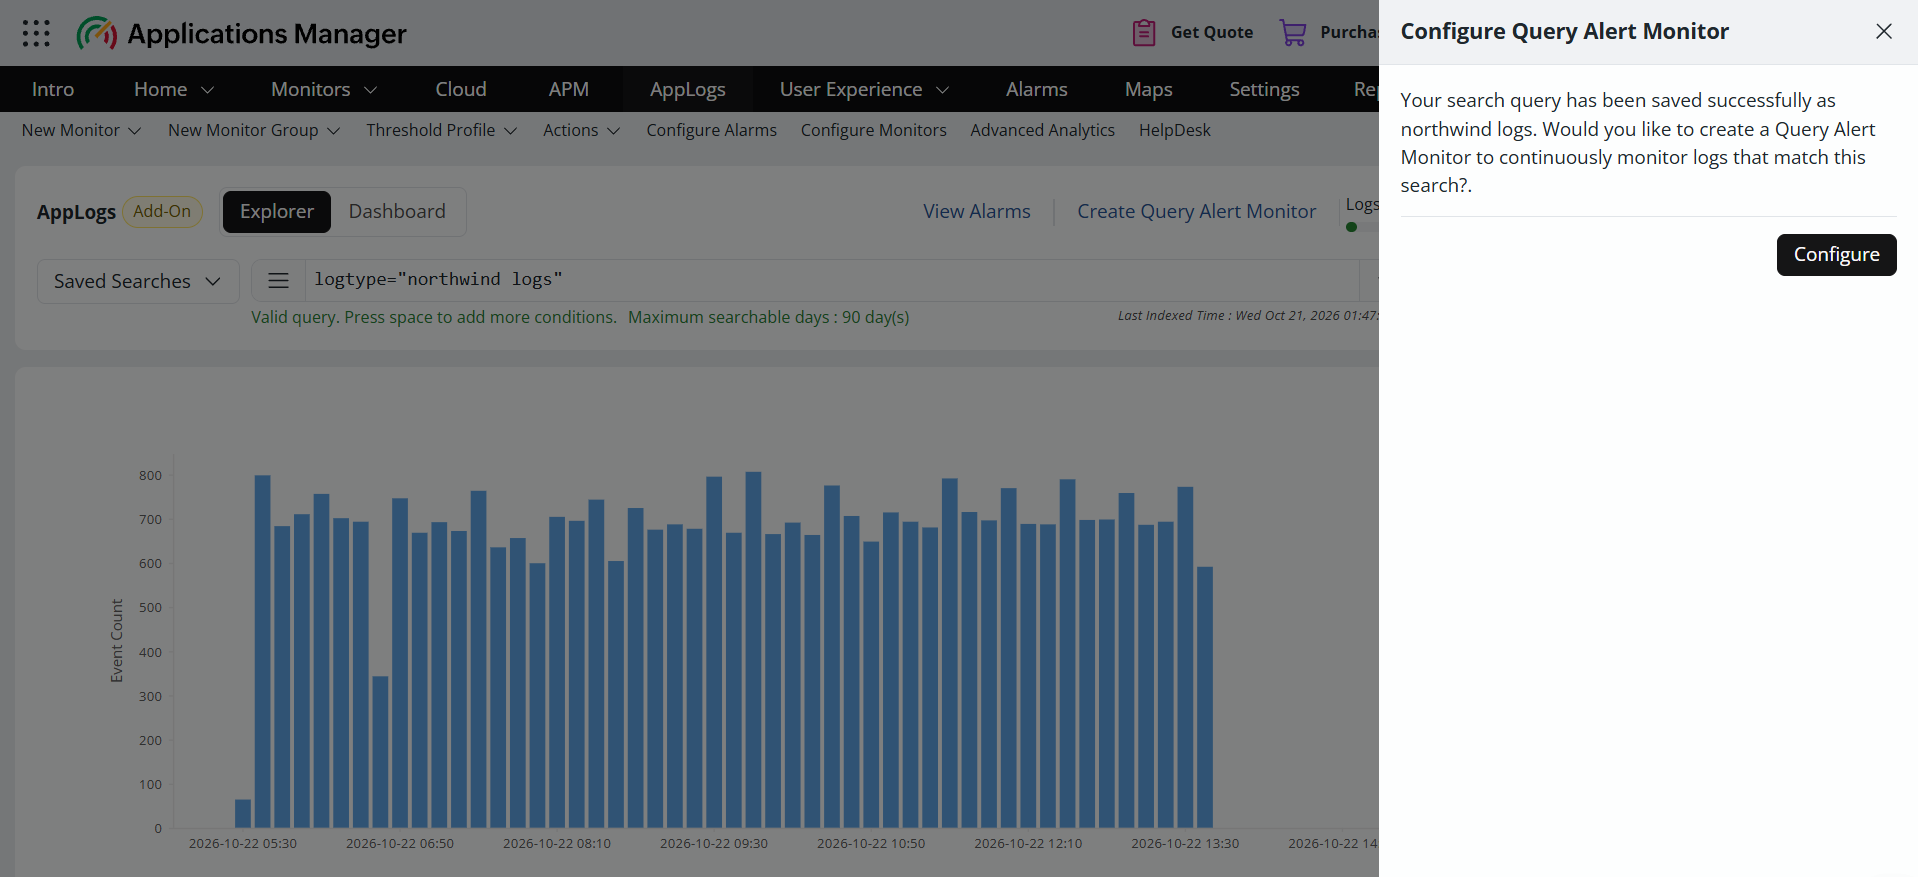
To get started, save a query and click Configure in the Configure Query Alert Monitor panel that appears, or click Create Query Alert Monitor in the AppLogs tab. This opens the AppLog Query Monitor bulk configuration page, where you can create a monitor or add the query to an existing one.
For more information, refer to:
- AppLog Query Monitor for the steps to create a monitor, configure alarms, and view alarms
- Alerting on saved log searches in the AppLogs Explorer help
Stop Log Monitoring
In Applications Manager, AppLogs monitoring can be stopped only by disabling the AppLogs sub-agent on the required servers. Existing log data is retained and not removed.
You can disable the AppLogs sub-agent from the FSO Agent management page by navigating to AppLogs→Actions→Deploy Agent→ selecting the SubAgents option for an agent, and clicking Disable.

- Disable for individual agents: Disable the AppLogs sub-agent for a single agent.
- Bulk disable AppLogs sub-agent: From the Sub Agent Management window, select multiple agents using the Chosen Agents dropdown (Select All Agents or search-based selection) and disable the AppLogs sub-agent in one action.
Once disabled, the agent stops reading and sending log data from the corresponding servers.