Capacity Planning Widgets
Capacity Planning Widgets help you analyze historical resource utilization data and classify monitored resources, such as applications, databases, and infrastructure, into three categories based on configurable threshold rules: undersized, oversized, and idle.
These widgets are available under the Capacity Planning category in the Add Widgets panel on any dashboard.
- Undersized Monitors Widget
- Oversized Monitors Widget
- Idle Monitors Widget
- Configuring the Capacity Planning Widget
- Viewing widget results
- Supported monitor types
Undersized Monitors Widget
Displays monitors where resource utilization is consistently high, indicating the resource is running at or near capacity and may need to be scaled up.
Oversized Monitors Widget
Displays monitors where resource utilization is consistently low, indicating the resource is over-provisioned and can be downsized or decommissioned.
Idle Monitors Widget
Displays monitors where resource utilization is negligible, indicating the resource is essentially unused and is a strong candidate for decommissioning.
Configuring the Capacity Planning Widget
- Navigate to the Home tab, click Actions, and click Add Widgets.
- Select the required widget type from the Capacity Planning category and click Add.
- Click the Edit (pencil) icon on the widget.
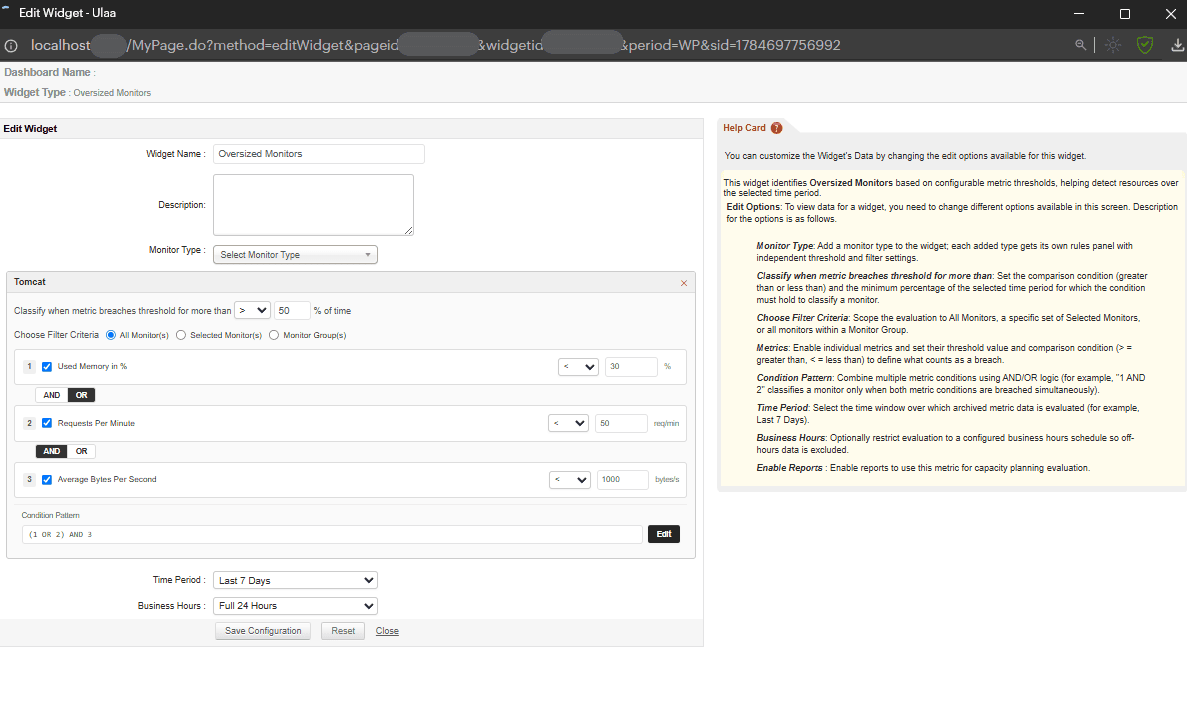
- Select a Monitor Type, for example Apache, EC2 Instance, MSSQL, or Tomcat.
- Choose the metrics to evaluate, such as CPU, memory, or connections.
- Select a Time Period: Last 24 Hours, Last 7 Days, or Last 30 Days. Optionally, select a Business Hours profile to restrict the analysis to working hours.
- Click Save.
Configuration options
| Option | Description |
|---|---|
| Monitor Type | Add a monitor type to the widget. Each added type gets its own rules panel with independent threshold and filter settings. |
| Classify when metric breaches threshold for more than | Set the comparison condition (greater than or less than) and the minimum percentage of the selected time period for which the condition must hold to classify a monitor. |
| Choose Filter Criteria | Scope the evaluation to all monitors, a specific set of selected monitors, or all monitors within a monitor group. |
| Metrics | Enable individual metrics and set their threshold value and comparison condition (greater than or less than) to define what counts as a breach. |
| Condition Pattern | Combine multiple metric conditions using AND/OR logic. For example, "1 AND 2" classifies a monitor only when both metric conditions are breached simultaneously. |
| Time Period | Select the time window over which archived metric data is evaluated, for example Last 7 Days. |
| Business Hours | Optionally restrict evaluation to a configured business hours schedule so off-hours data is excluded. |
| Enable Reports | Enable reports to use this metric for capacity planning evaluation. This option is displayed only when reports are disabled for the metric. In the Enterprise Edition, reports cannot be enabled from the Central Server, so they must be enabled from one of the Probe Servers. |
Viewing widget results
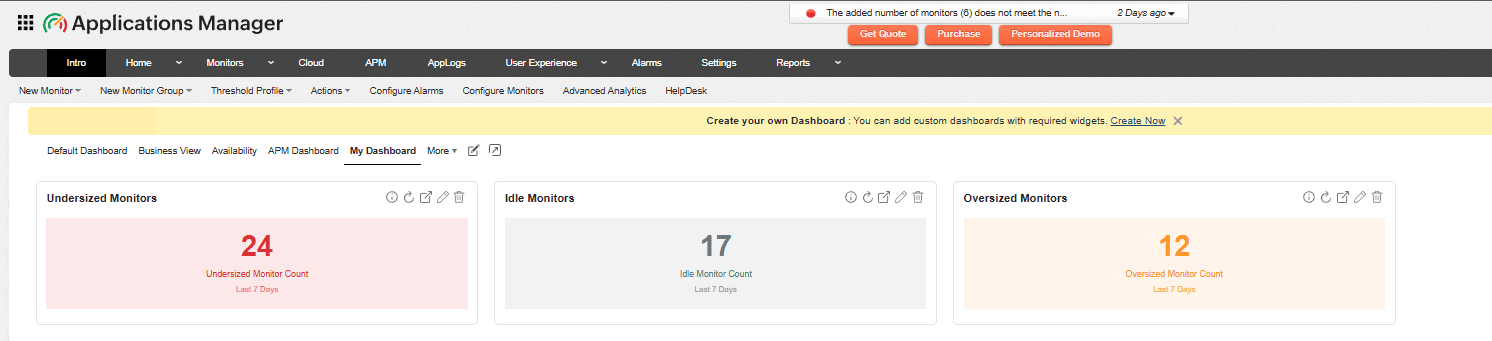
- The widget tile displays the number of monitors that match the selected classification, for example the count of undersized monitors.
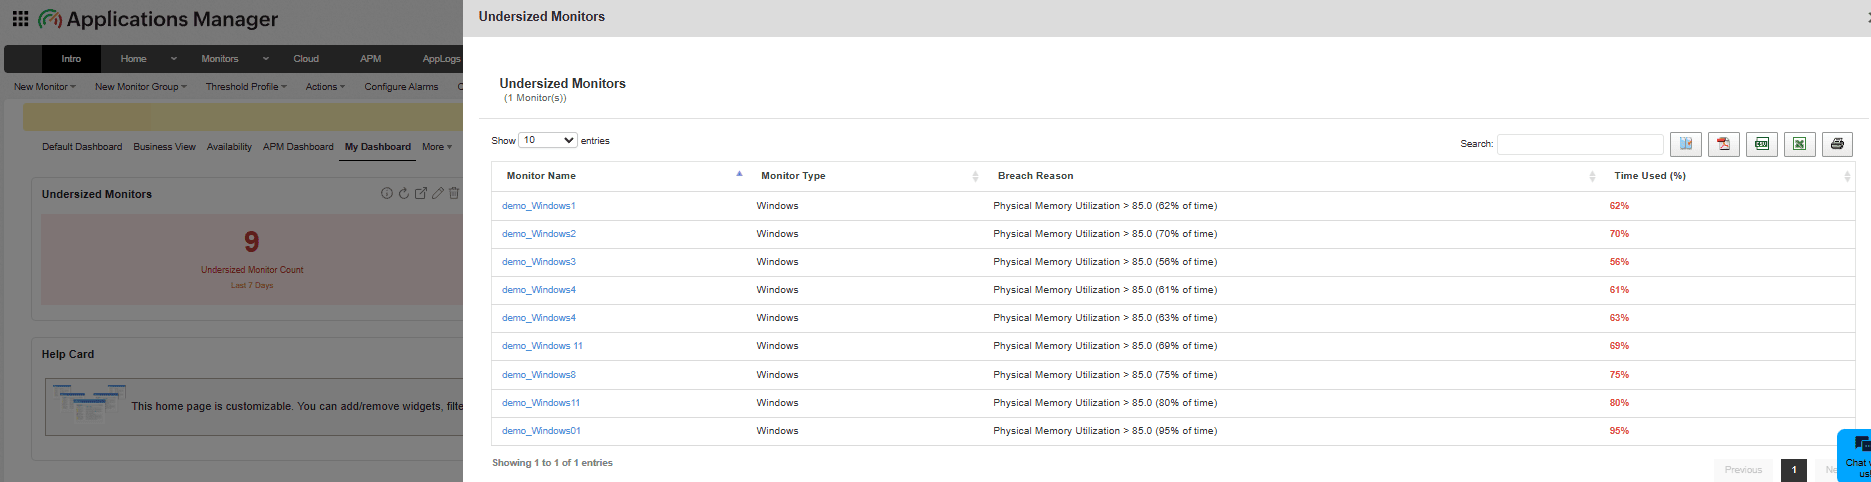
- Click the tile to view a drill-down table listing the Monitor Name, Type, Breach Reason, and Time Breach % for each monitor.
- Review this list to identify resources that require capacity adjustments, and click a monitor name to open its Monitor Details page.
- Use the export option to download the data as a PDF or CSV file.
Supported monitor types
| Category | Monitor types |
|---|---|
| Applications | Apache Server, Tomcat Server, Active Directory, Exchange Server, WebSphere, WebLogic, Nginx, APM Insight Application |
| Databases | MS SQL, Oracle, MySQL, PostgreSQL, MongoDB, Redis, Cassandra, Azure SQL Database, Azure Database for MySQL Server, Azure Database for PostgreSQL Server, Azure SQL Elastic Pool, Azure SQL Managed Instance |
| Infra | EC2, Compute Engine, RDS |
| Server | Windows, Linux |
| Virtualization | VMware ESX/ESXi, Hyper-V Server, KVM, Citrix Hypervisor, RHEV Host, Oracle VM Server, Docker Container, Kubernetes, OpenShift |