Dashboards and Widgets
- Dashboards
- Custom Dashboards
- Creating a new Dashboard
- Widgets
- Widget and Dashboard Actions
- Topology Map view
- Business View
- NOC View
Dashboards
Applications Manager comes with four Dashboards - Default Dashboard, Business View, Availability, and Application.
Business Dashboards:
Configure your business metrics like customer wins, revenue, etc. It helps the Manager to align IT with business needs.
Application Dashboards:
Get a complete view of your application's performance and user experience with the Application Dashboard. By combining data from APM Insight and Real User Monitoring (RUM), it provides a unified summary of backend and user-level performance. Simply select the relevant monitors to visualize key performance data in one streamlined interface.
- The Application Dashboard is only supported from Applications Manager version 173200.
- It is not currently supported in the Central Server installation.
Monitor Group Template Dashboards:
After configuring a dashboard, you can save the settings as a monitor group template. This monitor group template can then be applied to other monitor groups, thereby it becomes easier to create dashboards for monitor groups.
Custom Dashboards
By using the Custom Dashboards feature, you can create Dashboards of your choice - like Status View of all the Databases, Status view of all Web Applications deployed in the Tomcat Server. By adding the different widgets given, custom dashboards can be created.
This is in addition to the already created three Dashboards - Default Dashboard, Business View, and Availability.
Creating a new Dashboard
- Under the Home tab, click on the New Dashboard link. It opens up the Create New Dashboard page.
- Enter the Dashboard Name and Description.
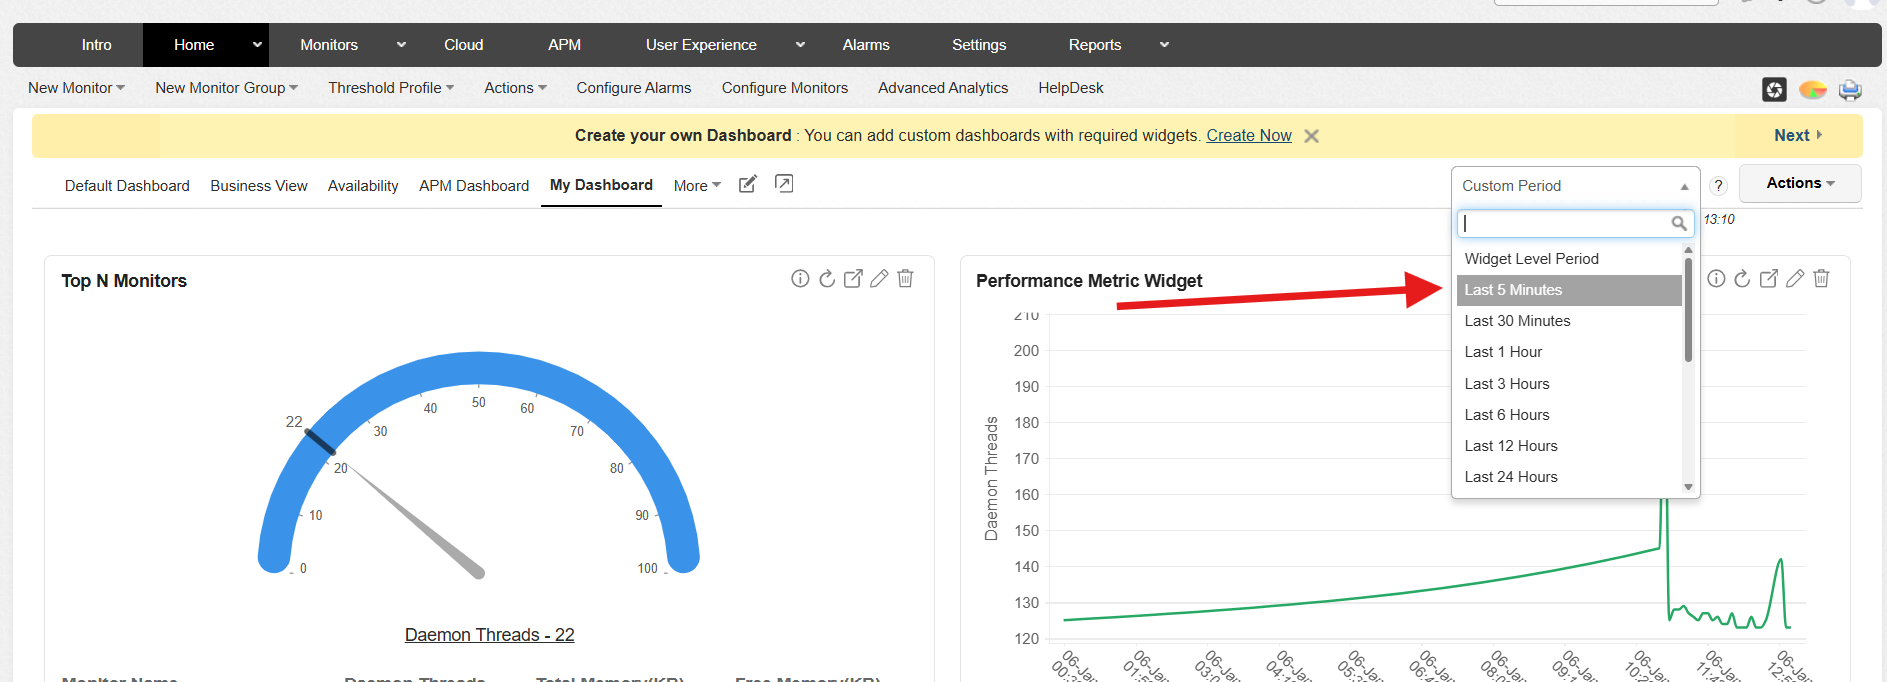
- Select a time period from the dropdown. (i.e; Last 5 minutes, Last 30 minutes, Last 1 Hour, etc.) You can also specify the custom time period by entering the required date and time range in the dropdown.
- You can save the dashboard settings as a template and apply it to monitor groups. You have the option of applying the template to specific monitor groups or applying it across all the monitor groups.
- Then from the Widget list, you can choose the widgets you want to add.
- You can use Associate Users to associate or restrict Dashboards to certain users. Select All Users and Roles will assign Dashboards to all users of all roles. By selecting All you can associate the Dashboard with all the future users of a particular role.
- Click on Create. The new dashboard would be created with your choice of widgets.
- When you add a widget to the Dashboard, an empty widget will be added with an option to edit it. Click on the edit widget icon and change the filter criteria for the widget until you get the desired data for the widget.
Widgets
Below is the list of widgets that are supported in Applications Manager:
- Users of build 170300 and above can choose to integrate selected widgets into their web portal by clicking the Publish Widget button and utilizing the code snippet that appears in the popup.
- We do not support the publishing of widgets while SSO is enabled.
Performance Widgets
- Top N Monitors: This widget displays Top N monitors based on a performance metric.To view the data, select a performance metric and select the monitors from which Top N should be listed. You have the option to view the graph for the selected time period.
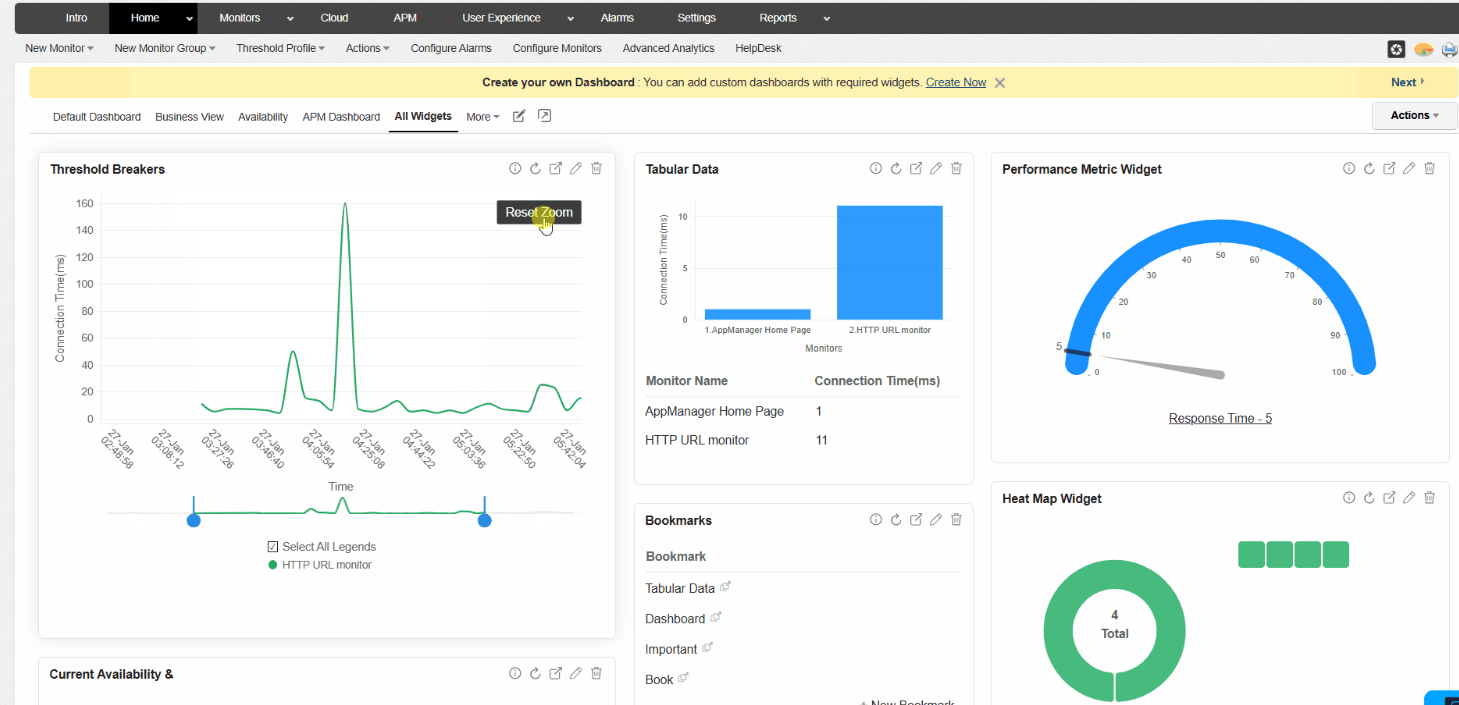
- Performance Metric Widget: This widget displays the Snapshot value of a specific Monitor's performance metric. You have the option to view the graph for the selected time period.
- Threshold Breakers: This widget displays all the monitors which have exceeded the threshold for a performance metric. You have the option to view the graph for the selected performance metric.
- Tabular Data: This widget displays values in a tabular format, and packs more data in a smaller area.
- Topology Map View: This widget displays the interconnection of different resources in your enterprise on a map and also associates links between them. You can use the Topology Map widget to view, say, a small number of your available devices and servers that are spread across the globe or in different locations. Know More about the Topology Map View and how to create one.
Availability and Health Widgets
- Infrastructure Snapshot: This widget gives you a snapshot of the availability and health of monitors grouped by Monitor Type.
- Availability & Health Status: Multiple Monitors: This widget lets you view the snapshot of monitors of a specific type.
- Last 24 Hours / 30 Days Availability History: This widget displays the Availability history for the last 24 hours / 30 days for all monitors of a selected type.
- Last 24 Hours / 30 Days Health History: This widget displays the Health history for last 24 hours / 30 days for all monitors of the selected type.
- Availability, Health, and Alarm Summary: This widget displays the Availability, Health status, and Alarm status for the selected Monitor category.
- Heat Map Widget: This widget displays the severity status for the Health and Availability of selected monitors in various coloured boxes, each representing the severity status of specific monitors. You also have the option to display the summary chart of all the selected monitors which allows you to quickly grasp the state and impact of monitors in the form of a pie chart.
- Monitor Status Overview: This widget displays the overall status based on the availability of selected monitors in different colors, each representing the availability status, along with the overall monitor count in the form of a pie chart.
- ADDM Dependency Map: This widget displays the visual map view of the servers and their associated applications that are available and connected to the selected Dependency Map.
- Monitors under Downtime Schedules/Unmanaged Widget: This widget displays the list of monitors for which downtime schedules have been assigned and shows whether the monitors are currently in scheduled maintenance or unmanaged state.
- Server Uptime Widget: This widget displays the uptime duration of available servers.
Alarms
- Alarm Summary Widget: This widget displays alerts for all monitors and monitor groups.
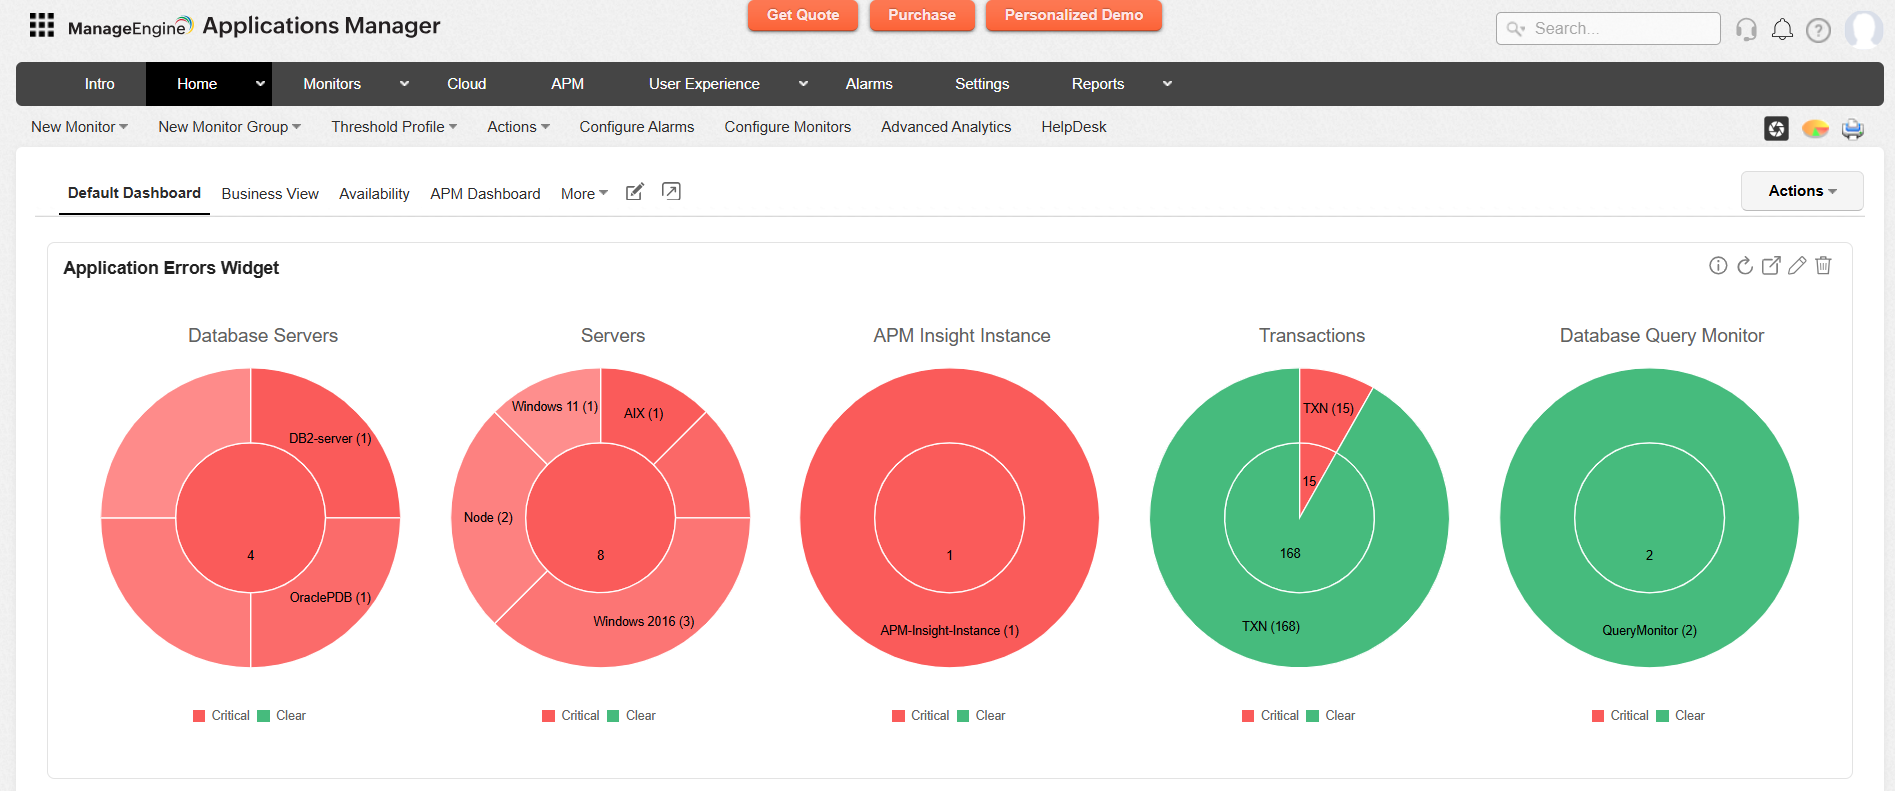
- Application Health Summary:The Application Health Summary Widget provides a comprehensive view of event data across various monitor groups and categories. The Sunburst chart offers a high-level overview of events categorized by severity and monitor type, while the drill-down feature enables users to click on specific monitor types to view detailed information about each monitor’s events.Widget Views:
- L0 - Chart View: Displays a Sunburst chart that visually represents the distribution of events based on severity and monitor type, organized by category. This hierarchical breakdown makes it easier to assess overall system health at a glance.
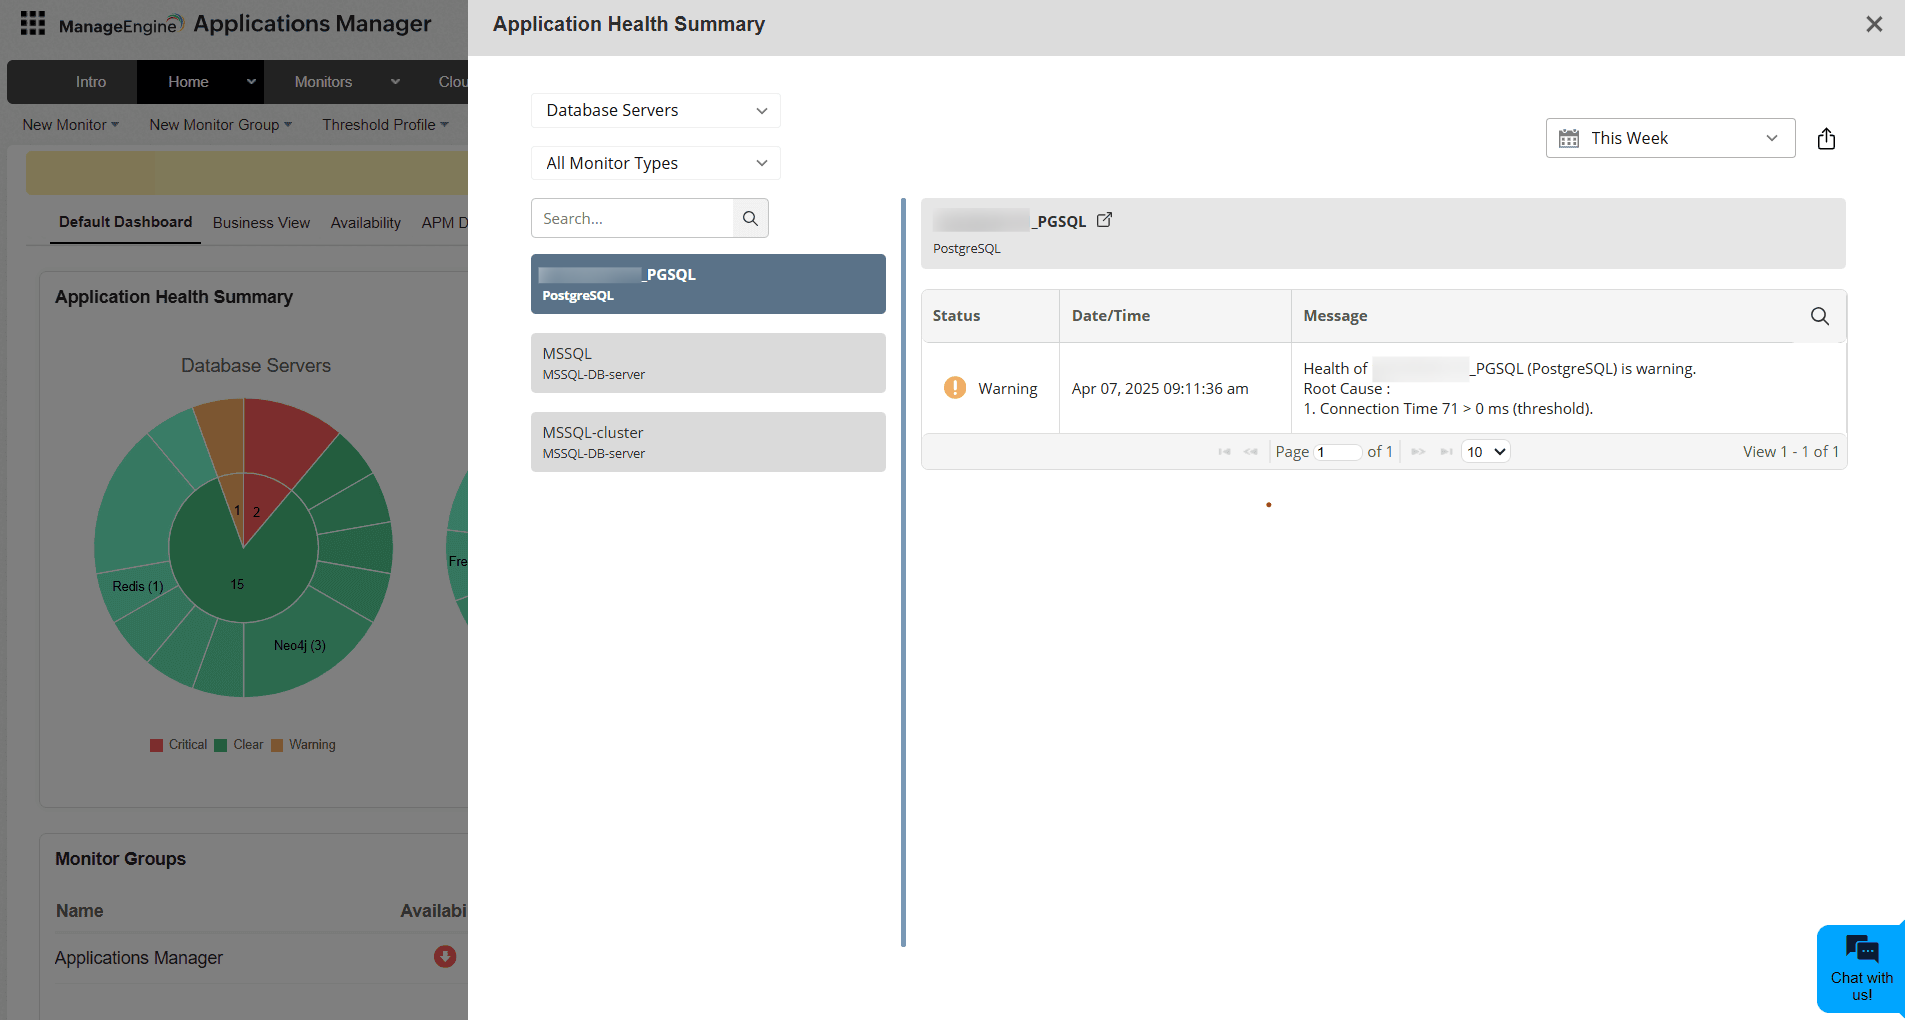
- L1 - Drill Down View: Allows users to click on any monitor type segment in the Sunburst chart to access detailed information about the specific monitor’s events for deeper investigation.
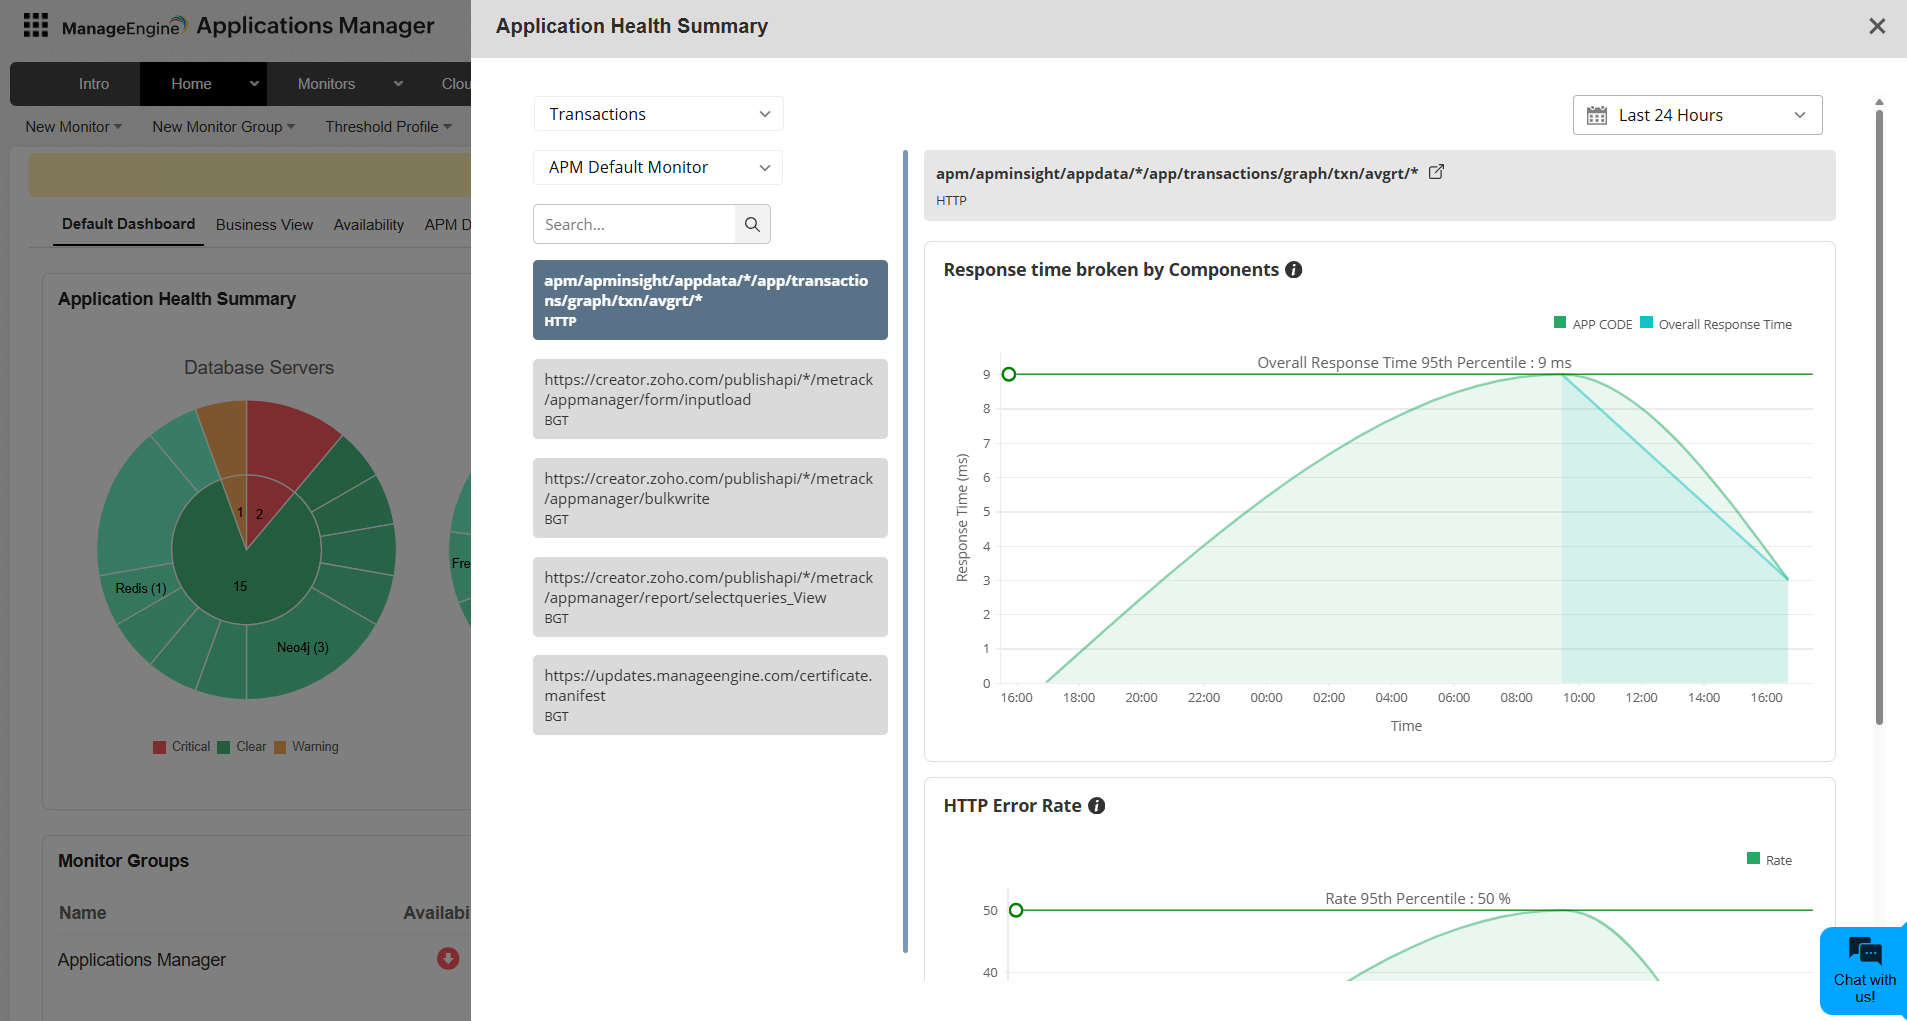
- APM Insight - Transactions Drill Down
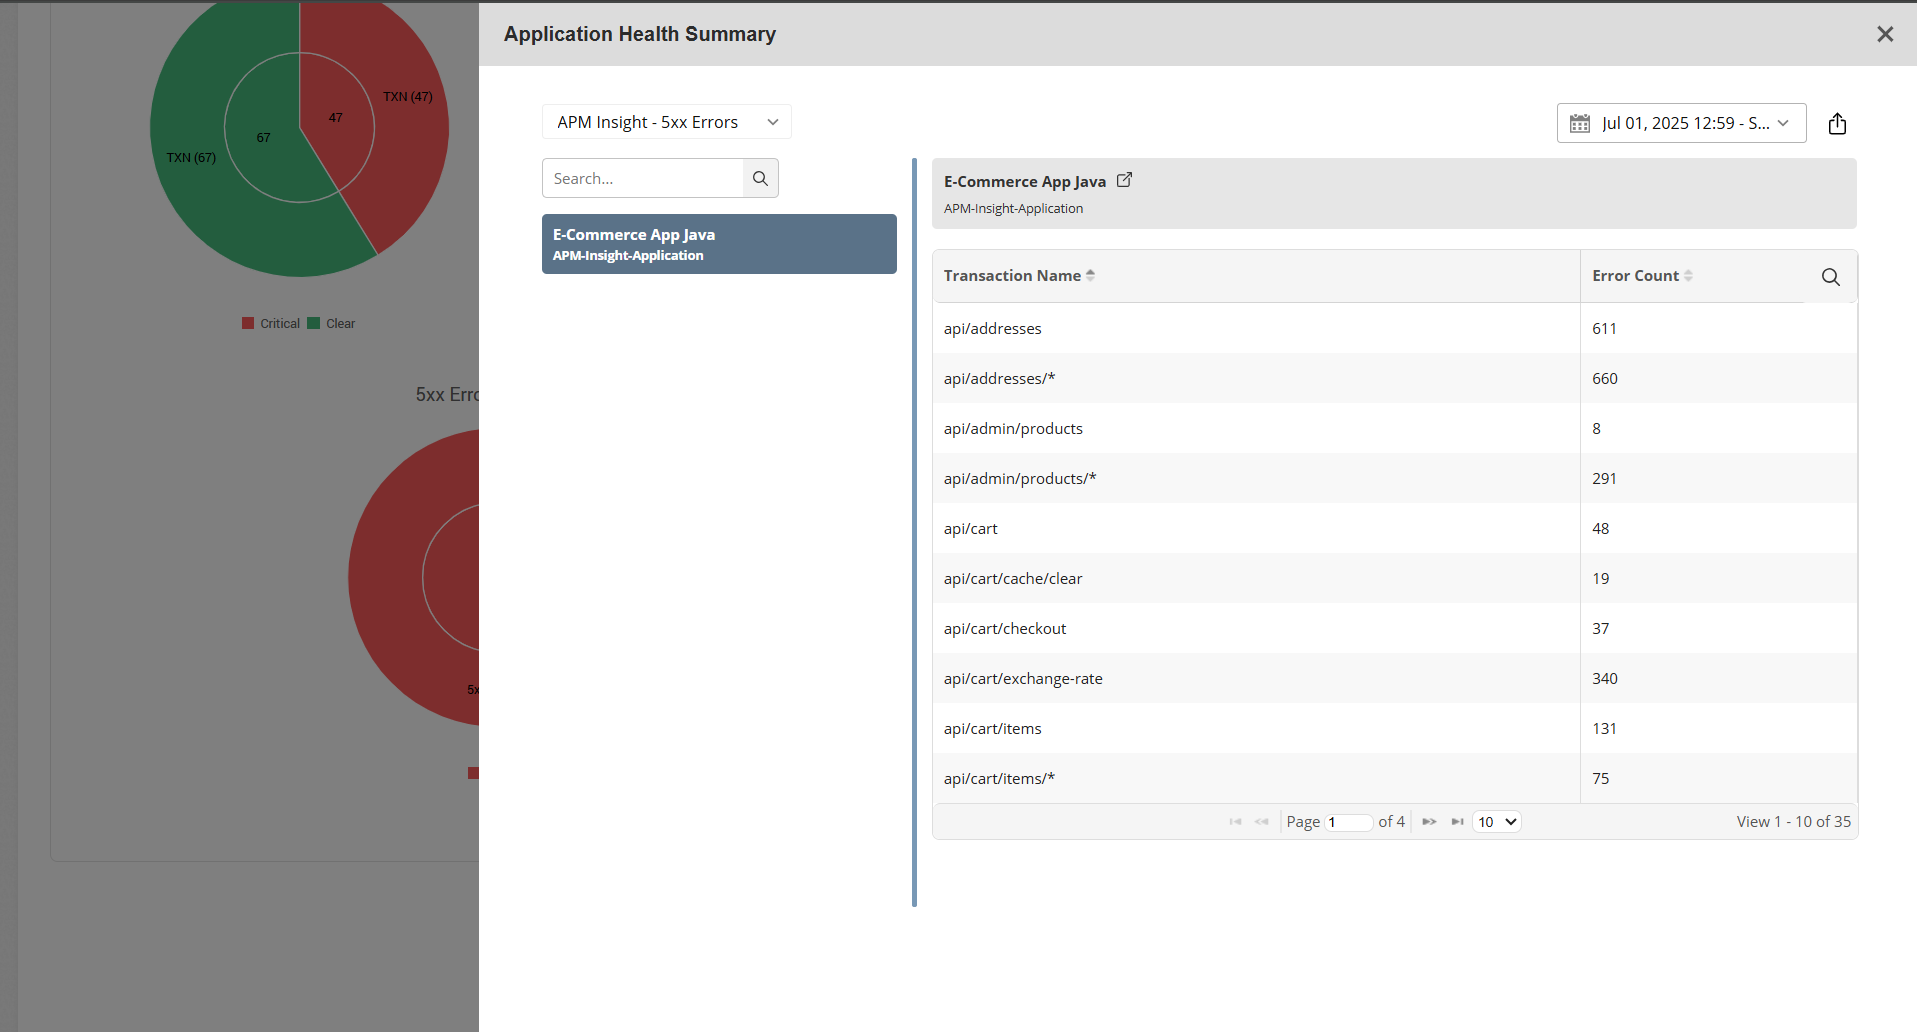
- APM Insight - 4xx/5xx Errors Drill Down
- Monitor Group: Single select option for choosing a specific monitor group.
- Severity: Clear, Critical, Warning.
- Category: APM Insight - 4xx Errors, APM Insight - 5xx Errors, APM Insight - Transactions, APM Insight Instance, Custom Queries, Database Servers, Servers.
- Time Filter: Choose the desired time range, from the last 5 minutes to a custom period.
- Transaction Category: By default, 'All Transactions' is selected. If 'Key Transactions' is selected, only transactions marked as key are shown.
- Response Time: Apply a response time threshold to display only transactions that meet the specified criteria (supports up to two decimal places).
- Error %: Filter and display only transactions that match the specified error percentage criteria.
- L0 - Chart View: Displays a Sunburst chart that visually represents the distribution of events based on severity and monitor type, organized by category. This hierarchical breakdown makes it easier to assess overall system health at a glance.
- Attributes Alarm Widget: This widget displays the severity of Health, Availability, and Attributes, along with the threshold configuration of all MOs based on the widget configuration. It contains information about the Status, Alert message, Attribute name, Monitor name, Modified time, and Duration, along with some actions.
- Last N Alarms: This widget displays the last N alarms for all the monitors.
- Monitor Errors Status Widget: This widget displays the status and time duration taken to perform data collection of selected monitors, along with its Success/Error message and Last polled time. Also, you have the option to display the summary chart of all the selected monitors which allows you to quickly grasp the data collection status of monitors in the form of a pie chart.
- Monitors by Status and Downtime Widget: This widget shows the health and availability status of all monitors that are down for a certain time duration.
Monitor Group Widgets
- Availability and Health Status: This widget displays all the Monitor Groups Availability and Health snapshots and the last 24 hours' availability.
- Last 24 Hours / 30 Days Availability History: This widget displays the Availability history for the last 24 hours / 30 days for all Monitor Groups.
- Last 24 Hours / 30 Days Health History: This widget displays the Health history for last 24 hours / 30 days for all Monitor Groups.
- Business View Widget: This widget displays the Business View of the Monitor Groups. Learn more about Business View
- Monitor Group Tree View: This widget displays a hierarchical tree view of the list of Monitor Groups and their associated Monitors that are present in the environment, along with their health and availability status.
- World Map View: This widget displays the Monitor Groups, and Sub Groups in a map view provided location has been assigned to the respective groups.
Utility Widgets
- Embed Web Page: This widget allows you to include a web page from another application in your dashboard. You can use this widget to integrate your custom dashboards.
- Bookmarks: This widget allows you to add web links to important documents, and KBase articles.
- Custom HTML or Text: This widget allows you to add notes to your operator.
Note: Custom HTML or Text widget might be editable by Delegated Admin users. Adding custom HTML scripts will render them directly within the widget, which could affect functionality or display. Ensure scripts are safe and tested before use.
Widgets specific to Application Dashboard
- Top N Slow Transactions: This widget displays the top 5 transactions with the longest response times, captured using APM Insight over the last 6 hours.
- Top N Slow DB Queries: This widget shows the top 5 database queries with the longest execution times, captured using APM Insight over the last 6 hours.
- Top N Errors: This widget displays the top 5 exceptions that have occurred most frequently, captured using APM Insight over the last 6 hours.
- Requests - Success Rate: This widget provides a funnel view of the total number of requests compared to the number of requests without exceptions, captured using APM Insight over the last 6 hours.
- User Satisfaction - World Map View: This widget displays the country-wise Apdex score of the application plotted on a world map, captured using RUM over the last 6 hours.
- Apdex Score: This widget displays the Apdex score from APM Insight and RUM monitors for the last 6 hours.
- User Sessions: This widget shows the total user sessions captured using RUM, comparing the count from the last 24 hours against the average of the last 7 days.
- Failed Requests: This widget displays the total number of failed requests captured using APM Insight, comparing the count from the last 24 hours with the average over the last 7 days. This provides insights into error trends and potential issues in your application’s performance.
- Problematic Platform: This widget displays the browser type with the highest number of errors, along with the count of failed requests, captured using RUM over the last 6 hours.
Widget and Dashboard Actions
Click on the Actions tab to perform administrative operations for dashboards.
| Action | Description |
|---|---|
| Add Widgets | Adds new Widgets |
| Edit Dashboard | Edits the custom-created dashboards |
| Delete Dashboard | Deletes the selected dashboard |
| New Dashboard | Creates a new dashboard |
| New Business Dashboard | Creates a new Business dashboard |
| New Application Dashboard | Creates a new Application dashboard |
| Generate Dashboard Report | Creates a report with the details of the selected dashboard |
Publish Dashboard: The selected dashboard can be integrated with your Web Portal by using the Javascript Code Snippet given. So, those who can access your web portal can see the dashboard also.
Set as Default: The selected dashboard is set as the default dashboard. So, whenever you access the home tab, this dashboard would be displayed by default.
- The Publish Dashboard option, Dashboard Report option, and Widget-level actions are not supported for the Application dashboard.
- We do not support the publishing of dashboards while SSO is enabled.
- The ADDM Dependency Map widget is not available for Delegated Admin and Operator Role users.
- The Topology Map View widget in published dashboards is only supported from build 170200.
- If you install a Non-English Version, say the Chinese version, of Applications Manager, and then change your language settings to English, the Widget and Dashboard names will not automatically be translated from Chinese to English characters. You can, however, manually edit the Dashboard or Widget and change the name to English characters.
Dashboard-level Time Period: Allows you to filter the data shown on the dashboards based on the specified time period (ie. Last 5 minutes, Last 30 minutes, Custom Period, etc.). You can choose to either apply a time period from the dropdown to all widgets in the dashboard or let each widget use its own unique time period.
- Performance Metric Widgets
- Professional Edition: Time periods such as Last 5 Minutes, Last 30 Minutes, Last 1 Hour, Last 3 Hours, Last 6 Hours, Last 12 Hours, and Custom Period (Within Last 24 Hours) are not supported. Selecting these at the dashboard level will show last polled data for metric values, while line graphs will display data for the chosen time period.
- Enterprise Edition: These same time periods are also not supported. Selecting them at the dashboard level will show Last 24 Hours data for metrics, while line graphs will display data for the chosen time period.
- Monitor or Monitor Group Health Widgets (Last 24 Hours / 30 Days Health History, Monitor Groups — Health History): "Last 5 Minutes" and "Last 30 Minutes" are not supported and will default to "Last 1 Hour".
- Other widgets will load data for the selected time periods with no limitations.
Edit Tabs - Assign Dashboards to Tabs: Choose the order in which the dashboard will be listed under the Home tab.
Repositioning Widgets
In Dashboards, you are provided with an option to reposition and resize any widgets of your choice. Follow the given steps for the same:
- Go to Dashboard. Choose the widgets you want to reposition or resize.
- Drag and drop to change the position of the widgets.
- Click Save button.
- If the changes implemented in the layout are no more necessary, click on Reset or Cancel button to restore the widgets in the existing layout.
- Zoom in for better data exploration.
- Scrollable Legends for convenient navigation, even with multiple monitors.
- Set a custom time frame in the Overview Chart.
- Widget resizing can be performed only in horizontal directions.
- Default Widget Positioning: The widget spans across 2 columns on the screen and its position is determined by the order in which the widgets were created.
Topology Map View
A topology map is an effort to visualize the interconnection of different resources in an enterprise on a map. you can group a certain set of network devices and servers of your choice under a Map View and also associate links between them.
You can also create a sub map view within a map and display the same as a shortcut icon in a Map View. Background images [global maps, etc.] can be used for the Map View using the available default images or, you can also import your own background image.
Creating a Topology Map View Widget
- In the home tab, under click the actions button and choose the New Dashboard link. It opens up the Create New Dashboard page.
- Enter the Dashboard Name and Description
- You can also save the dashboard settings as template and apply it to monitor groups. You have the option of applying the template to specific monitor groups or apply it across all the monitor groups.
- Then from the Widget list, choose Topology Map View under the Monitor Group Widgets.
- Click on Create. A new dashboard will be created with an empty Topology Map View widget.
- Click on the Edit Widget button to add/associate a topology map. A new Edit Widget form pops up.
- Add a widget name and description.
- Either choose one of the existing Topology Maps from the drop-down menu or click add to add a new map view.
- Click Save Configuration. The Topology Map will be displayed in your widget.
Adding a new Topology Map
- In the New Map View form, enter the Map View Name.
- Select the Background map from the drop-down list [or, click on the Browse button to import a map/image of your choice; you may even keep the background blank by not selecting any image].
- Select the device Category from the drop-down list.
- Select the required devices from the list of available devices. Select the device and click the >> symbol to add them to the map. [You may select all network devices or deselect all network devices using the appropriate check box provided]
- Click Done. You will now see the Map View with the selected network devices and background image. The Map View can be seen in the Edit mode. The following actions are supported from the edit mode:
- Add more devices/servers to the map.
- Add Links between 2 devices.
- Add a Shortcut from this map to another map.
- Delete the map.
- Modify the Map Properties, i.e. the background Map image.
- After performing the desired actions, you can save the map by clicking on the Save button.
Business View
Business View helps to provide a holistic view of the resources that are monitored in a business infrastructure by displaying a hierarchical tree view of the monitors that are added to the Monitor Groups. Business View can be accessed either by adding as a widget or by clicking the Business View tab from the Applications Manager dashboard.
To create a customizable business view, follow the steps given below:
- In the Business View widget, select Add New View under View Settings. A new popup window will be opened to create a new view.
- Specify the Display Name of the Business View under View Properties tab.
- Then select the Monitor Groups that are to be added for this view under Associated Monitor Groups tab.
- Click on Save Configuration button to add the view.
The business view will be created and can be viewed by selecting the newly-added business view from the Select View dropdown.
You can edit, delete, or reset the required business view whenever required by selecting the appropriate option under View Settings. Additionally, you can publish the business view for external users and also embed them into an HTML web page by copy-pasting the generated code snippet under View Settings → Publish View. You can also set a specific business view as the default view by choosing Set as Default under View Settings.
Customizing the Business View
You can also customize your business view accordingly based on your requirements by selecting the required business view from the dropdown and then clicking on Display Properties under View Settings. Following are the list of options that can be configured in the Display Properties window:
- Show Label for Monitors: Shows the display name of the monitors present in the Monitor Group. By default, this option is enabled.
- Show only Monitor Groups and Sub Groups: Shows only the Monitor Groups and Sub-Groups that are added to the view and hides the monitors present under them.
- Show Only Top Level Sub Groups: Shows only the first-level Sub Groups that are added to the Monitor Group and hides the monitors and the remaining Sub Groups under it.
- Show only critical monitors: Shows only the monitors that are of Critical severity for the Monitor Group.
- Show only Monitor Groups Status: Shows only the status of the Monitor Groups that are added to this view.
In addition to the above options, you can also customize the style of the Business View based on background color, line color, label color, line thickness, line transparency, and node/font zoom ratio. You can also select the orientation of the business view in terms of Left-Right or Top-Bottom view.
NOC View
NOC View acts as a monitoring interface or display setup used in network operations centers to oversee and manage IT networks and infrastructure. Applications Manager's NOC View feature offers an effective and uninterrupted monitoring tool to keep track of critical network performance metrics and dashboards for Network Operations Centers. Learn more about NOC views.
To create a NOC view, follow the steps given below:
- You can view, edit, or delete the required business view whenever required by selecting the appropriate option under Dashboards → Actions → NOC Views.
- Click Create New option.
- Specify the Name and Refresh Interval.
- Choose the Theme as Dark or Light per your choice.
- Select the desired dashboards from the Dashboards list, that you want to include in the NOC view.
- Click Create.
You can edit or delete the required business view whenever required by selecting the appropriate option under Dashboards → Actions → NOC Views.
