Technicians and Roles
EventLog Analyzer supports authorization and authentication at a local level and is compatible with third-party applications like Active Directory and RADIUS server. It allows adding users in three realms (user groups) viz., Admin, Operator, and Guest. The Admin realm has the highest order of privilege in the EventLog Analyzer server and UI. The Operator has limited privileges that enables access to perform create and delete operation on the allotted resources. The Guest has read-only privilege on the allotted security resources (device groups).
How to add a new EventLog Analyzer technician?
To add new users, use the following menu option:
- Settings tab > Technicians and Roles > Add Technician
You can either add a user from AD or add a local technician in EventLog Analyzer.
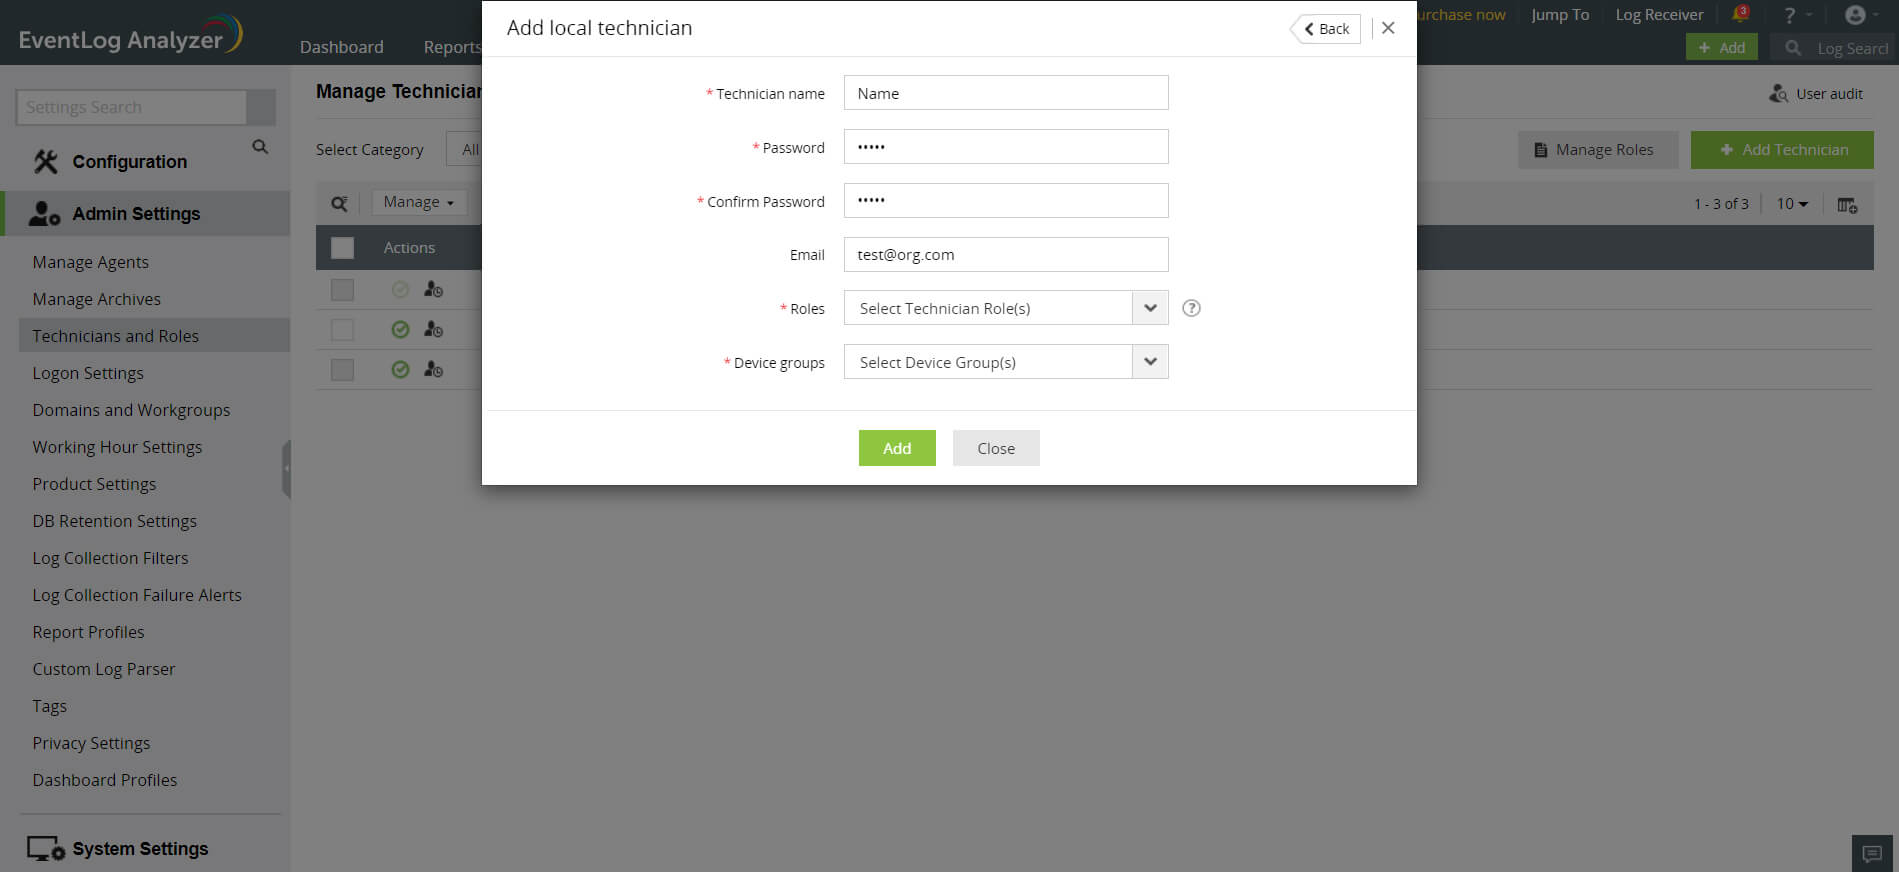
To add a local technician, click on the Add local technician link.
- Enter a name for the technician in the Technician Name field.
- Enter a new password and confirm it in the respective fields.
- Enter the email address of the technician in the Email field.
- In the Roles drop-down box, choose the role(s) you want to assign to the technician. You can assign more than one role to the technician and permissions of all the selected roles will be assigned to the technician.
- Assign device group(s) to provide segmented view to the user and limit the privilege on security resources. Select the device group(s) checkbox(es) and click OK.
- Complete the add user operation using the Add button.
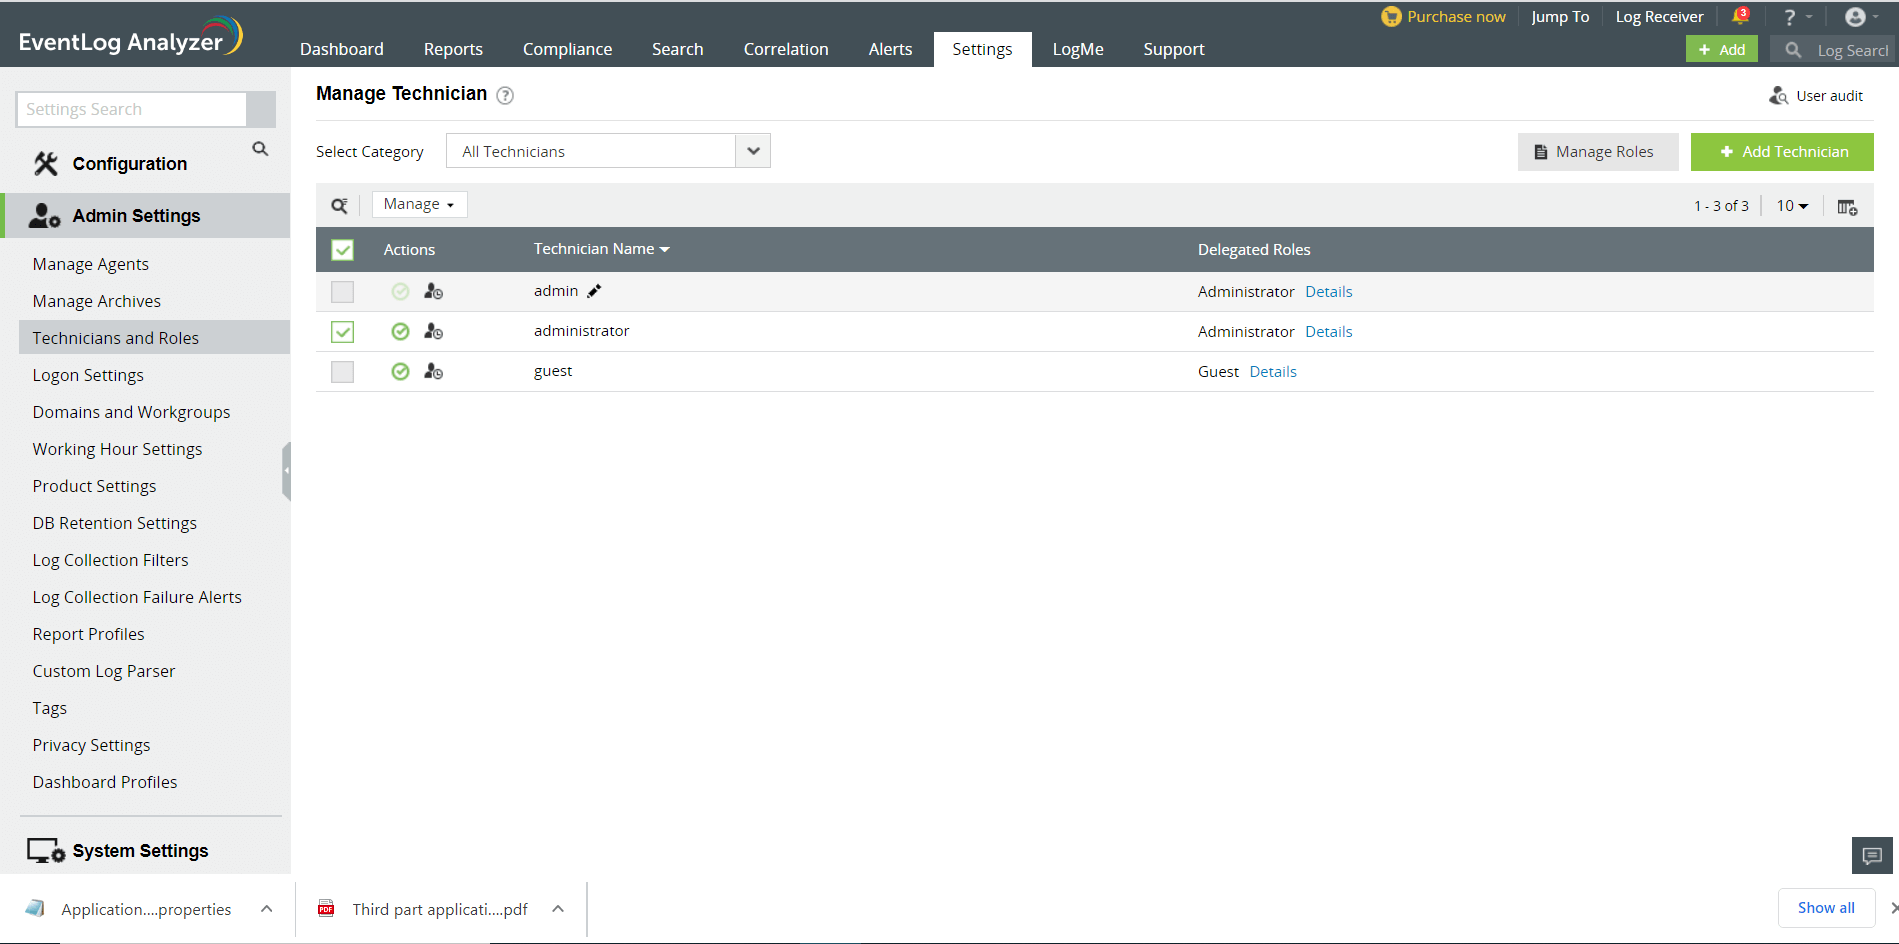
How to manage (delete, assign role to, assign group to) EventLog Analyzer technicians?
In the Manage Technician screen, all the users of EventLog Analyzer are listed along with user's login name, delegated roles, the domain in the network to which the users belong to, and the link to view their audit details. You can delete, enable or disable users and re-assign roles and device groups for technicians.
- To monitor the users of EventLog Analyzer, click on the User Audit icon. This will give you the report of all EventLog Analyzer user activity. You can view the user audit data for the required username, type of user(administrator, operator, guest), resource and action. The report can be extracted into PDF/CSV format.
- Delete, enable or disable users by selecting the users and clicking on the respective icons.
- Click on the edit icon to update the technician details such as the roles assigned, device groups, email and password.
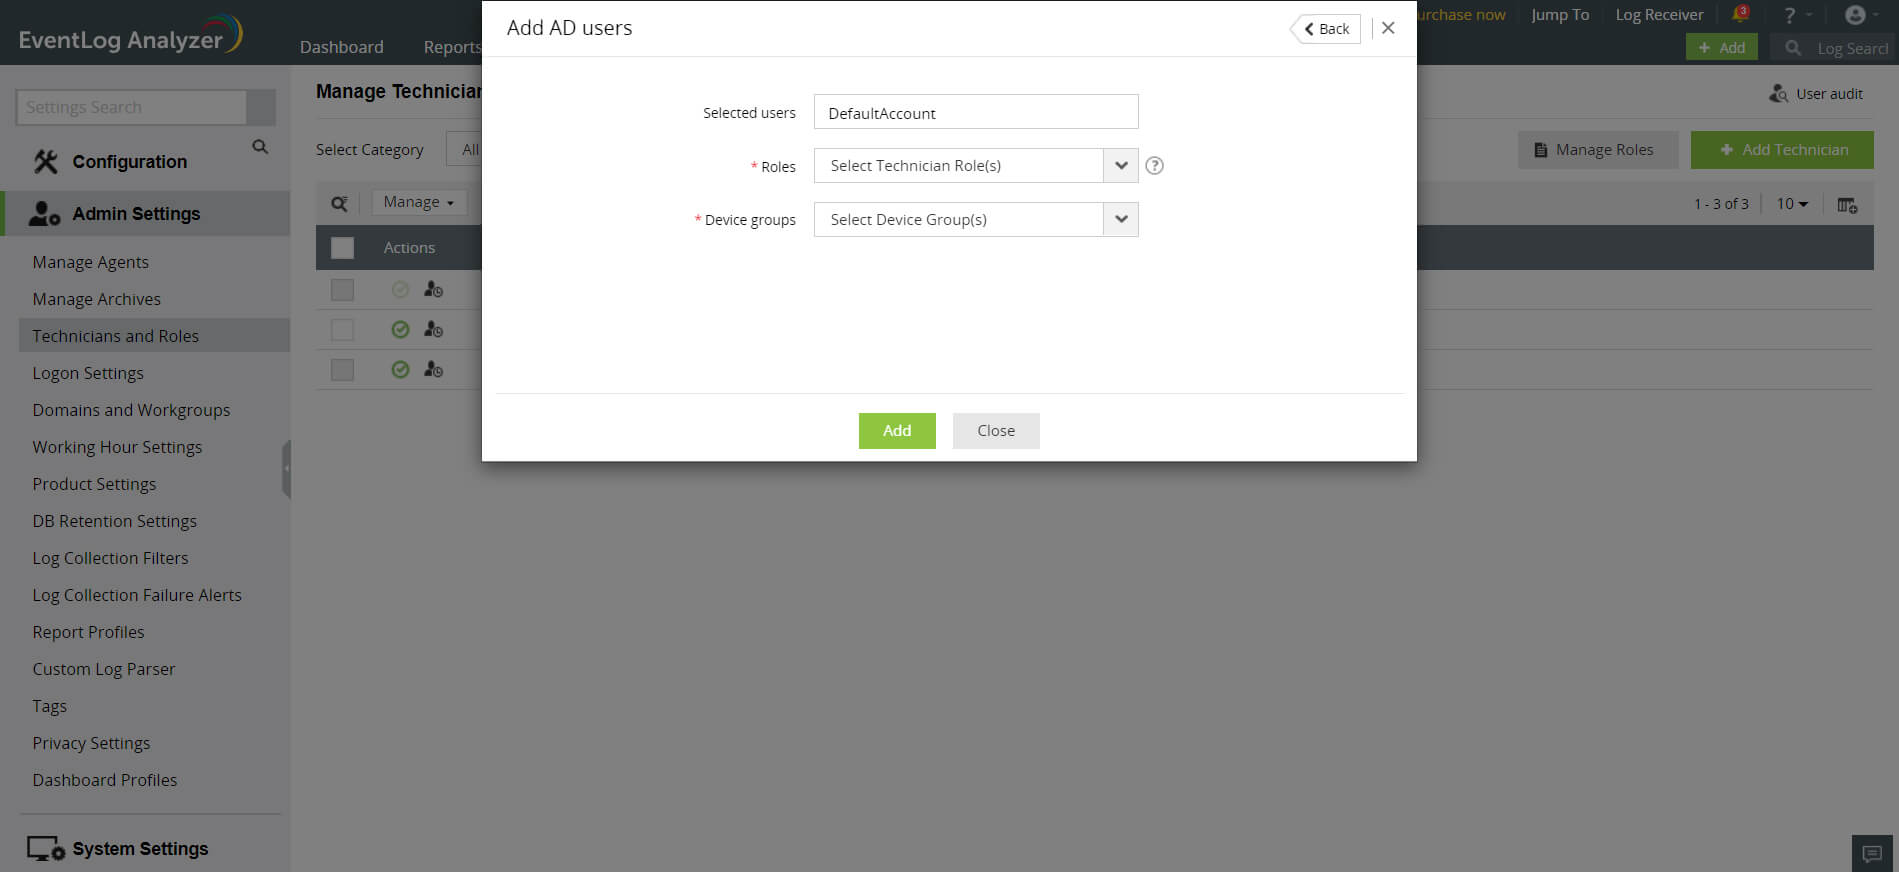
How to import users from Active Directory into EventLog Analyzer?
- Settings tab > Admin Settings: Technicians and Roles > Add Technician
EventLog Analyzer will automatically discover and display Active Directory users from the selected domain. You have two options - basic and advanced.
- Basic Options: The AD users are displayed along with their Login Name and Organizational Unit. Select the user(s) by clicking on the respective checkbox(es) and click on the Next button. You can easily search for a device using the search option or by filtering based on the OU using OU Filter.
- In the Roles drop-down box, choose the role(s) you want to assign to the technician. You can assign more than one role to the technician and permissions of all the selected roles will be assigned to the technician.
- Assign device group(s) to provide segmented view to the user and limit the privilege on security resources. Select the device group(s) checkbox(es) and click OK.
- Click on the Add button.
- Advanced Options: By clicking to the switch to advanced options link, you can add users based on their Domain Groups and Domain OUs. The domain groups/OUs will be automatically discovered and displayed for the selected domain. Select the Domain Groups or Domain OUs by clicking on the respective checkbox(es) and click on the Next button.
Configure Schedule: To synchronize users in Active Directory with the users in EventLog Analyzer, you can configure a schedule for periodically importing users from domain groups and OUs.
- Enter a name for the schedule.
- Specify the interval (in days) for running the scheduled automatic import.
- Click on the Save button or the Save and Run Now button if you wish the run the scheduled import right away.
Note: To create a Domain Technician (A domain technician is the one created from the users of Active Directory), the domain must first be added to the Admin Server. A domain added to a Managed Server cannot be used for creating an Admin Server AD Domain Technician.
Creating custom user roles
EventLog Analyzer allows you to create custom user roles in addition to the default Admin, Operator, and Guest roles. Custom user roles enable you to have multiple user groups depending on the level of control and access that users need in EventLog Analyzer. Custom user roles help you adopt the principle of least privilege (POLP) while adding users and assigning roles to them.
Steps to create a Custom User Role
- In EventLog Analyzer, navigate to Settings → Admin Settings → Technicians and Roles.
- Click on the Manage Roles button.
- To create a new role, click on +Add New Role.
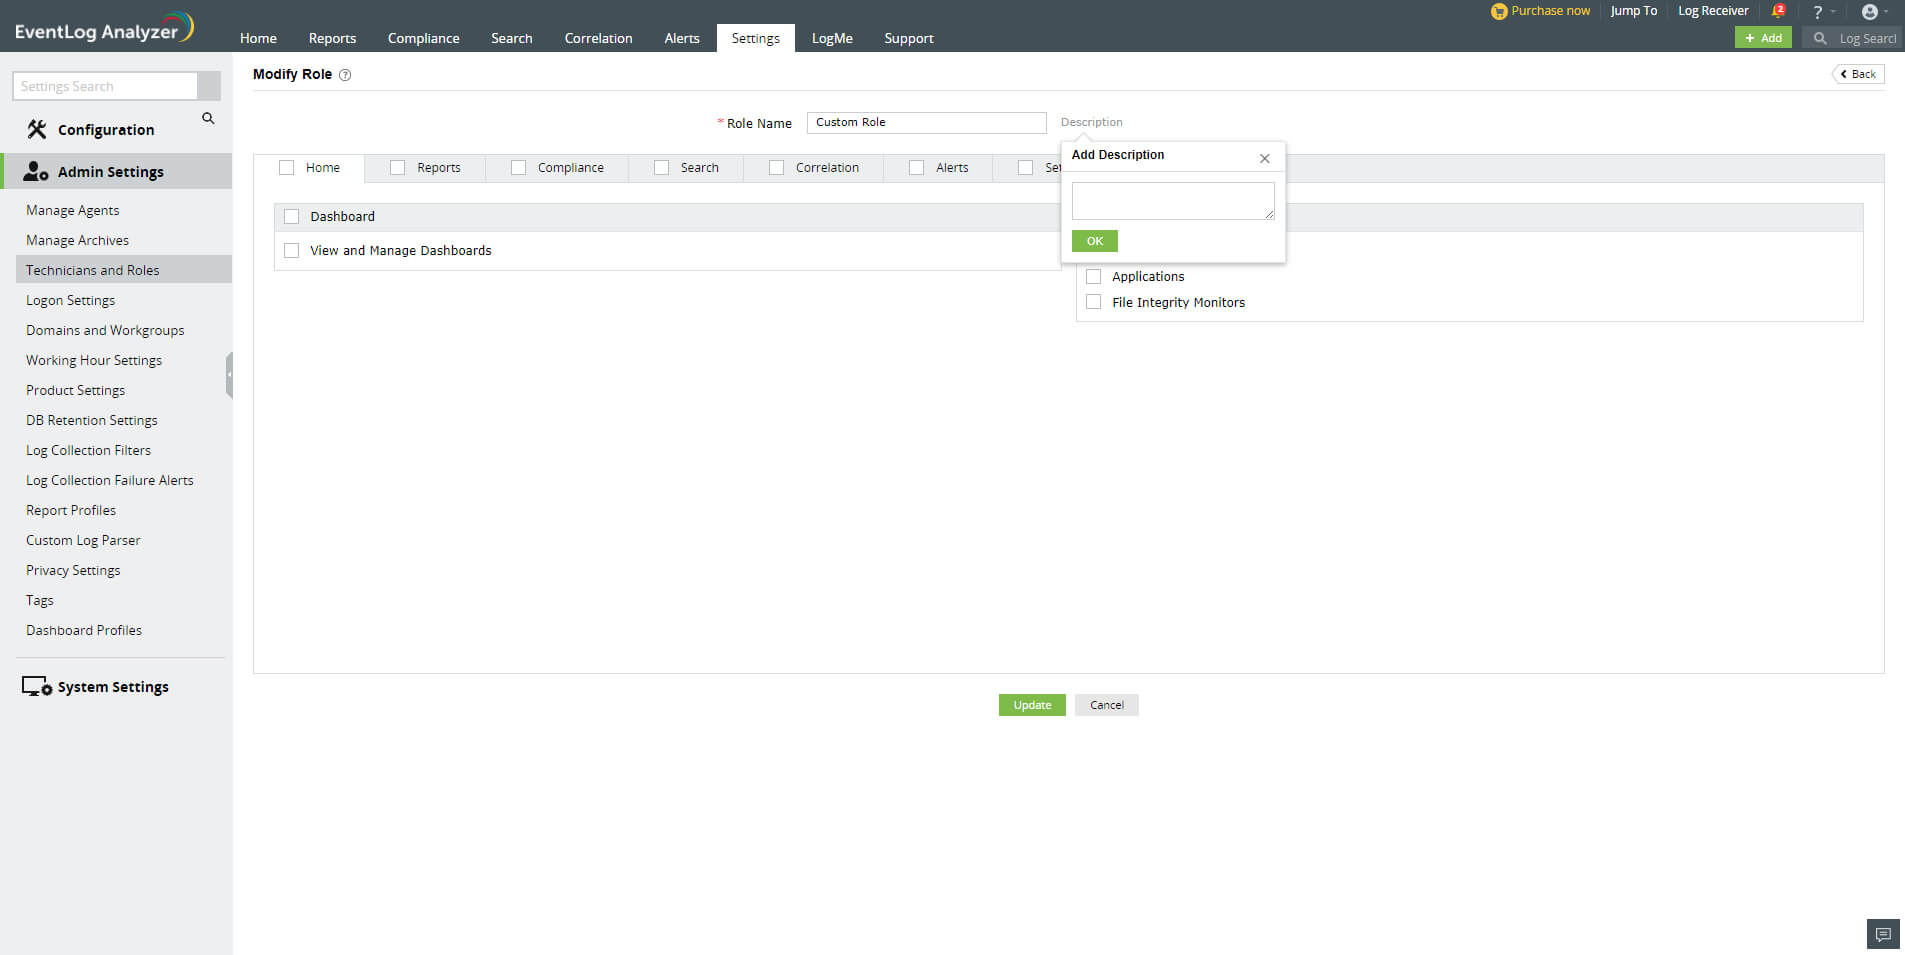
- In the Add New Role page, enter an appropriate role name in the Role Name field.
- Click on the Description link next to the Role Name field to enter a description for the role you want to create.
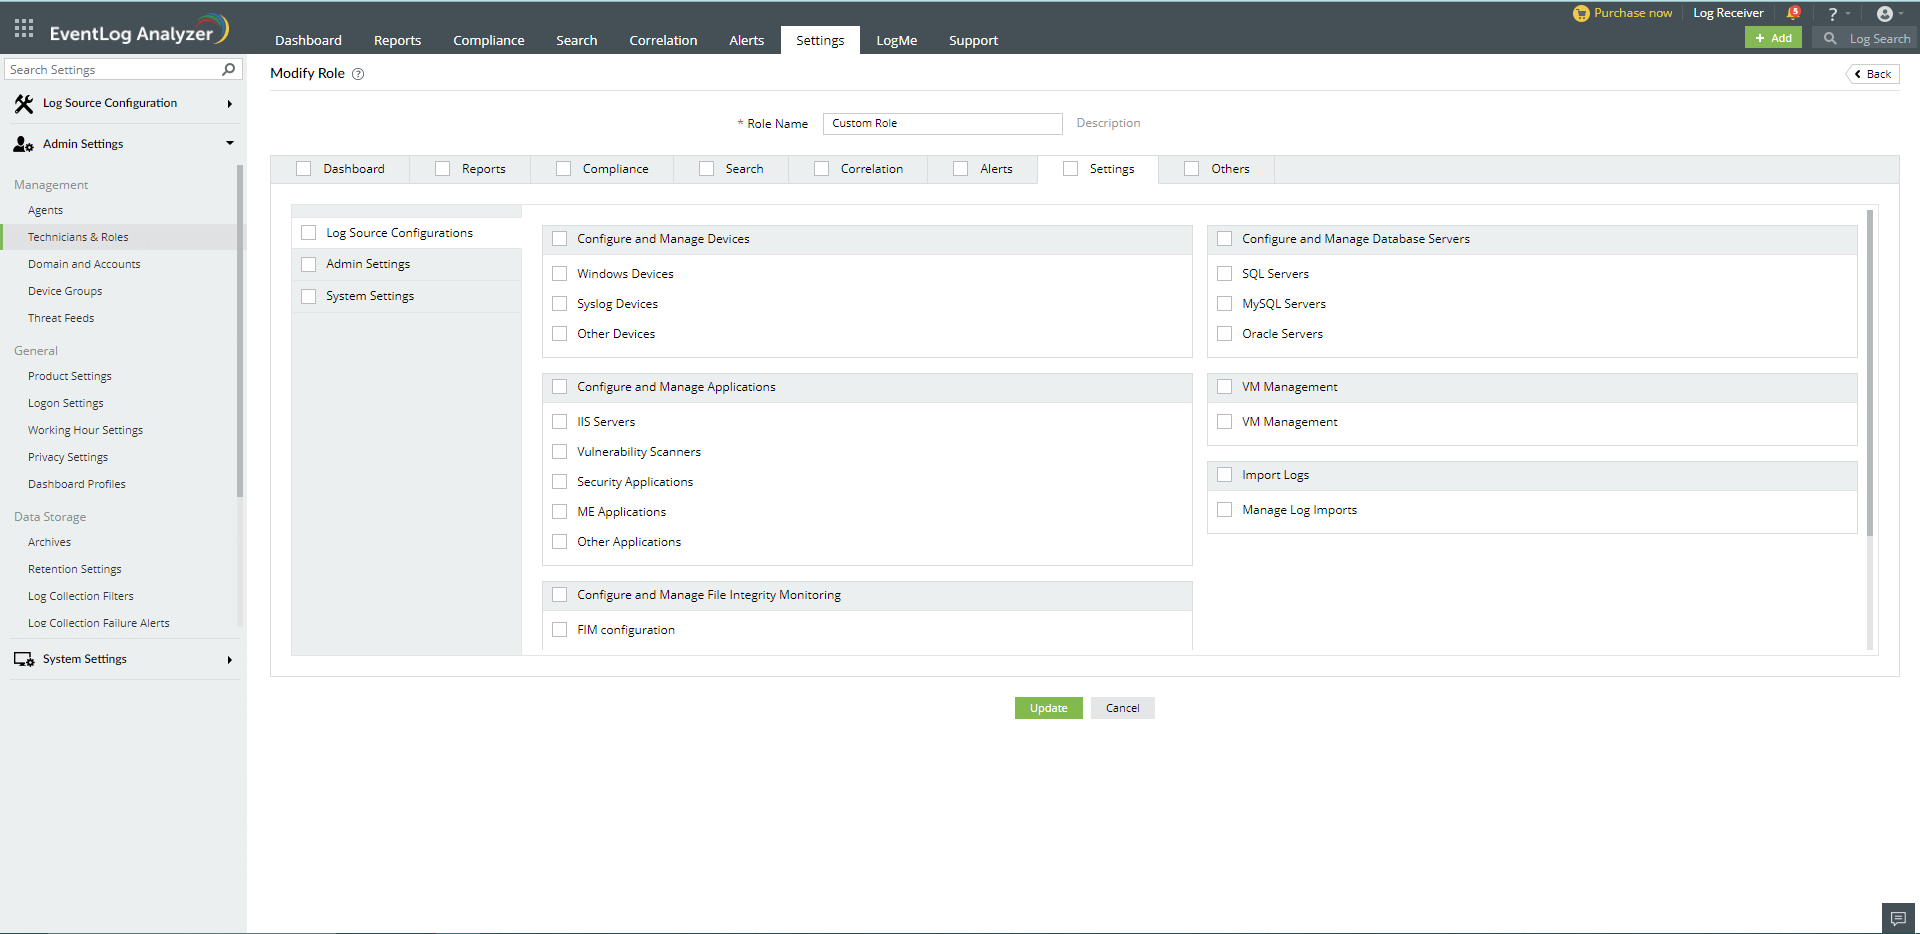
- You will see multiple tabs such as Home, Reports, Compliance, Correlation, Alerts, Settings, and Others. You can click on the checkbox provided for each of these tabs to allow the role to have all the permissions associated with the selected tabs. You can also navigate to each of these tabs individually and select the required permissions.
- Under the Home tab, you can see two sections: Dashboard and View the Log Sources. In the Dashboard section, you can allow users to view, and create and manage the dashboard. In the View the Log Source section, you can assign permissions to view device, application, and file integrity monitoring logs. You can also click on the checkboxes next to the Dashboard and View the Log Sources section to select all the options present under them.
- Under the Reports tab, you can specify if the user can view, schedule, and create reports by selecting the appropriate checkboxes. You can select all permissions associated with the Reports section by choosing General.
- Similarly, under the Compliance tab, you can choose if the user can view, create, and schedule compliance reports. You can click on the General checkbox if you want the user to have all permissions related to the Compliance tab.
- Under the Search tab, you can choose if you want to allow the user to perform search operations on the collected logs.
- Under the Correlation tab, you can find the Correlation and Activity Monitoring sections. In the Correlation section, you can choose if you want the role to view correlation reports, schedule them, and create and manage correlation rules and custom correlation actions. In the Activity Monitoring section, you can choose if the role can view and schedule activity monitoring reports, and create and manage activity monitoring rules.
- Under the Alerts tab, you can find three sections: Alerts, Incident Workflows, and Ticketing Tools. In the Alerts section, you can specify if you want the role to view generated alerts, and manage alert profiles and alert assigning rules by clicking on the appropriate checkbox. In the Incident Workflows section, you can select if the role can manage incident workflows. In the Ticketing Tools section, you can allow the role to configure ticketing tools.
- Under the Settings tab, you can find three tabs on the left pane: Log Source Configuration, Admin Settings, and System Settings. The Log Source Configuration tab contains multiple sections -- in which you can choose if you want the user to have permissions to configure and manage devices, applications, databases, virtual machines, and the File Integrity Monitoring component. In the Admin tab, you can choose whether the user can configure and manage domains, workgroups, and agents. In the System Settings tab, you can specify the permissions for managing general and system settings.
- Under the Others section, you can specify if the user can view product support related information, supported log sources, and notifications.
- After choosing all the required permissions, click on Create to create the custom user role.
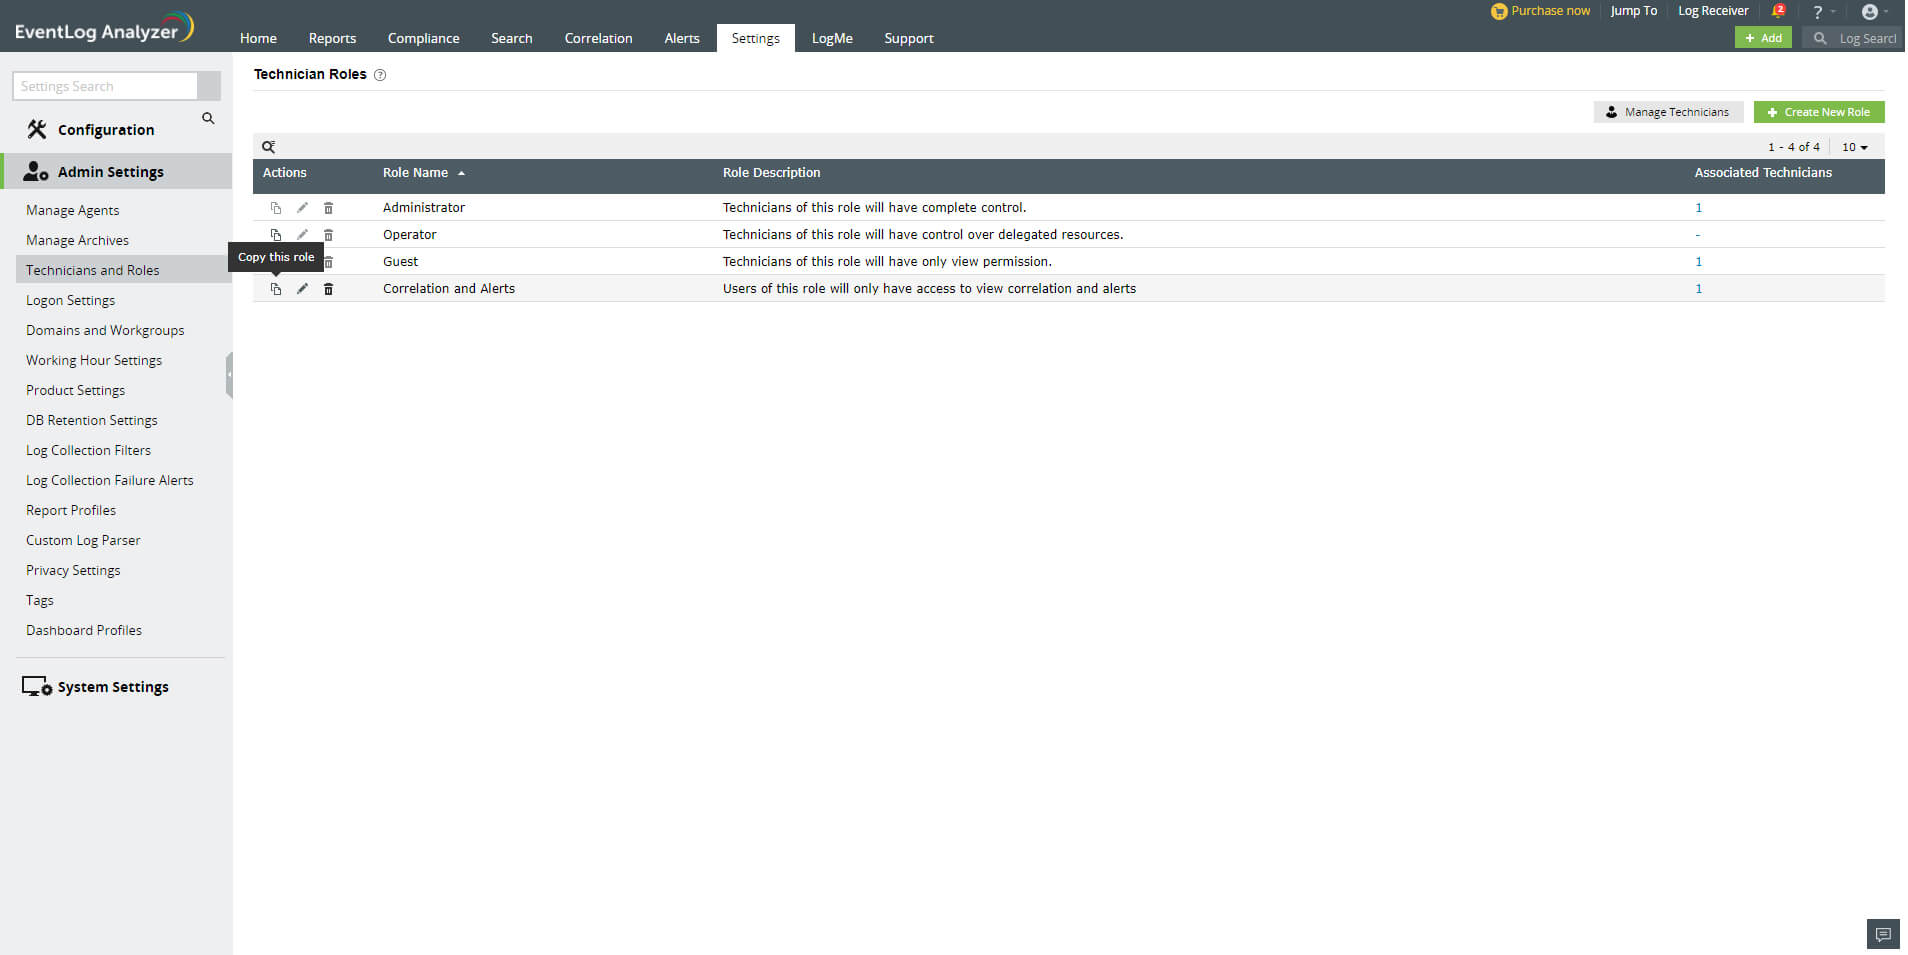
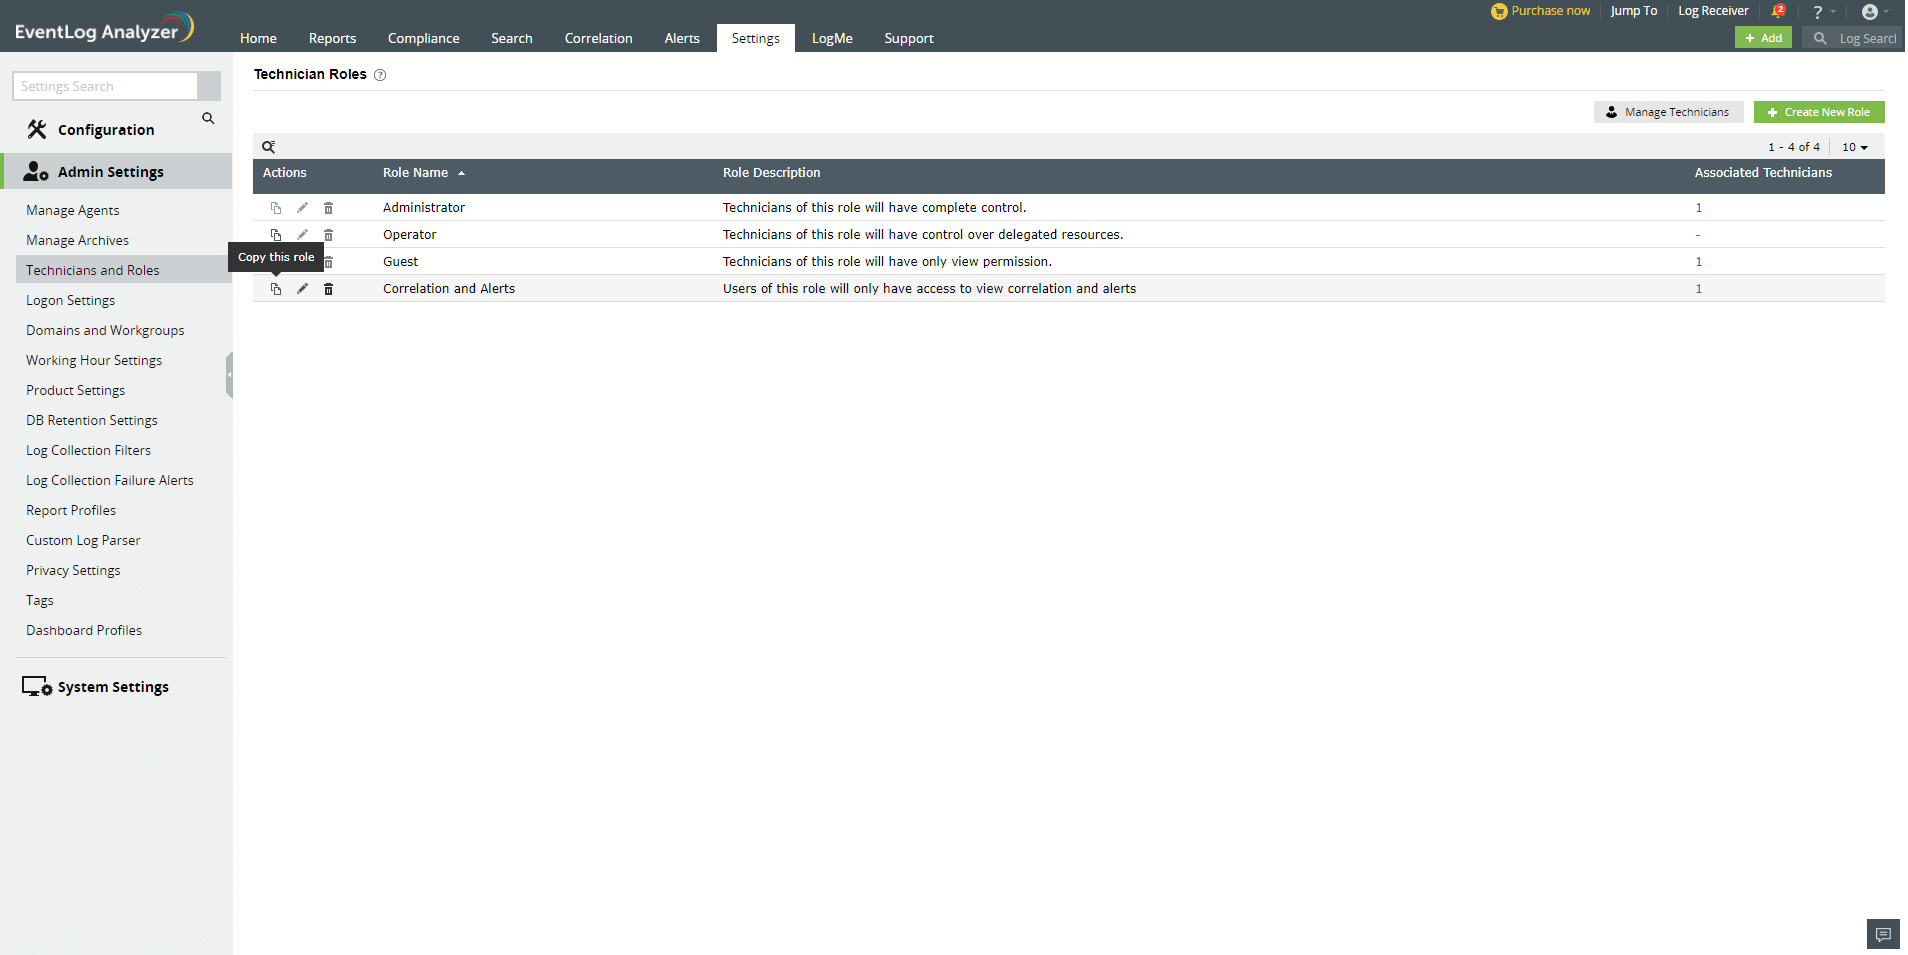
Viewing the created Custom User Role
In EventLog Analyzer, you can view all the default and custom user Roles by navigating to Settings → Admin Settings → Technician and Roles → Manage Roles. The role names, descriptions, and the number of technicians associated with each role will be displayed in a table. The Actions column of the table contains Click to Copy, Edit, and Delete icons to enable you to perform the required management actions. The Click to Copy option allows you to copy the permissions associated with an existing role to a new role -- which you can later edit as per your needs.
 Click here to expand