- Related Products
- Log360
- AD360
- ADManager Plus
- ADAudit Plus
- ADSelfService Plus
- Exchange Reporter Plus
 Click here to expand
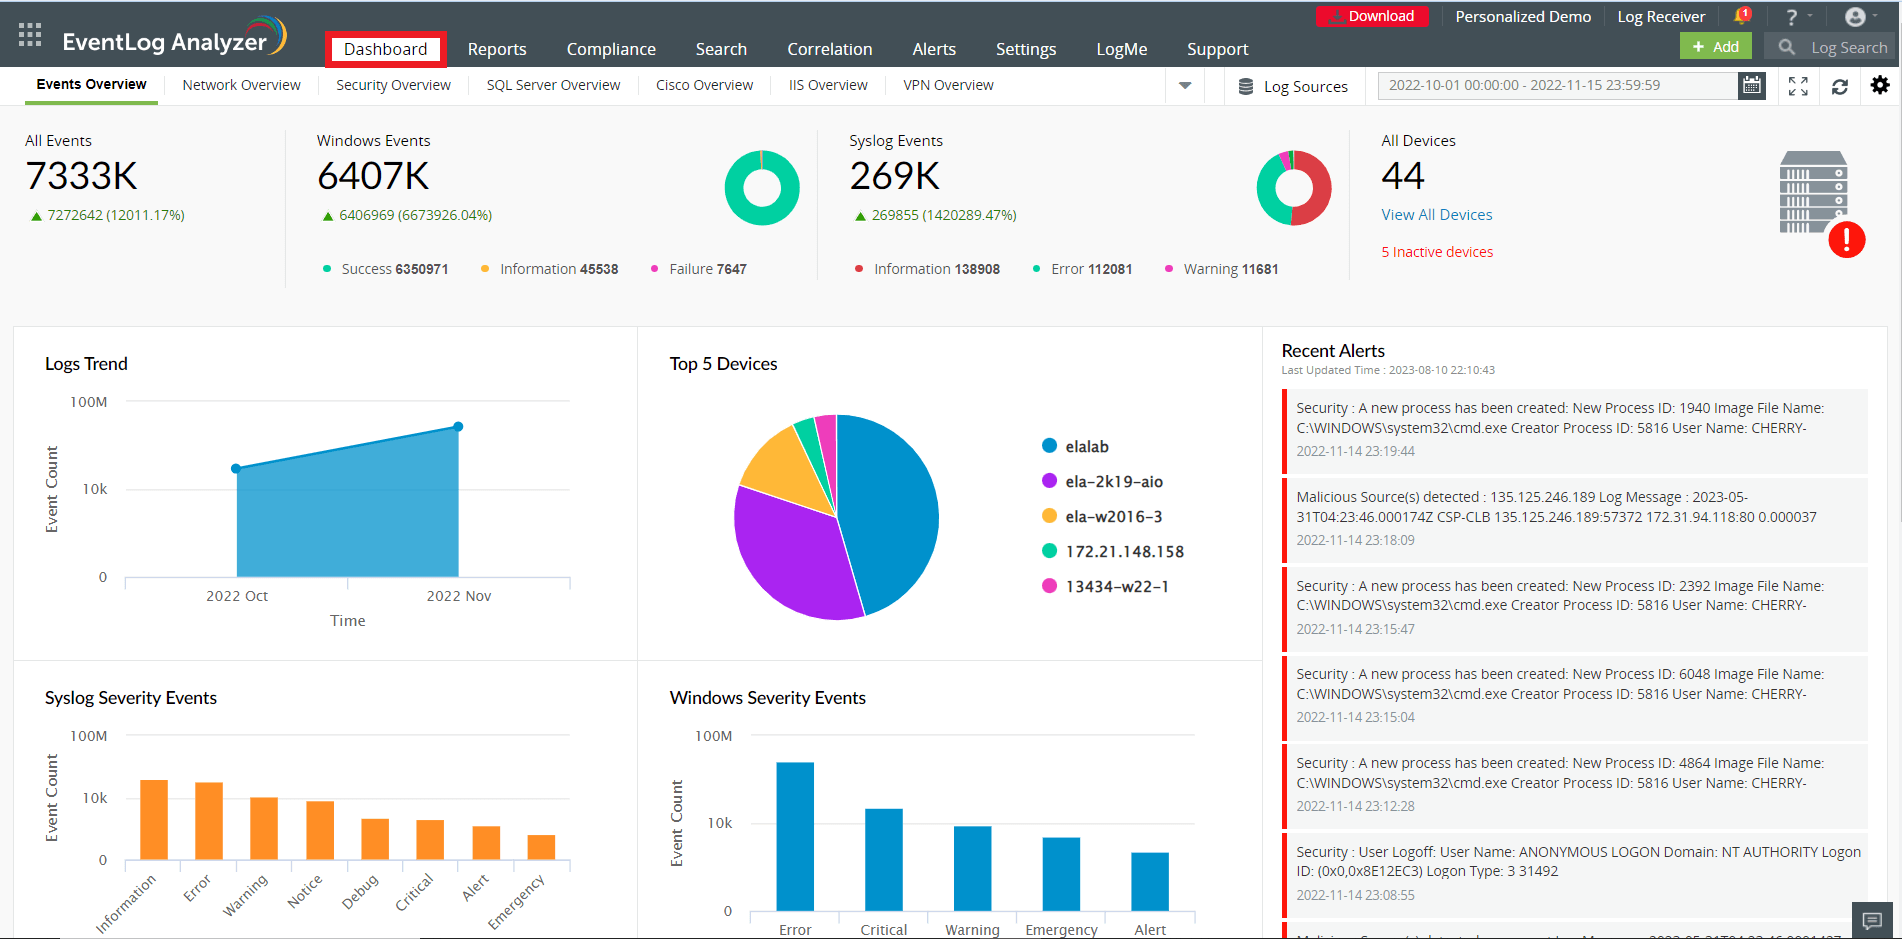
EventLog Analyzer has a near real-time dashboard that presents security related data in the form of graphs and charts. The dashboard helps you discern anomalies quickly, investigate threats and attack patterns, and get insights from log trends. This dashboard is customizable.
The EventLog Analyzer dashboard comes with the following default subtabs:
Each tab consists of numerous widgets.
This tab presents an overview of various security events monitored by EventLog Analyzer. The widgets in this dashboard provide insights on the various critical events generated in the network during the specified time frame.
The Events Overview tab has the following widgets:
| Widget Name | Function | Widget image |
| All Events | This widget presents the total number of events/logs collected by EventLog Analyzer during the given time frame. | 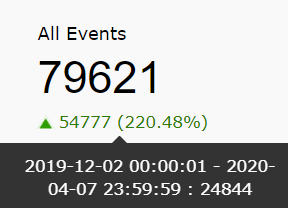 |
| Windows Events | This widget presents the total number of Windows-based events collected by EventLog Analyzer during the chosen time frame. In addition to that, the pie chart splits the windows events in to error events, failure events and warning events. Success/info events are filtered and not displayed. | 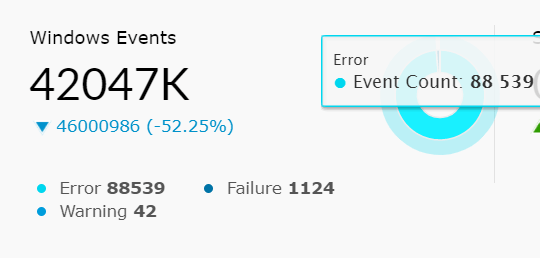 |
| Syslog Events | This widget presents the total number of Syslog events collected during the given time frame. Furthermore, the pie chart splits the syslog events into warning, error and critical events. | 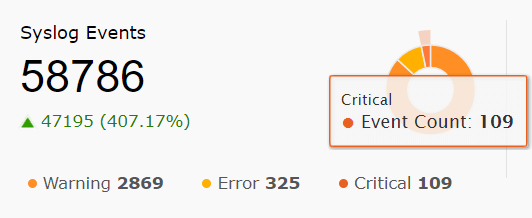 |
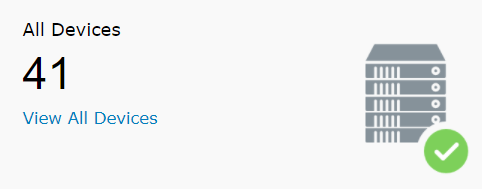
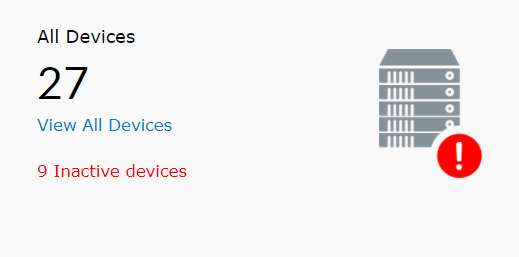
| All Devices | This widget provides a count of all the enabled devices from which log data is being collected. The server image in the corner will have a green tick if all logs are being collected successfully. A warning icon indicates that logs aren't being collected from some of the devices. Additionally, this widget has a View All Devices link. Clicking on the link will redirect you to the device dashboard page which will provide detailed information of each device. Clicking on All Device will take you to the Devices tab from where you can create a new list of Scheduled Reports |
|
The Events Overview tab also has the following widgets:
| Widget Name | Function | Widget image |
| Logs Trend | This widget presents a time-based log count trend of all events/logs ingested into EventLog Analyzer. The X-axis represents the time range, which is based on the calendar range you choose. If you choose the time range as less than 24 hours, then the graph will present you with hourly log trend data. The Y-axis represents the Event Count. | 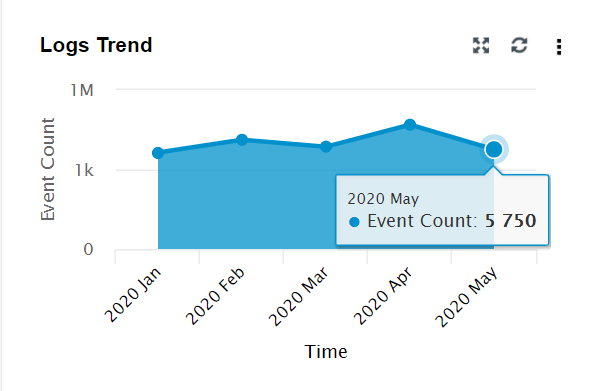 |
| Top 5 Devices | This widget presents the top 5 devices based on event count. | 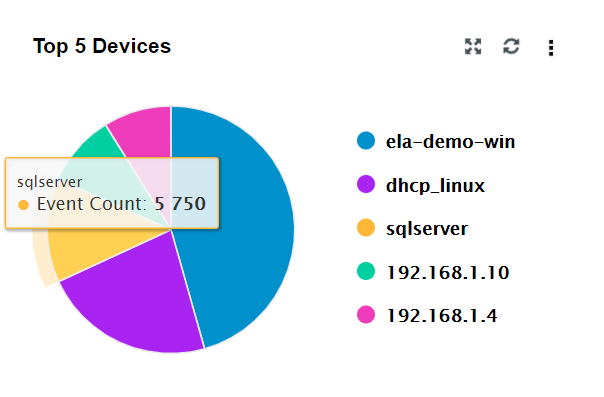 |
| Recent Alerts | This widget presents the 50 most recent alerts for the given time range. | 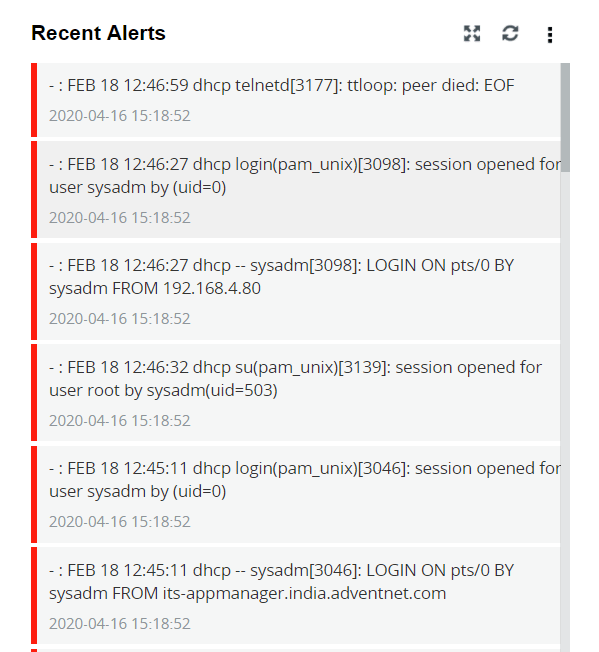 |
| Security Events | This widget shows a summary of various security events such as Logon, Account Logon, Account Management, and Object Access. | 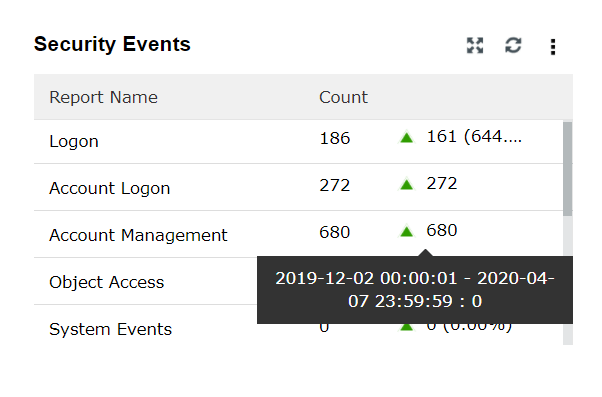 |
| Windows Severity Events | This widget displays a graph in which the X-axis represents the Severity of a Windows Event and the Y-axis represents the Event Count. | 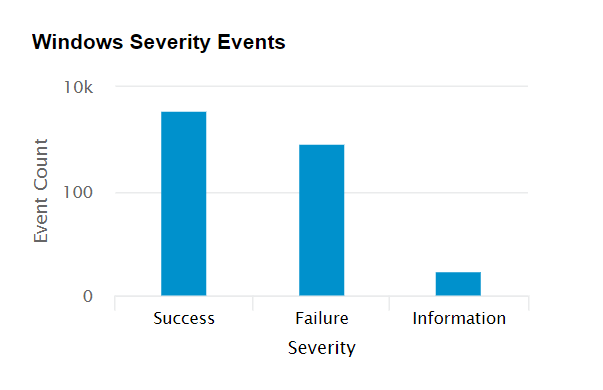 |
| Syslog Severity Events | This widget displays a graph in which the X-axis represents the Severity of a Syslog Event and the Y-axis represents the Event Count. | 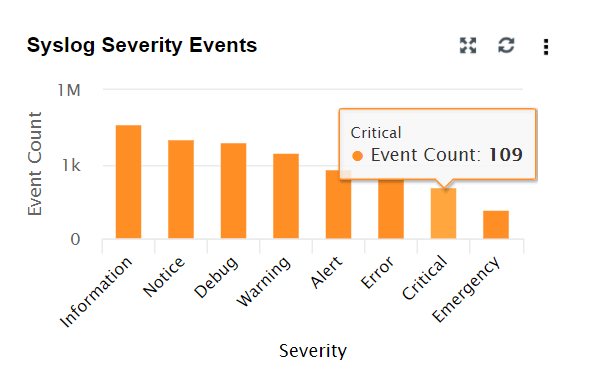 |
| Top 5 File Integrity Monitoring Events | This widget presents a 3D graph which displays the details of the top 5 file servers based on the log count. Each row contains additional data of various file based events. | 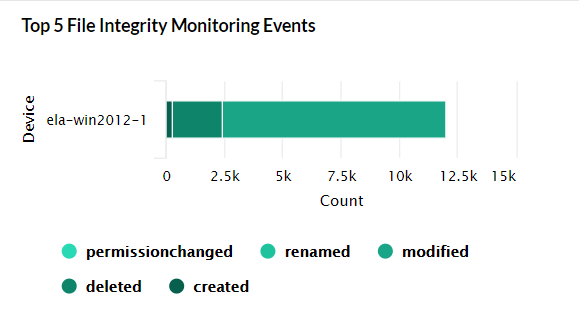 |
| Application Events | This widget displays a pie chart of the top 10 applications like IIS, DHCP etc based on event count. | 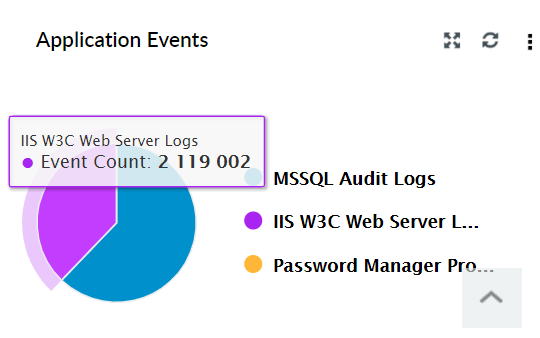 |
This tab gives an overview of various network-related events monitored by EventLog Analyzer by generating graphical reports. The widgets in this dashboard provide insights on the various critical events generated in the network during the specified time frame.
The Network Overview tab has the following widgets:
| Widget Name | Function | Widget image |
| All Events | This widget presents the total number of network-based events collected by EventLog Analyzer during the given time frame. Network-based events refer to events collected from network devices such as firewalls, switches and routers. | 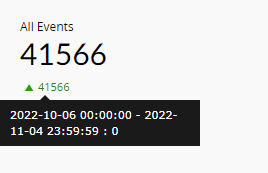 |
| Allowed Connections | This widget presents the count of all the connections that were allowed by the network device. The pie chart highlights the allowed connections from the total number of connections that occurred in the network during the specified time period. | 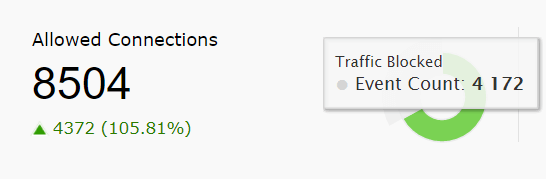 |
| Denied Connections | This widget presents the count of all the connections that were denied by the network device. The pie chart highlights the denied connections from the total number of connections that occurred in the network during the specified time period. | 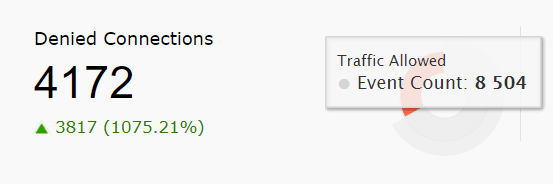 |
| Network Devices | This widget provides a total count of network devices that are added for monitoring. |  |
The Network Overview tab also has the following widgets:
| Widget Name | Function | Widget image |
| Traffic Trend | This widget presents a 3D graph that shows a time based trend of allowed traffic and blocked traffic. The X-axis represents the time range. It will be based on the calendar range you choose. If the calendar range is less than 24 hours, then this will show hourly ranges. If it is less than 1 hour, it will show 1 minute ranges. If it is less than 30 days, it will show 1 day ranges. If it is more than 30 days, it will show 1 month ranges. The Y-axis represents the Event Count. | 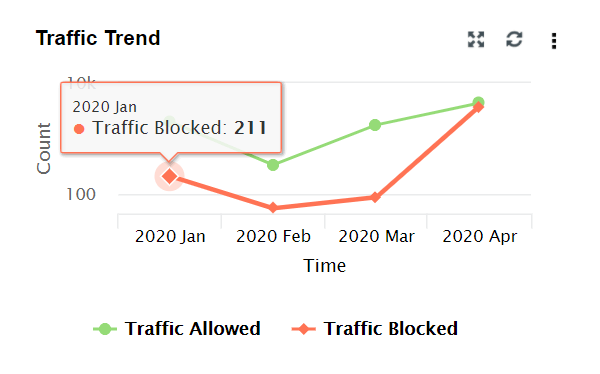 |
| Top Network Devices Based On Traffic | This widget displays the top 10 network devices based on the log count. Each row is further split into allowed traffic and blocked traffic. | 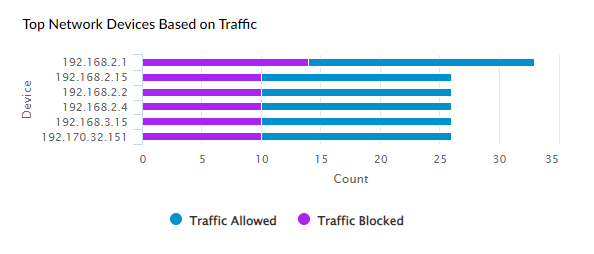 |
| Top 5 Denied Connections by Source | This widget displays the top 5 sources for which connections were denied. | 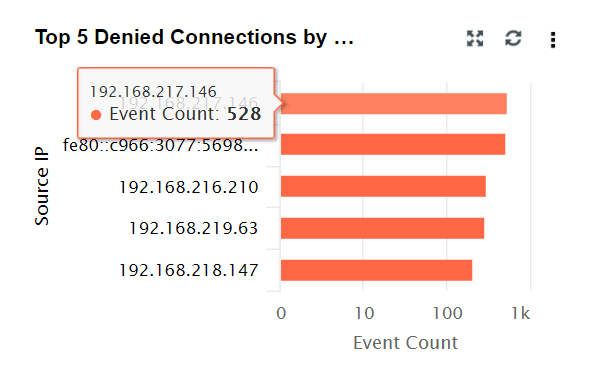 |
| Recent Interface Status Changes | This widget shows the recent interface status for each interface in each network device. The red downwards arrow indicates that the interface is down. The green upwards arrow indicates that the interface is up. | 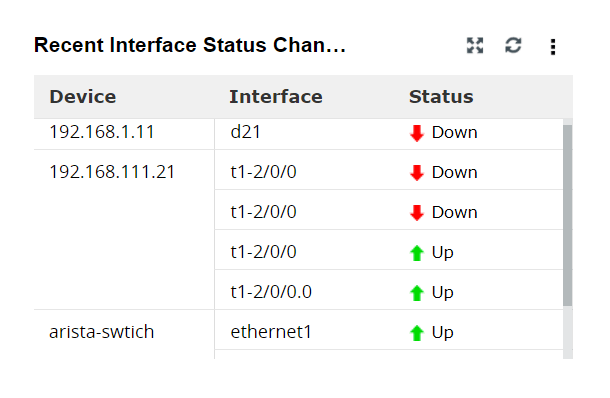 |
| Top Websites Accessed | This widget categorizes the top 10 websites accessed based on the number of times the site was accessed. | 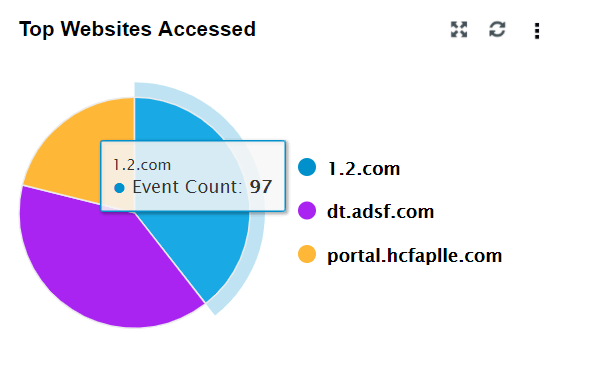 |
| Top VPN Logons by User | This widget lists the top 10 users based on VPN logons. | 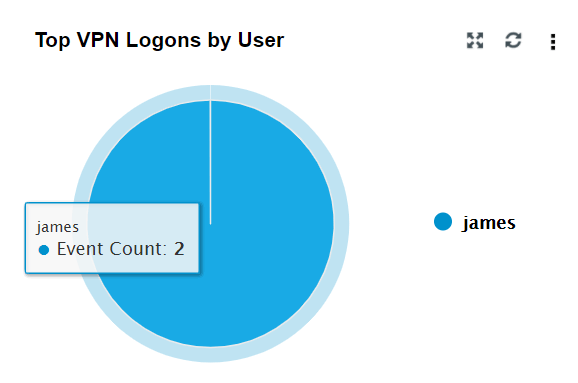 |
This tab provides an overview of the key security events monitored by EventLog Analyzer. The widgets in this dashboard provide insights on the various critical events generated in the network during the specified time frame.
The Security Overview tab has the following Widgets:
| Widget Name | Function | Widget image |
| Correlative Incidents | This widget refers to the number of incidents detected via EventLog Analyzer's correlation engine. | 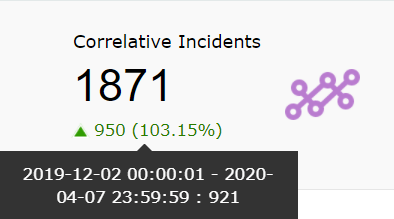 |
| Threats Detected | This widget presents the total number of threats detected during the chosen time frame from the Threat Sources (such as Symantec, McAfee, Malwarebytes etc) added in the EventLog Analyzer. | 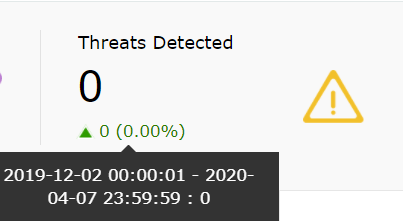 |
| Vulnerabilities | This widget displays the total number of vulnerabilities detected by the vulnerability scanner(s) whose data are being imported into EventLog Analyzer. | 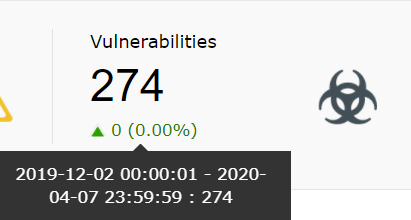 |
| IDS/IPS | This widget presents the total count of IDS/IPS events during the chosen time frame. | 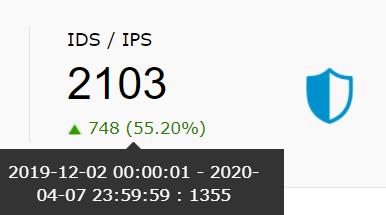 |
| Threats detected by Advanced Threat Analytics | This widget displays the count of threats detected by "Advanced Threat Analytics" feature in EventLog Analyzer. | 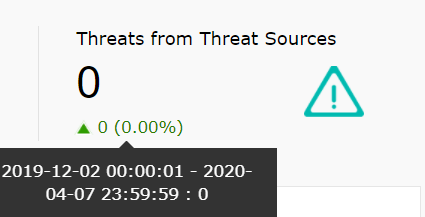 |
The Security Overview tab also has the following widgets:
| Widget Name | Function | Widget image |
| Alert Count Overview | This widget provides an overview of each configured alert profile. The X-axis denotes the alert profile and the Y-axis denotes the count. | 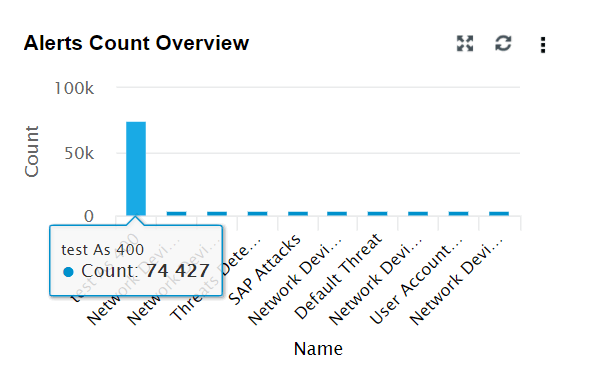 |
| Top Network Attacks (IPS/IDS) | This widget includes a 3D graph showing a time based trend for IDS/IPS events. The X-axis represents the time range. It will be based on the calendar range you choose. The Y-axis represents the event count and the Z-axis represents the IDS/IPS event type. Top 10 events are displayed based on the event count. | 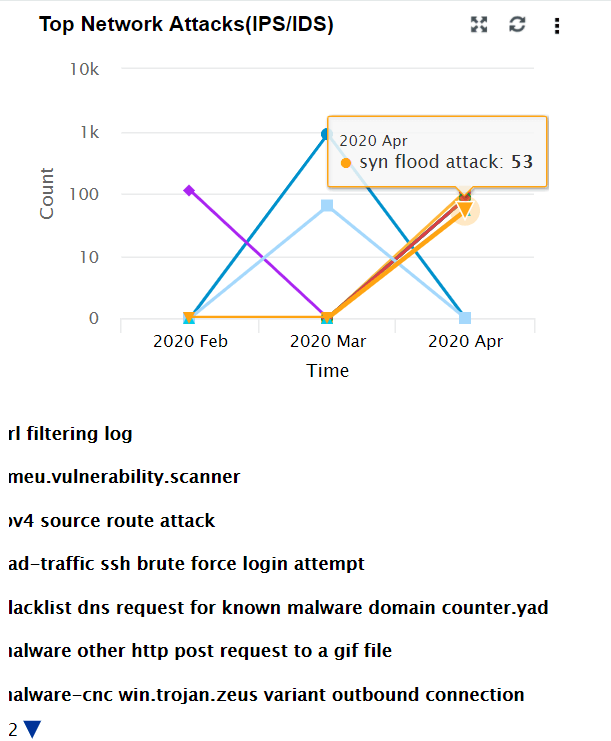 |
| Recent Threats Identified | This widget displays the most recent 50 threats based on the calendar range. | 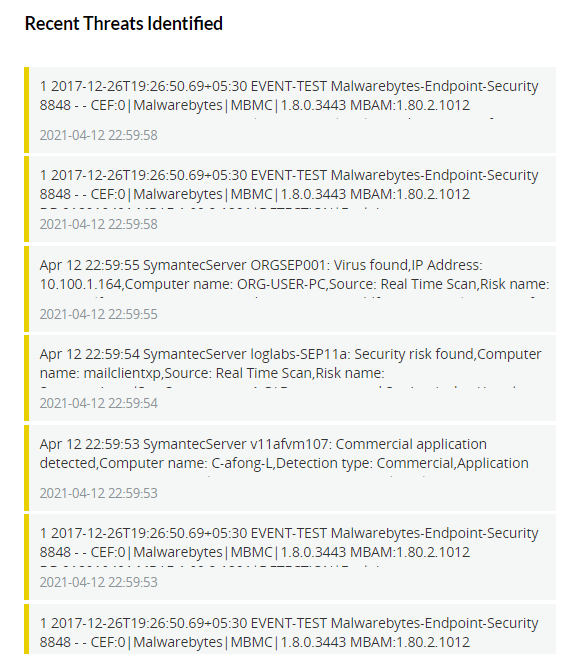 |
| Recent Correlated Incidents | This widget is similar to Alert Count Review. It provides an overview of the recent correlated incidents. The X-axis denotes the correlation rule and the Y-axis denotes the event count. | 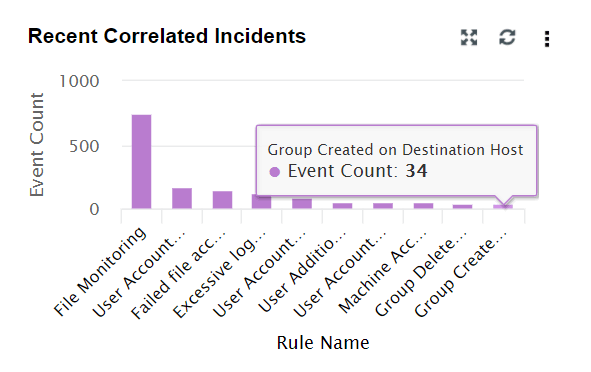 |
| Top Affected Endpoints from Threat Sources | This widget shows the Top 5 endpoint devices in which threats were detected by Threat Sources (Symantec, McAfee, etc) | 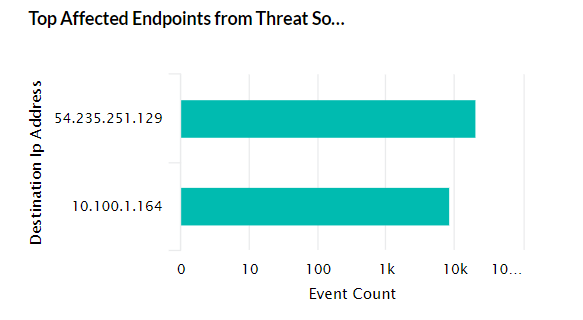 |
| Top Vulnerabilities from Vulnerability Scanners | This widget includes a pie chart that displays the top 5 vulnerabilities (selected on the basis of event count) detected in endpoint devices by the vulnerability scanner. |  |
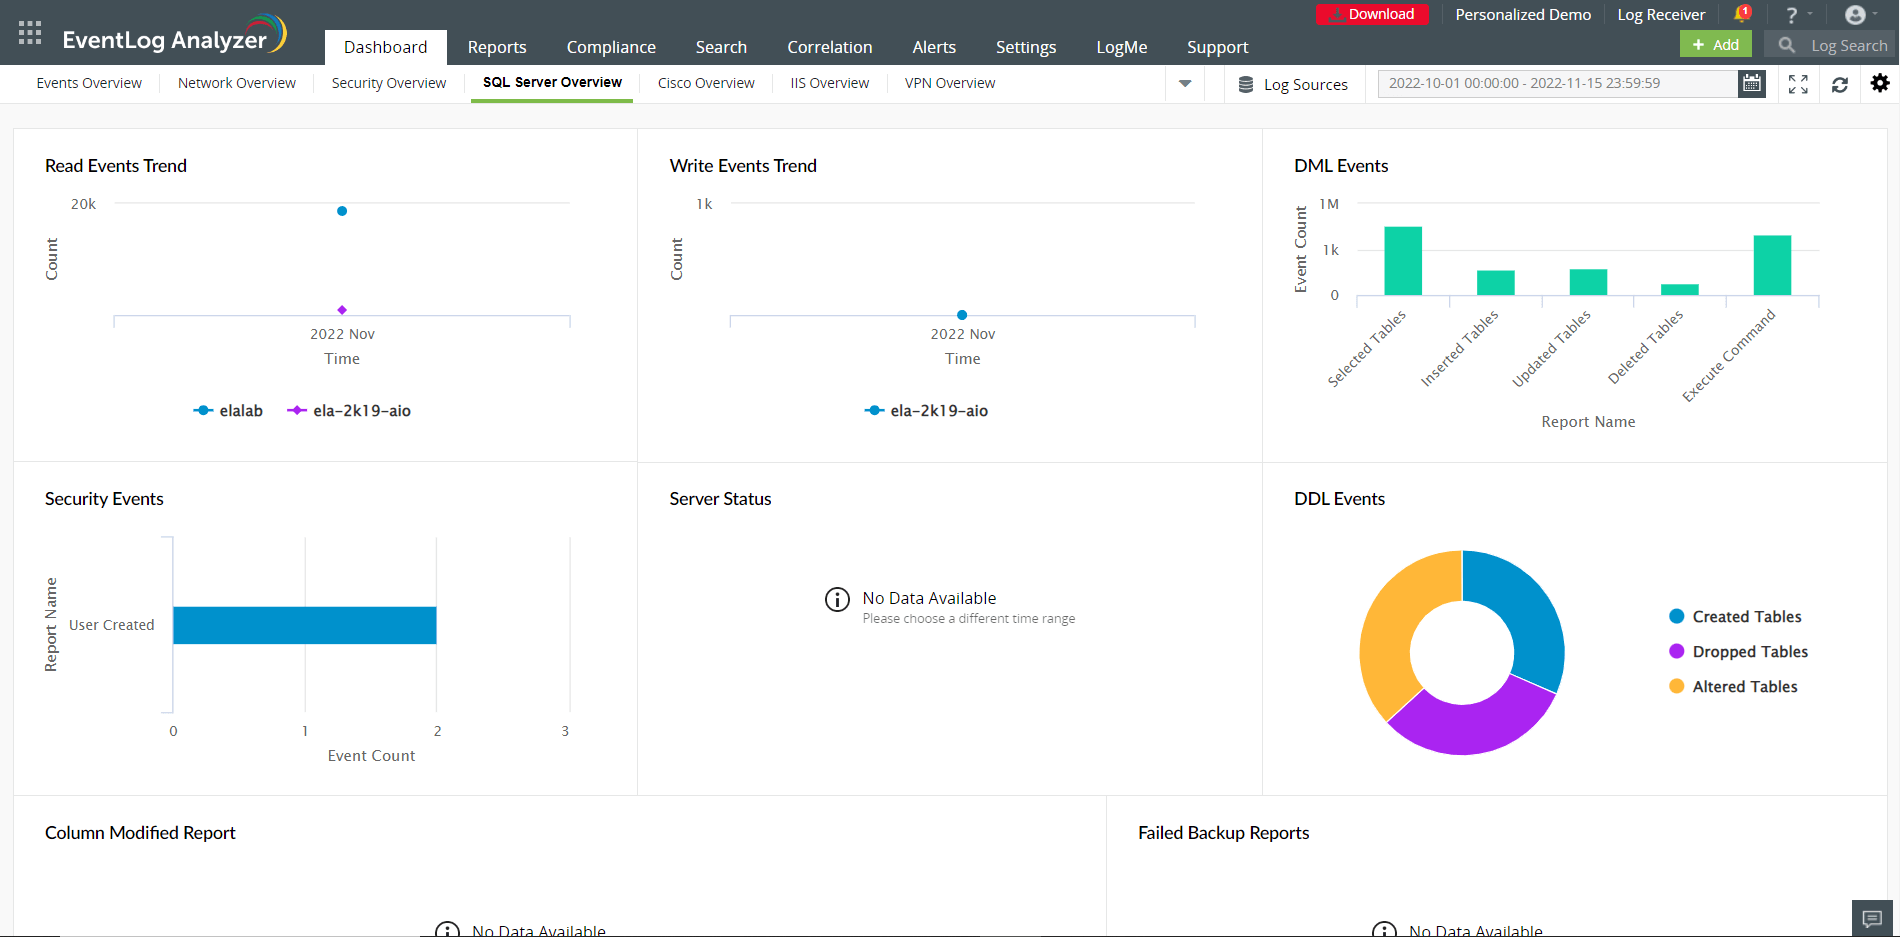
In addition to the above, predefined templates are also available for dedicated monitoring of Cisco, IIS and SQL Server Devices.
Copyright © 2020, ZOHO Corp. All Rights Reserved.