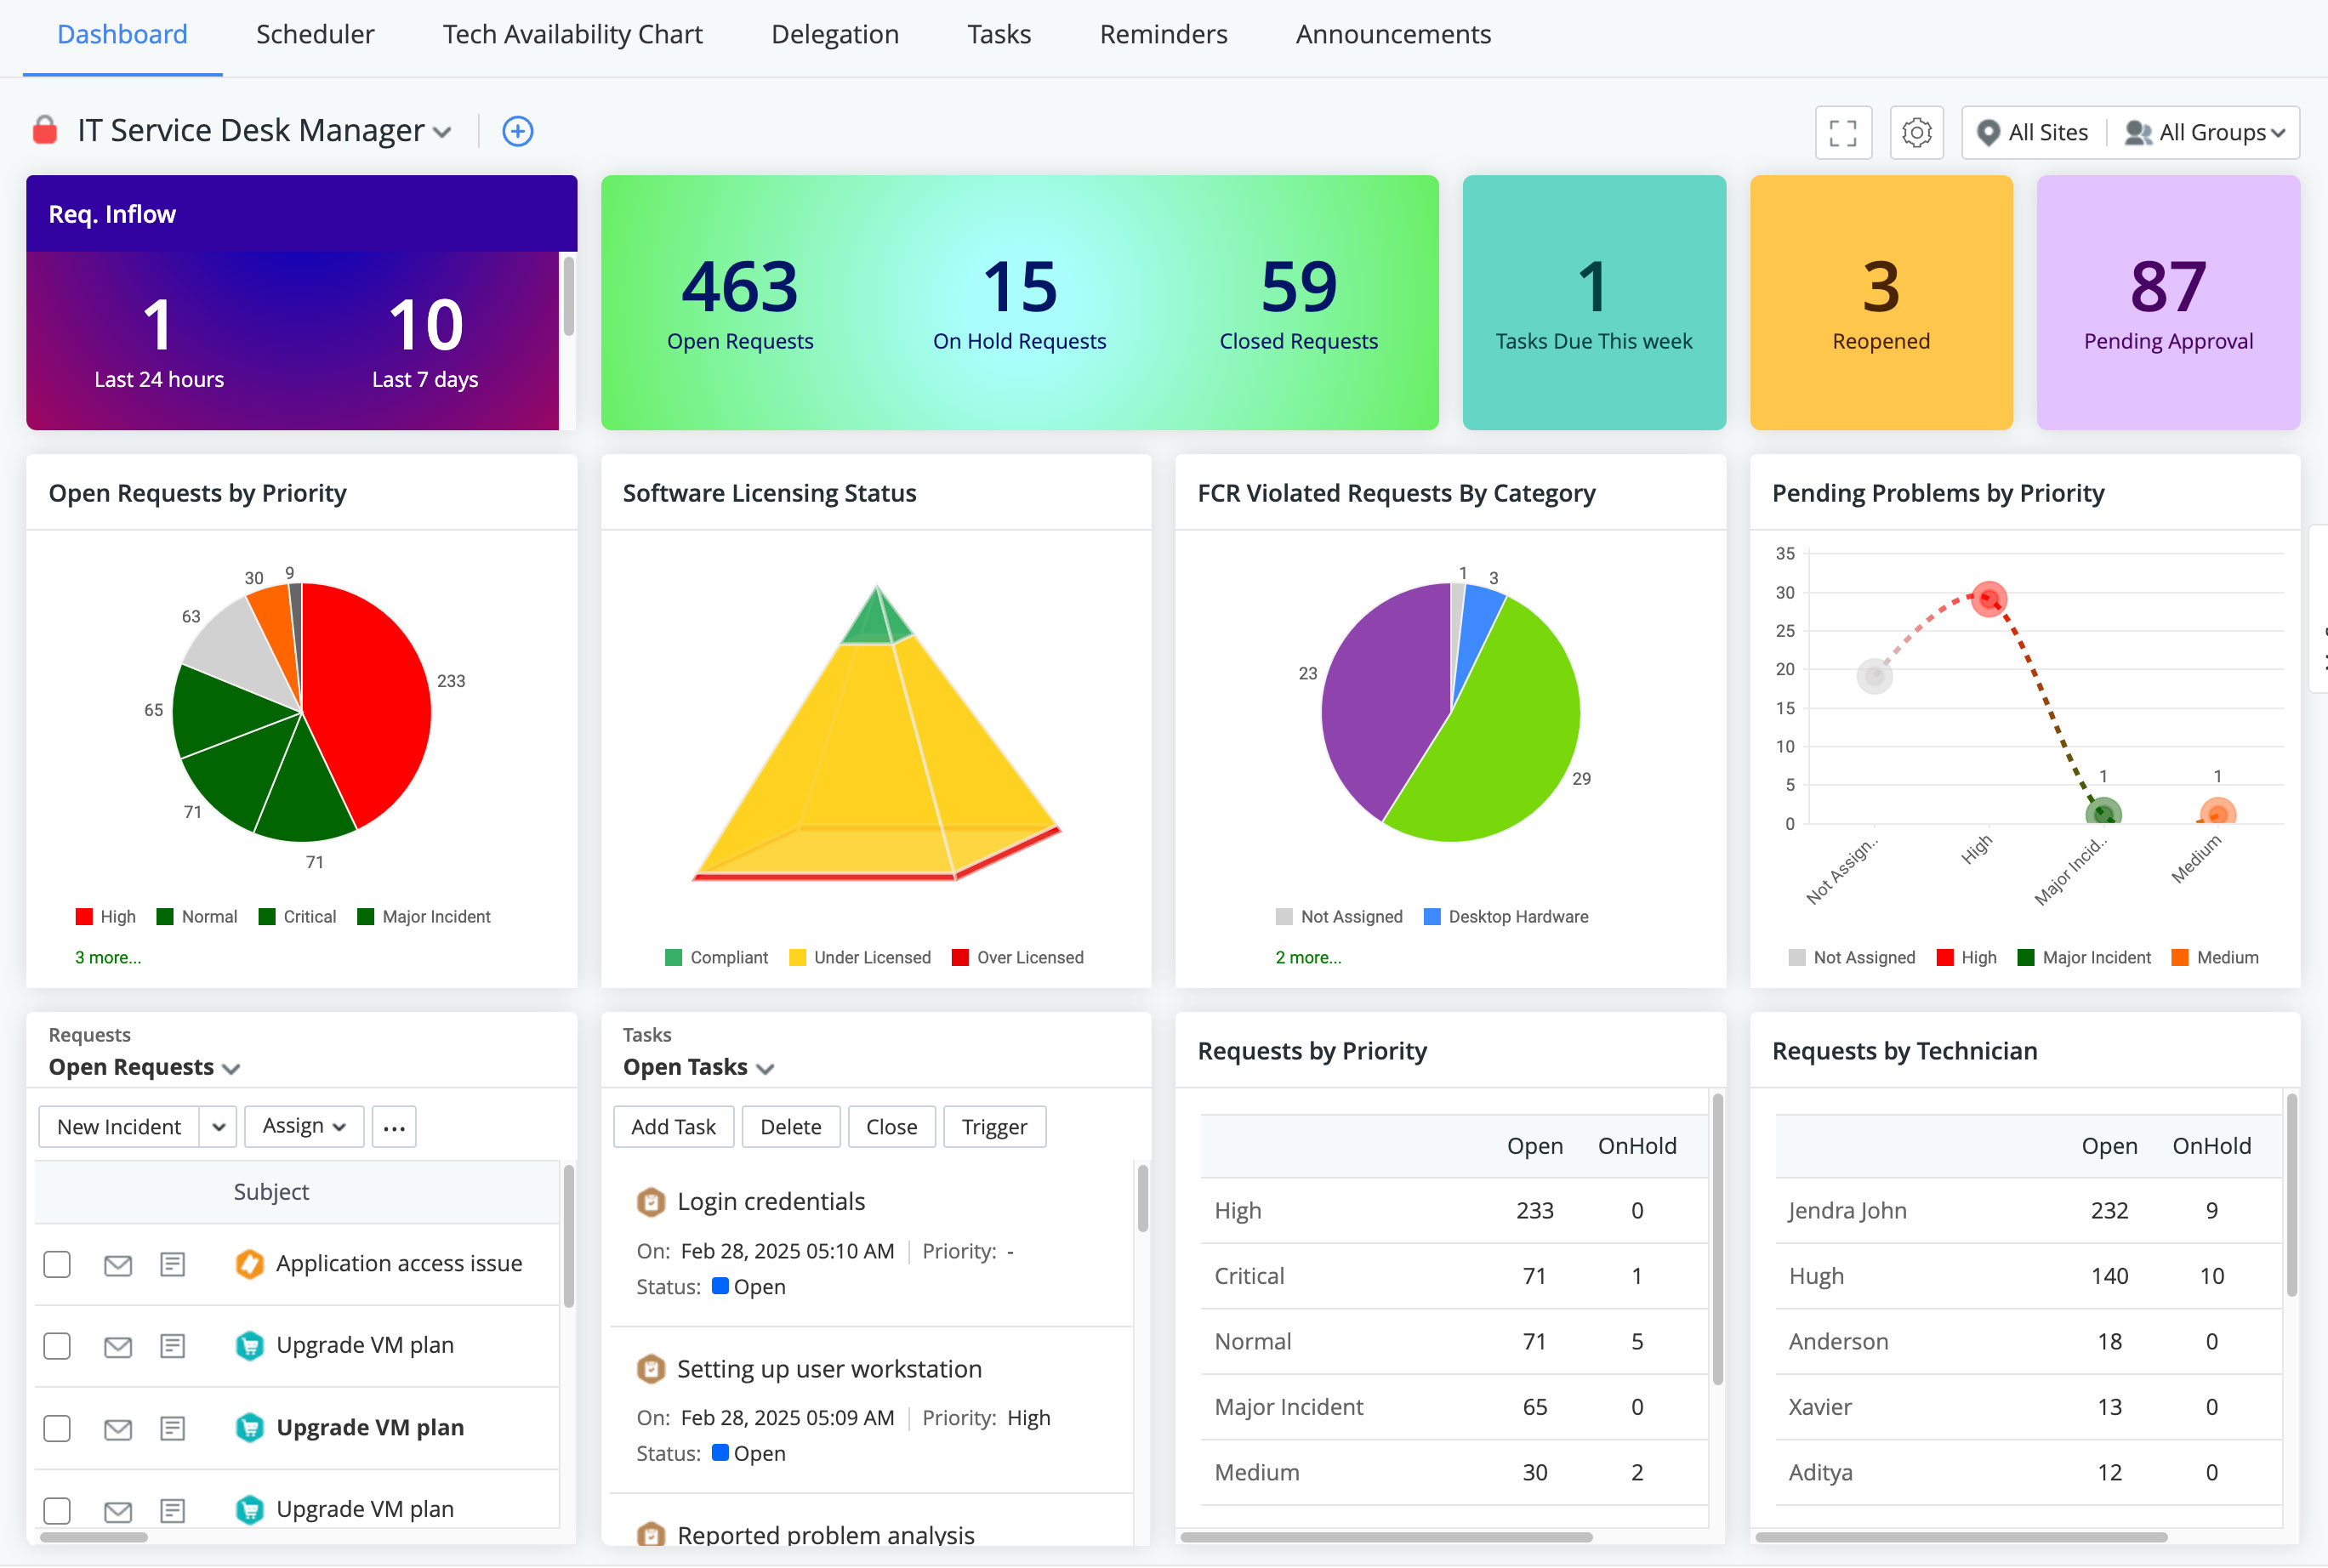
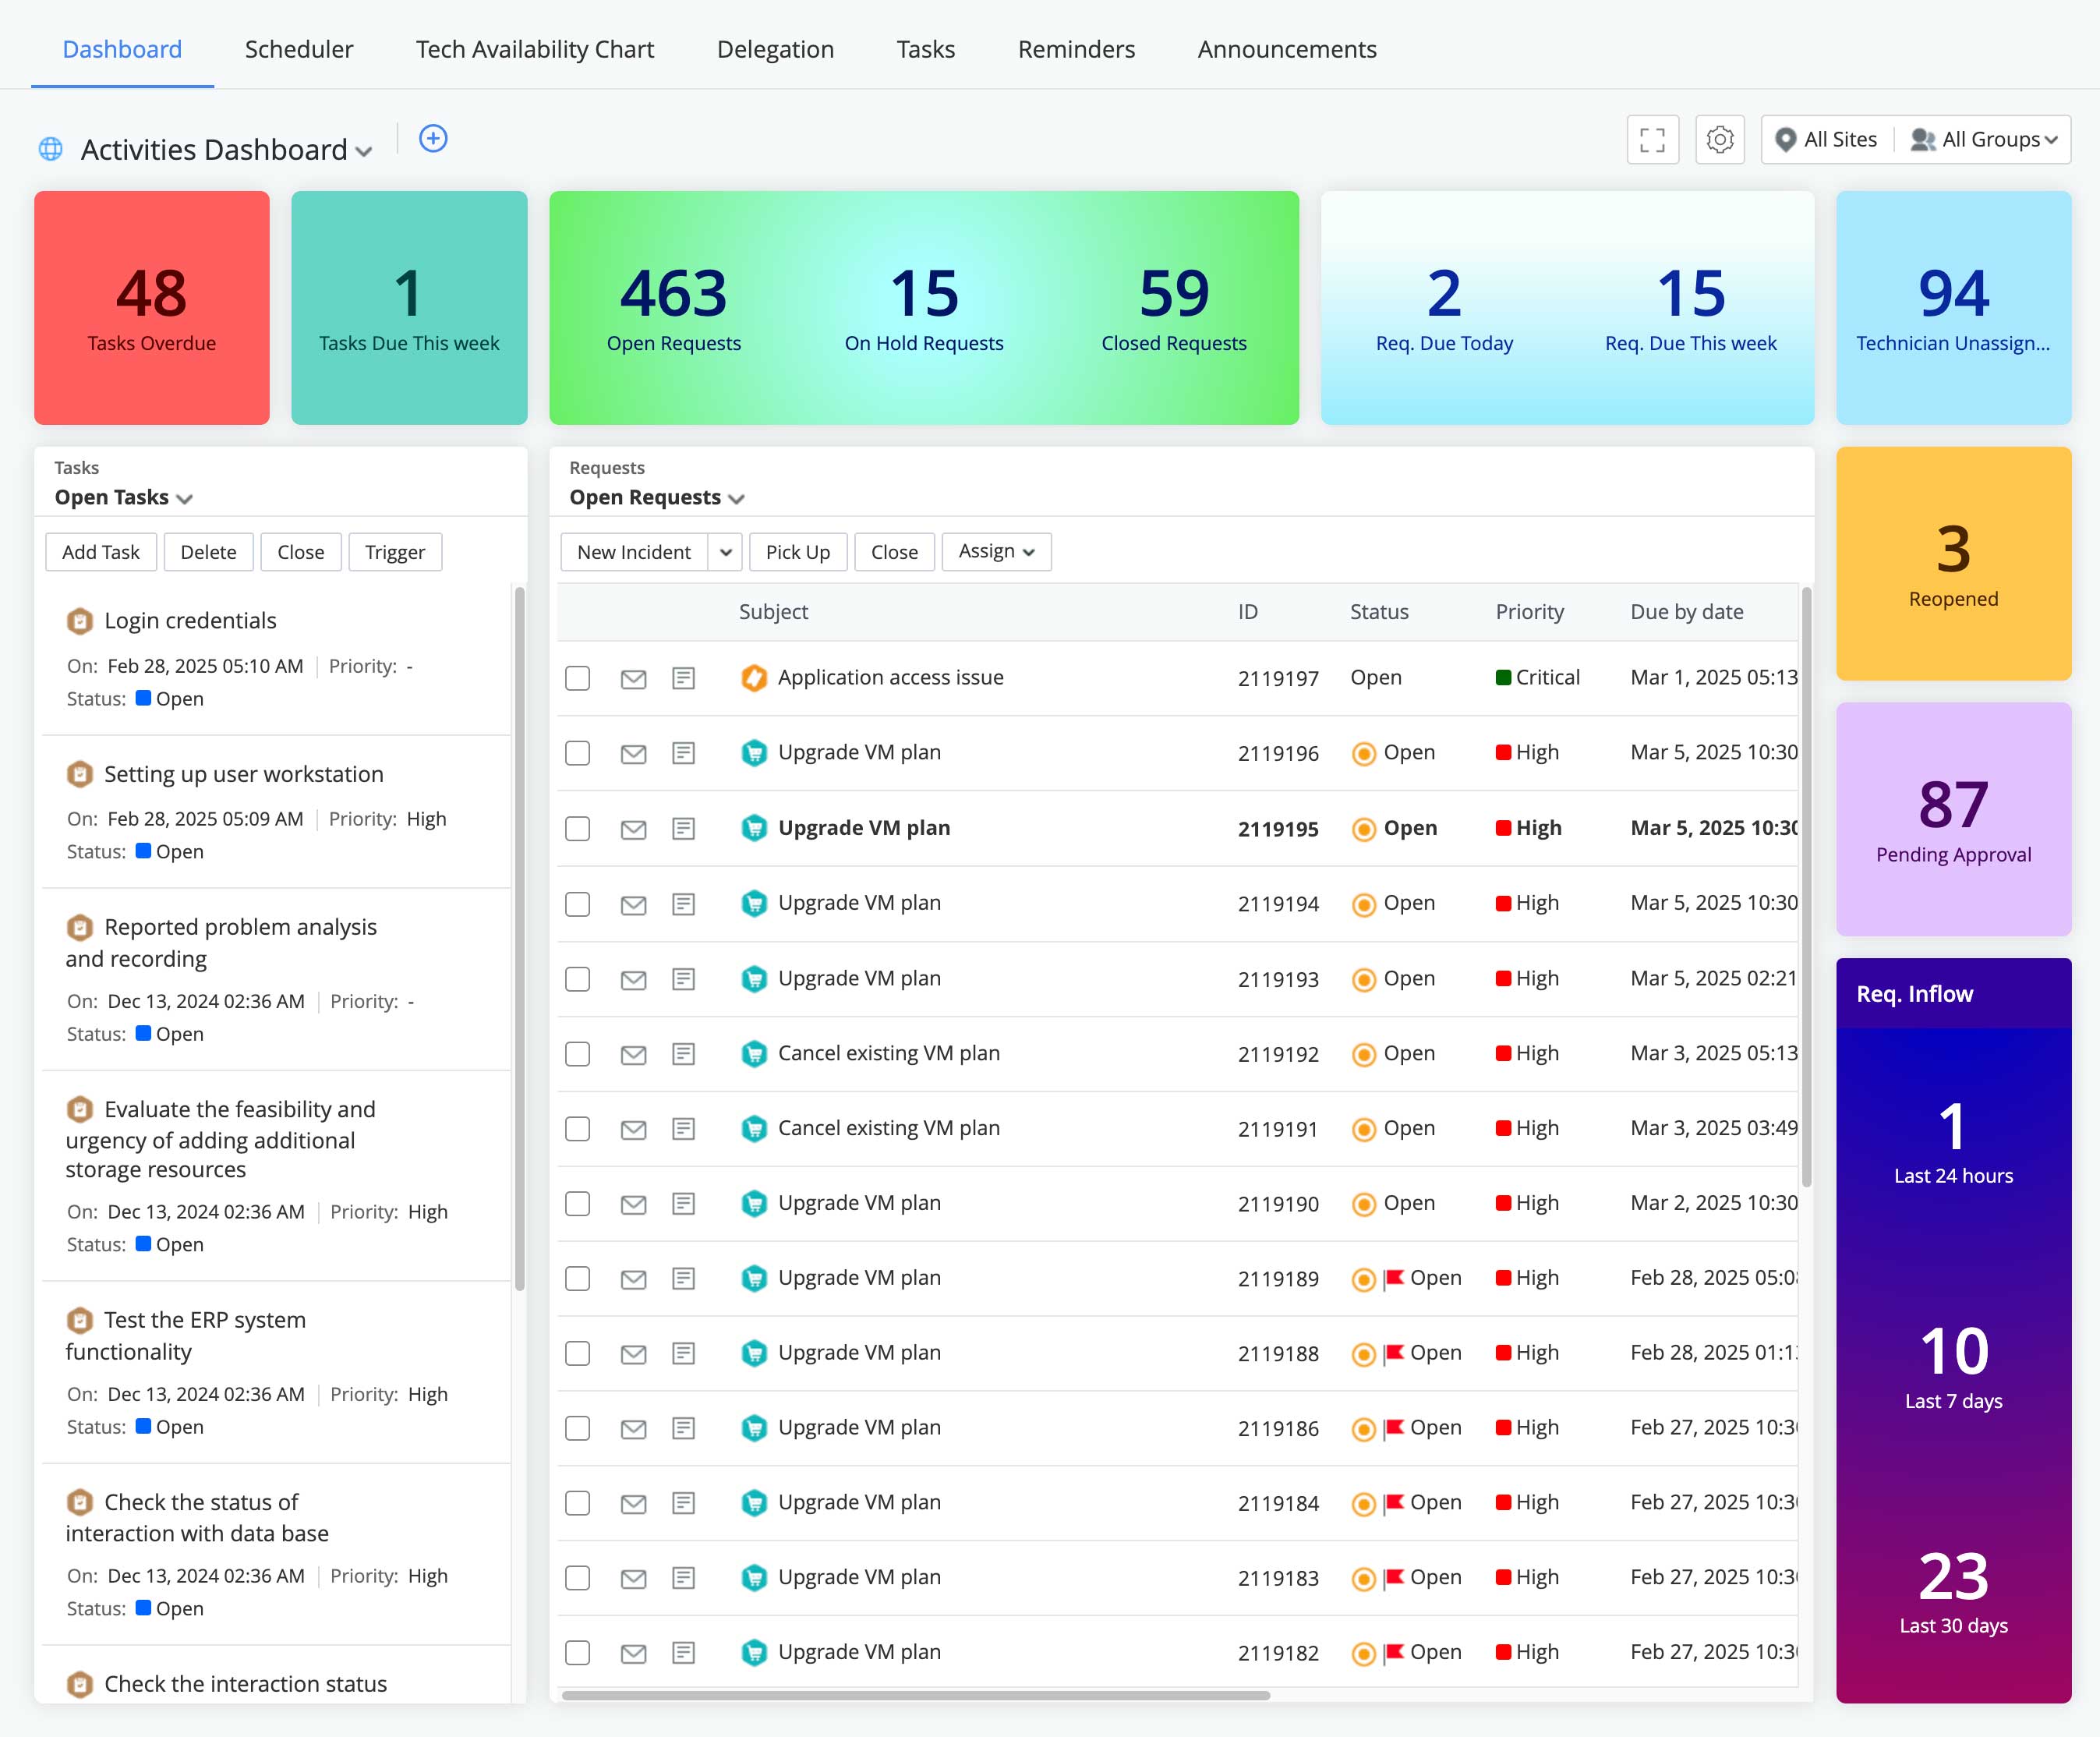
Build comprehensive dashboards that track broader trends, analyze metrics, and perform ticketing actions, all without losing context. Dashboards can be designed with multiple widgets while precisely configuring access permissions.

Boost productivity by enabling technicians to edit, assign, link, or close tickets directly within dashboards. Access conversations and other ticket data with smart views that maintain context without leaving the dashboard.
Visualize critical data and metrics using diverse graph types, including bar charts, pie charts, line graphs, pyramid charts, and summaries, delivering flexibility in representation. The summary graph type elevates key ITSM metrics—such as open incidents, request inflow, and overdue tasks—by presenting them in customizable card formats for enhanced clarity and streamlined monitoring.

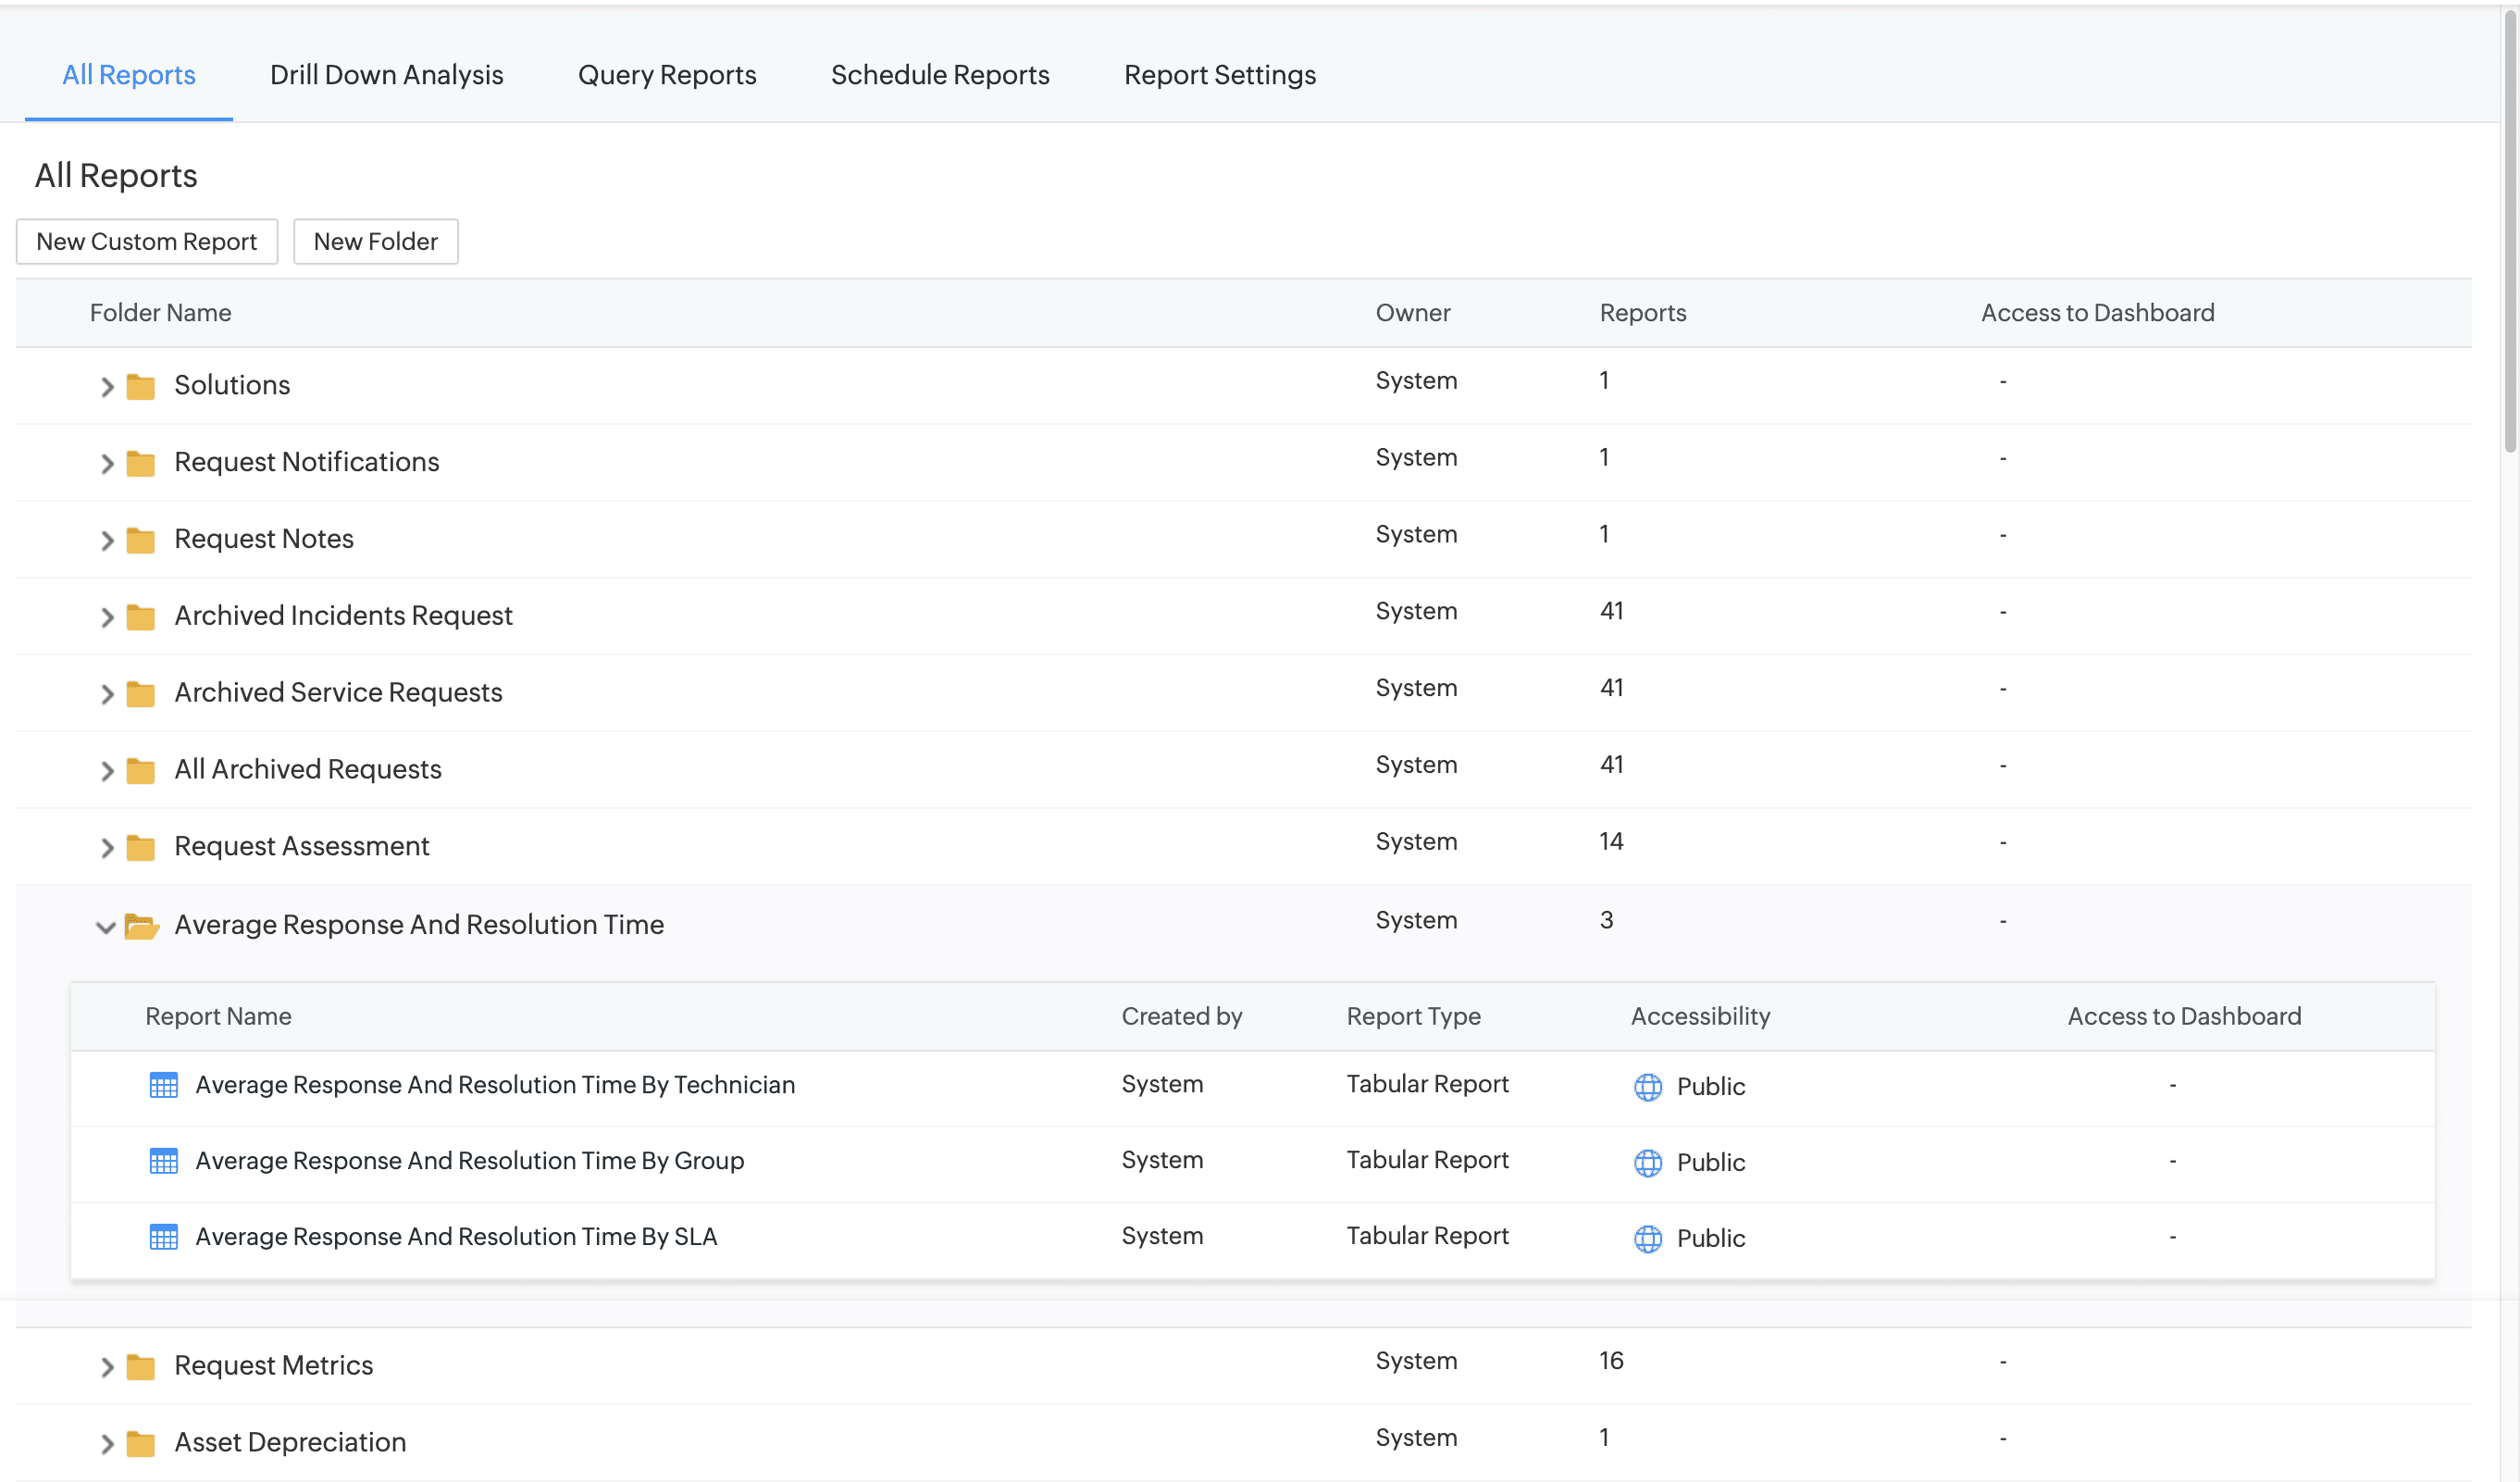
Tap into over 150 predefined reports in ServiceDesk Plus to gain a complete view of IT service desk performance across requests, incidents, problems, changes, assets, and more.

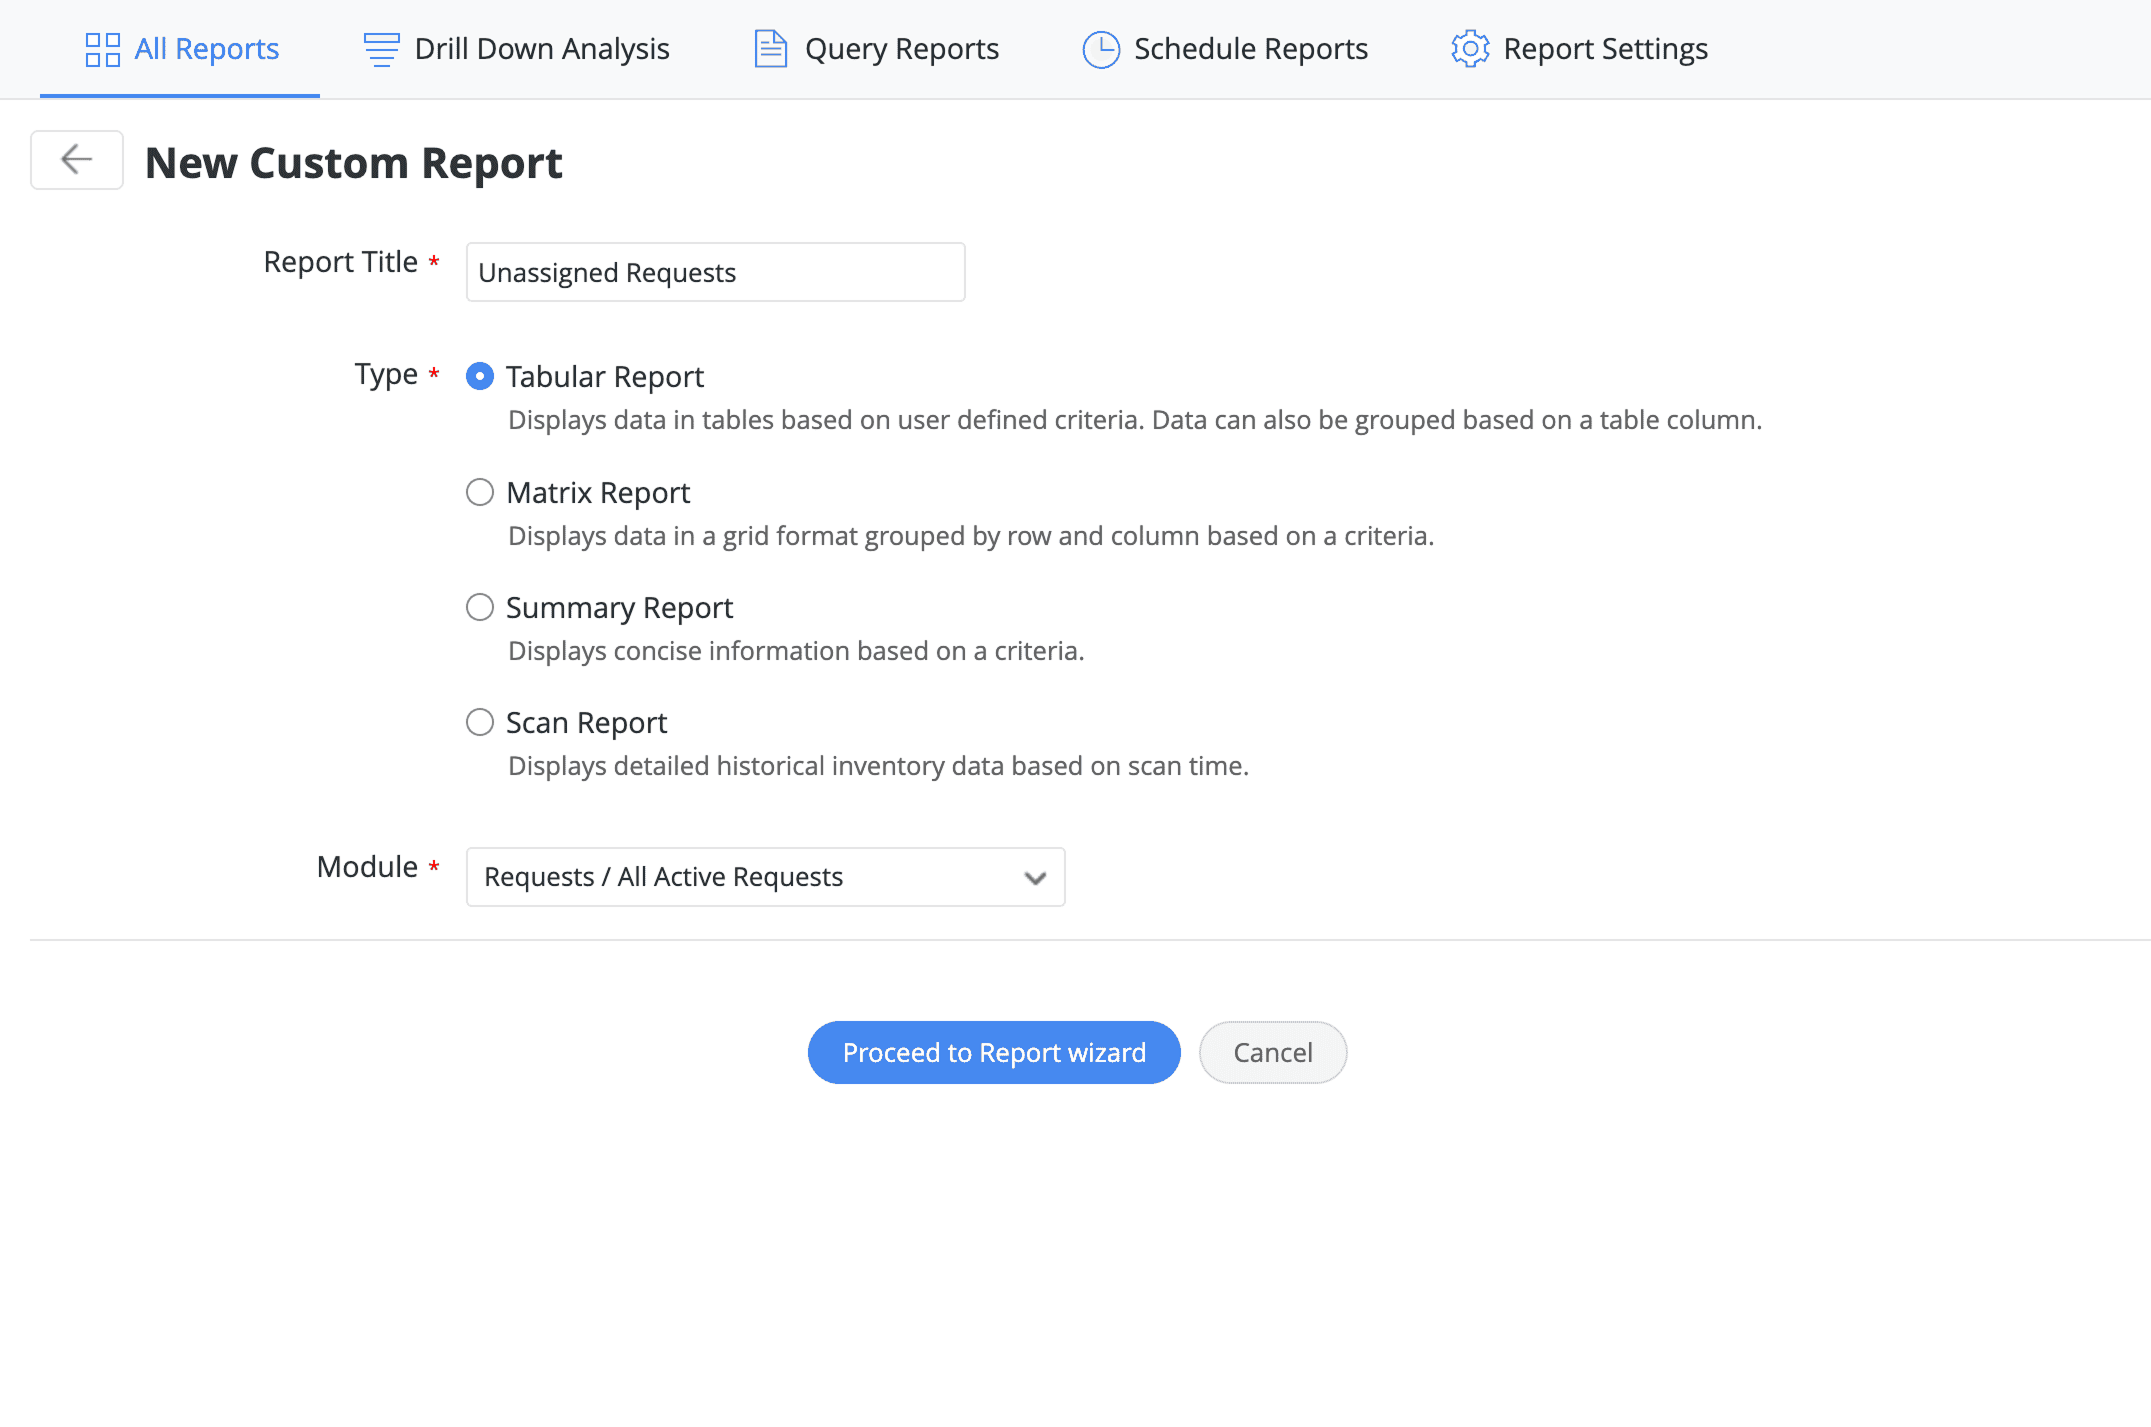
Easily spin up custom reports in ServiceDesk Plus to meet your specific needs. With the flexibility to filter, group, and organize data from any ITSM practice, transform raw data into meaningful insights using multifarious report formats. Keep stakeholders consistently informed with timely insights delivered through automated reports, customized to their preferred formats and intervals.
