Configuring Score Settings
Score Settings is where you define how the DEX Score is computed across your managed endpoints. This includes the thresholds that classify each metric as Good, Average, or Poor, the weightages that control how much each metric and category contributes to the overall score, and the baseline that reflects your organization's experience standard.
Changes to Score Settings take effect from the next scheduled scoring cycle.
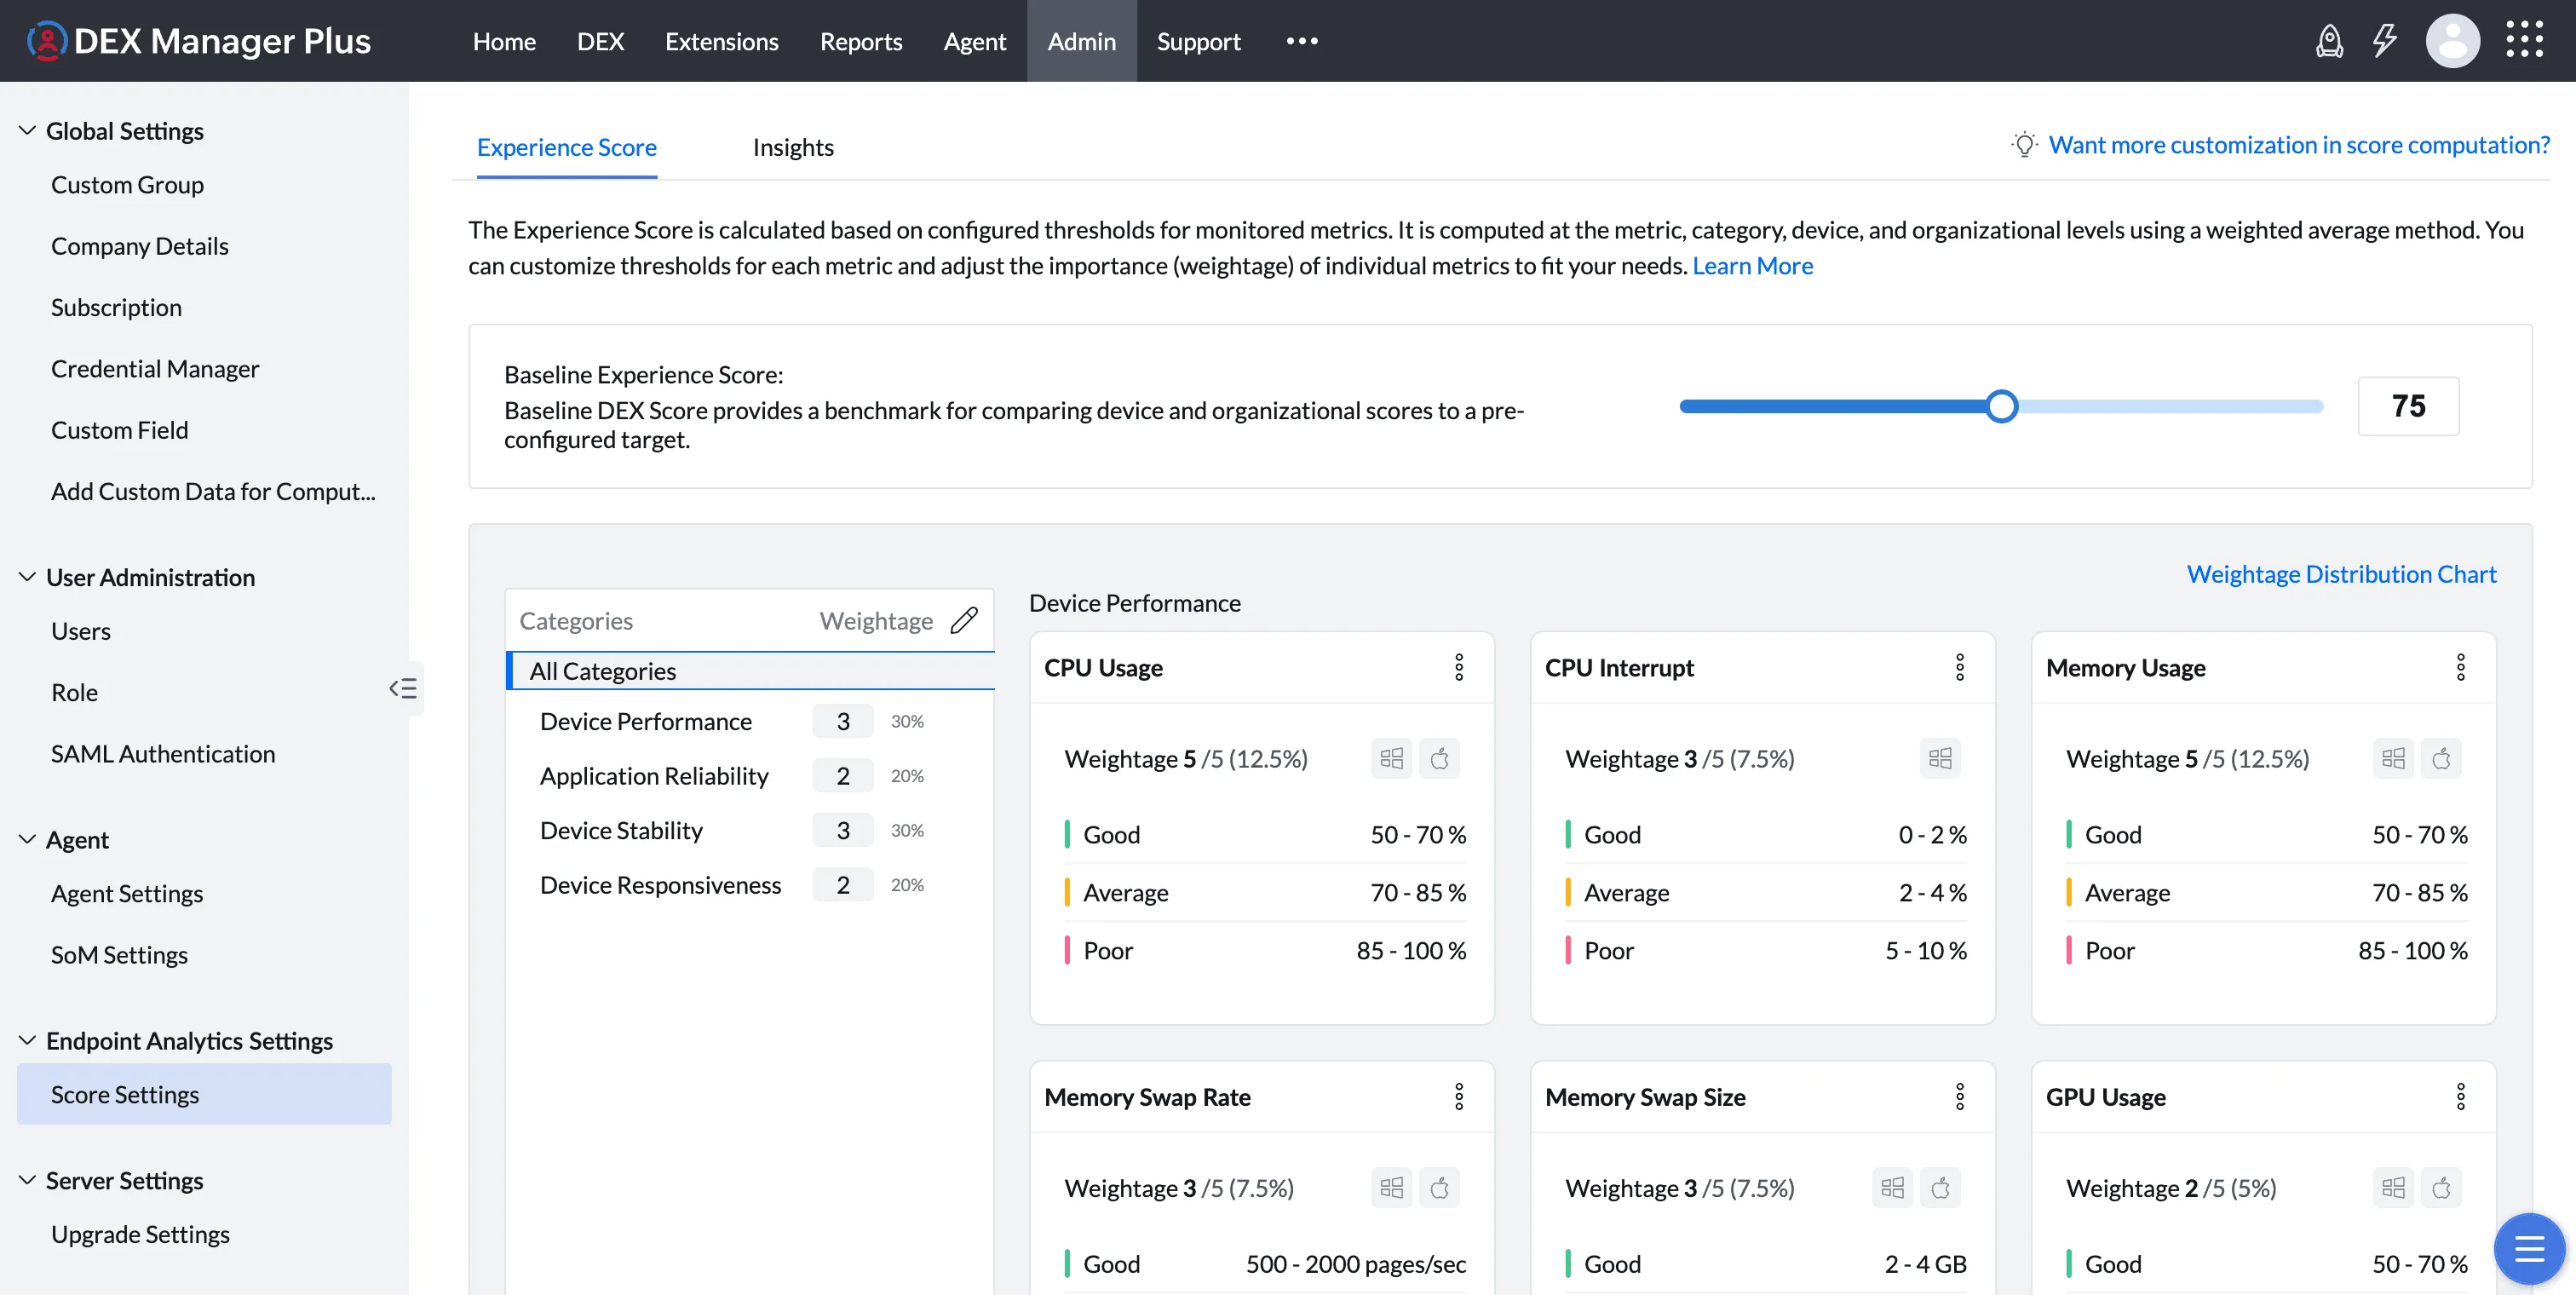
Metrics and Categories: What You Can Configure
There are two types of metrics in the DEX Score:
Predefined metrics are built into the four standard categories and start collecting data automatically. They come with default thresholds that represent common baselines, but you can modify those thresholds, adjust weightages, or disable any metric that is not relevant to your environment.
User-defined metrics are metrics you create yourself. You can add them to any existing predefined category or to a new custom category you create. These let you extend the DEX Score beyond the built-in dimensions.
When creating a custom category, you choose between two types:
- A general experience category uses sensor fields as its metric source. Use this for any experience dimension other than user feedback, such as security posture or compliance indicators.
- A sentiment experience category is specifically for capturing user feedback through Engage. Only Engage stages from deployed workflows can be added as metrics in a sentiment experience category. Sensor fields cannot be used in it.
1. Configuring Metric Thresholds
Threshold configuration applies to both predefined and user-defined metrics. For every metric, regardless of type, you can update the threshold parameters that define what measured values fall into the Good, Average, and Poor bands.
The score function type - which determines how those thresholds are evaluated - works differently for each metric type:
- For predefined metrics, the score function is set by the system and cannot be changed.
- For user-defined metrics, the score function is chosen when the metric is first added and cannot be changed after that. Only the threshold parameters can be updated.
You set threshold parameters in the unit of the metric itself. For example:
- CPU Usage: below 70% = Good, 70% to 85% = Average, above 85% = Poor
- Boot Duration: below 30 seconds = Good, 30 to 60 seconds = Average, above 60 seconds = Poor
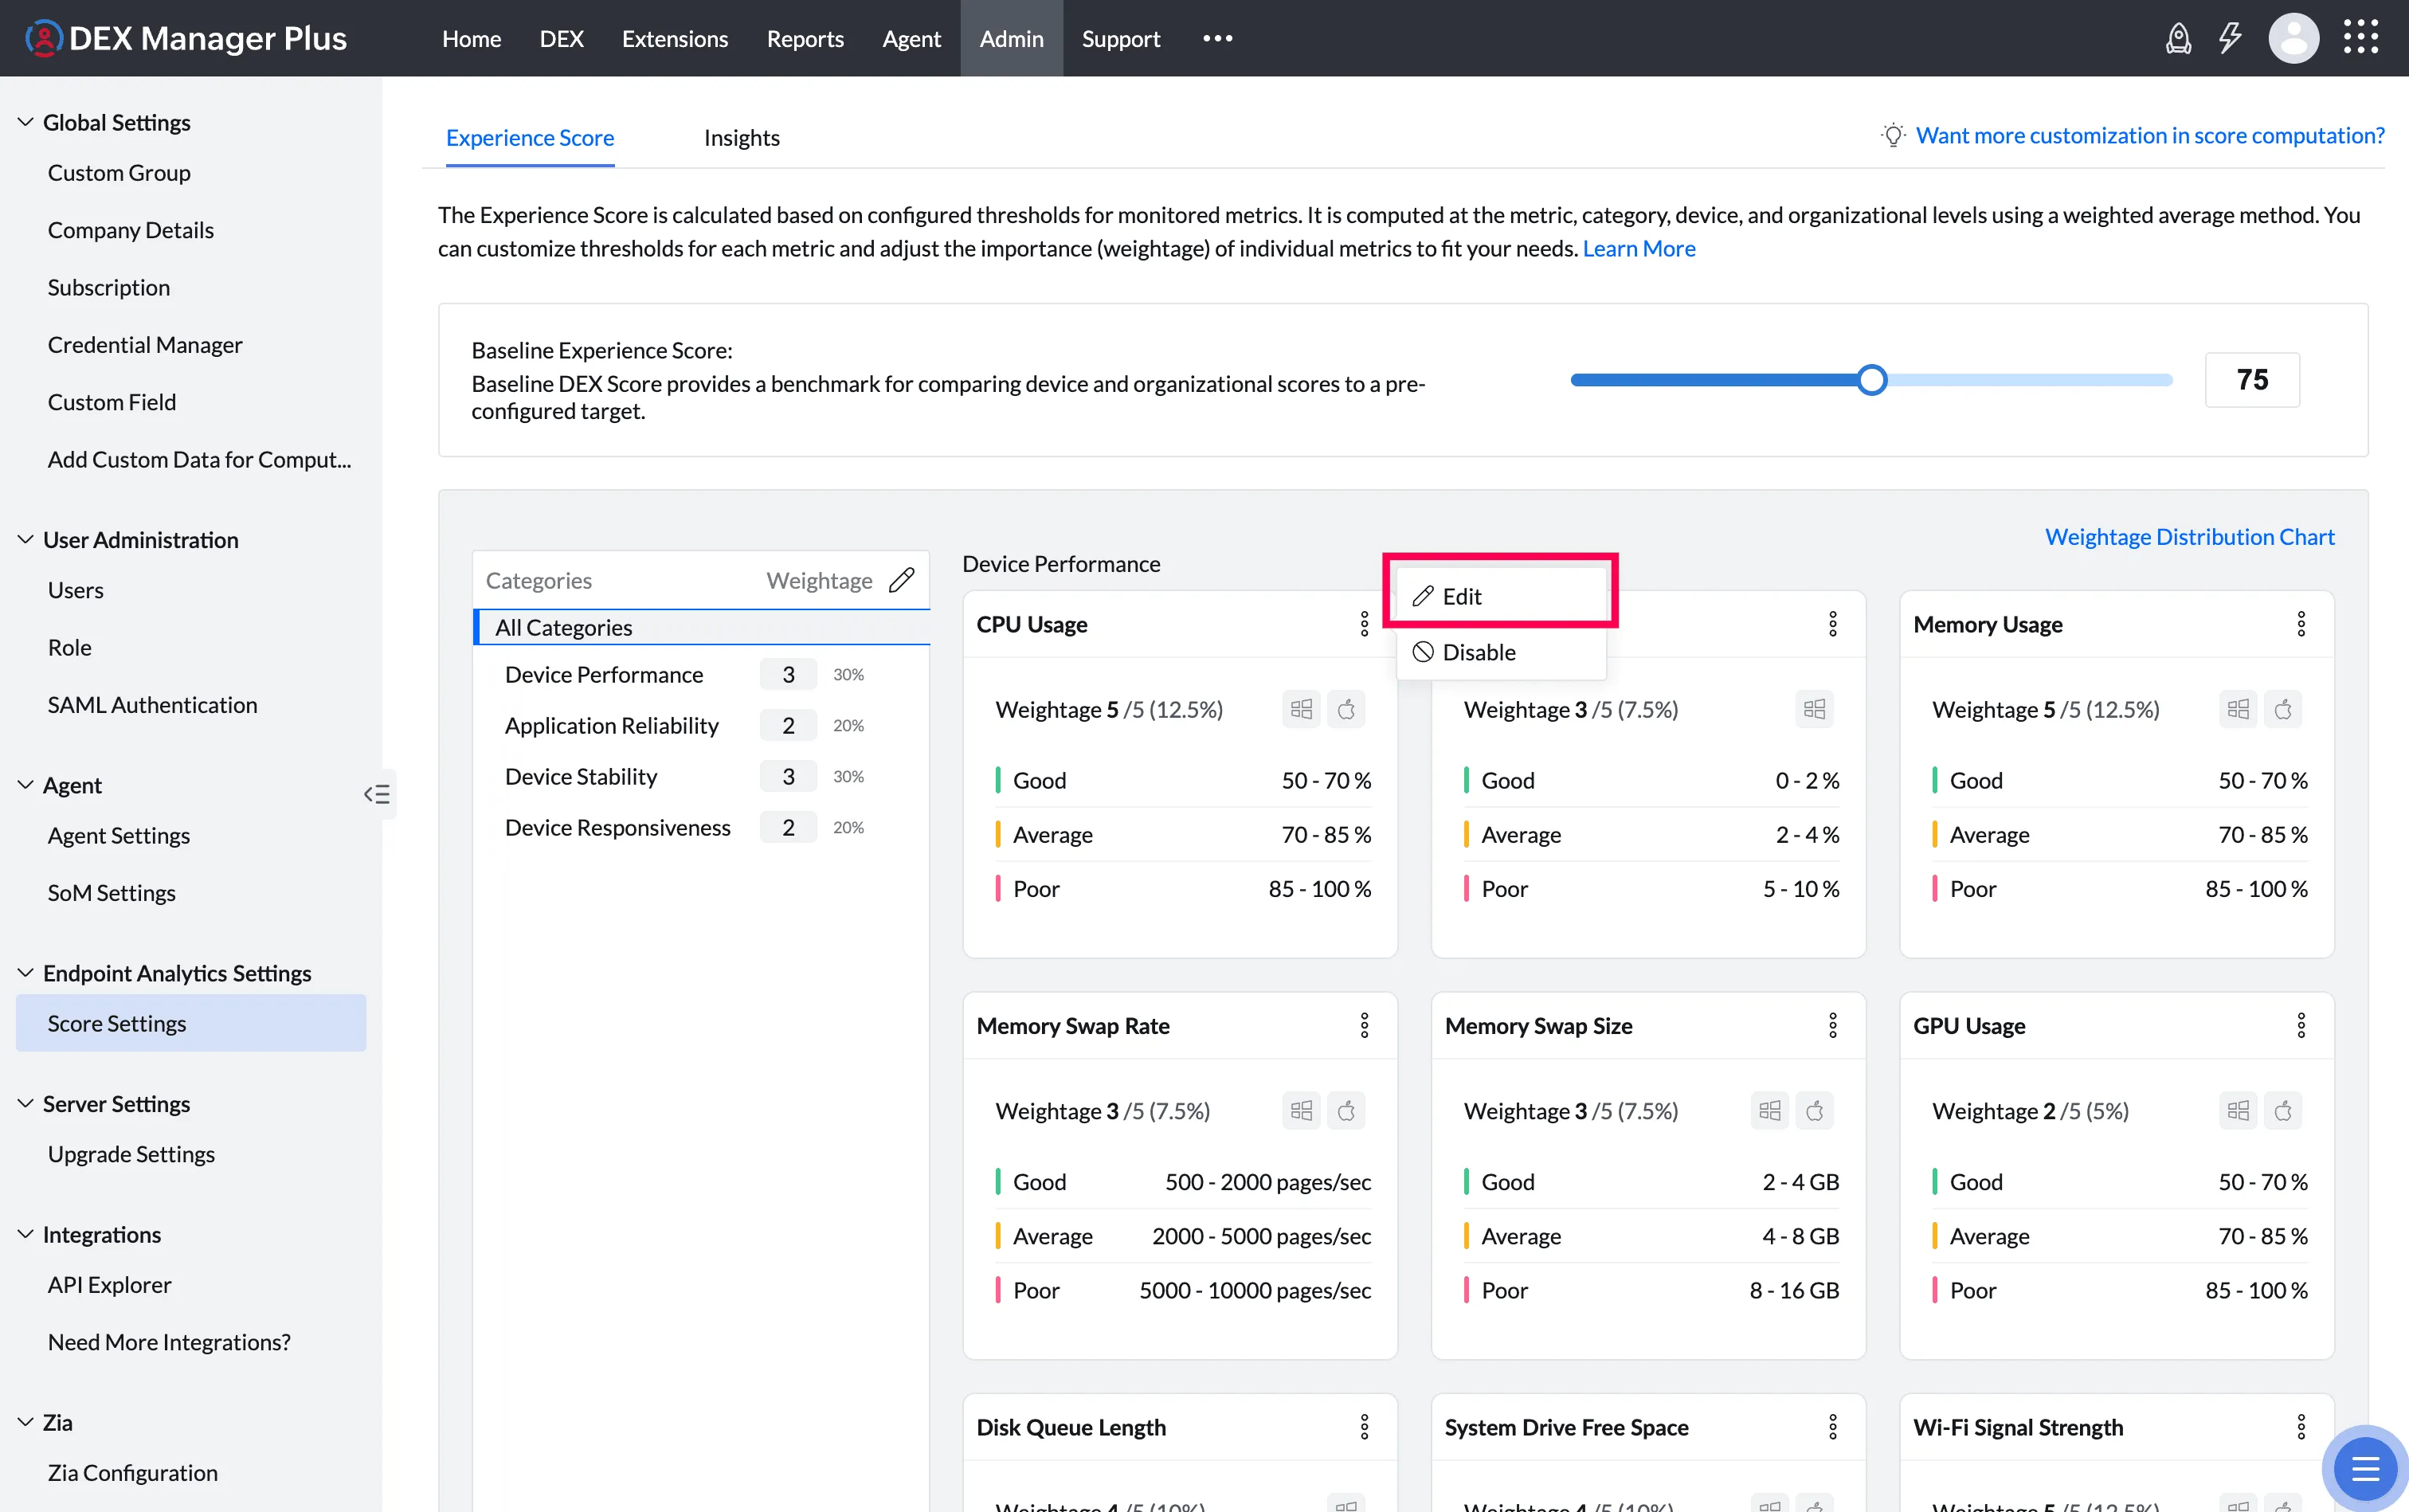
To configure thresholds for a metric:
- Click the three-dot menu of a metric tile and select Edit.
- Use the color-coded sliders to set the boundary values between Good, Average, and Poor.
- Click Save.
Setting thresholds that reflect your actual environment gives you a more meaningful score.
2. Configuring Metric Weightage
Within each category, individual metrics can carry different weights depending on how much they affect user experience in your environment. A metric that is more disruptive to users should be weighted higher.
Weights are assigned on a scale of 1 to 5. The system normalizes these into percentages so the category total always equals 100%.
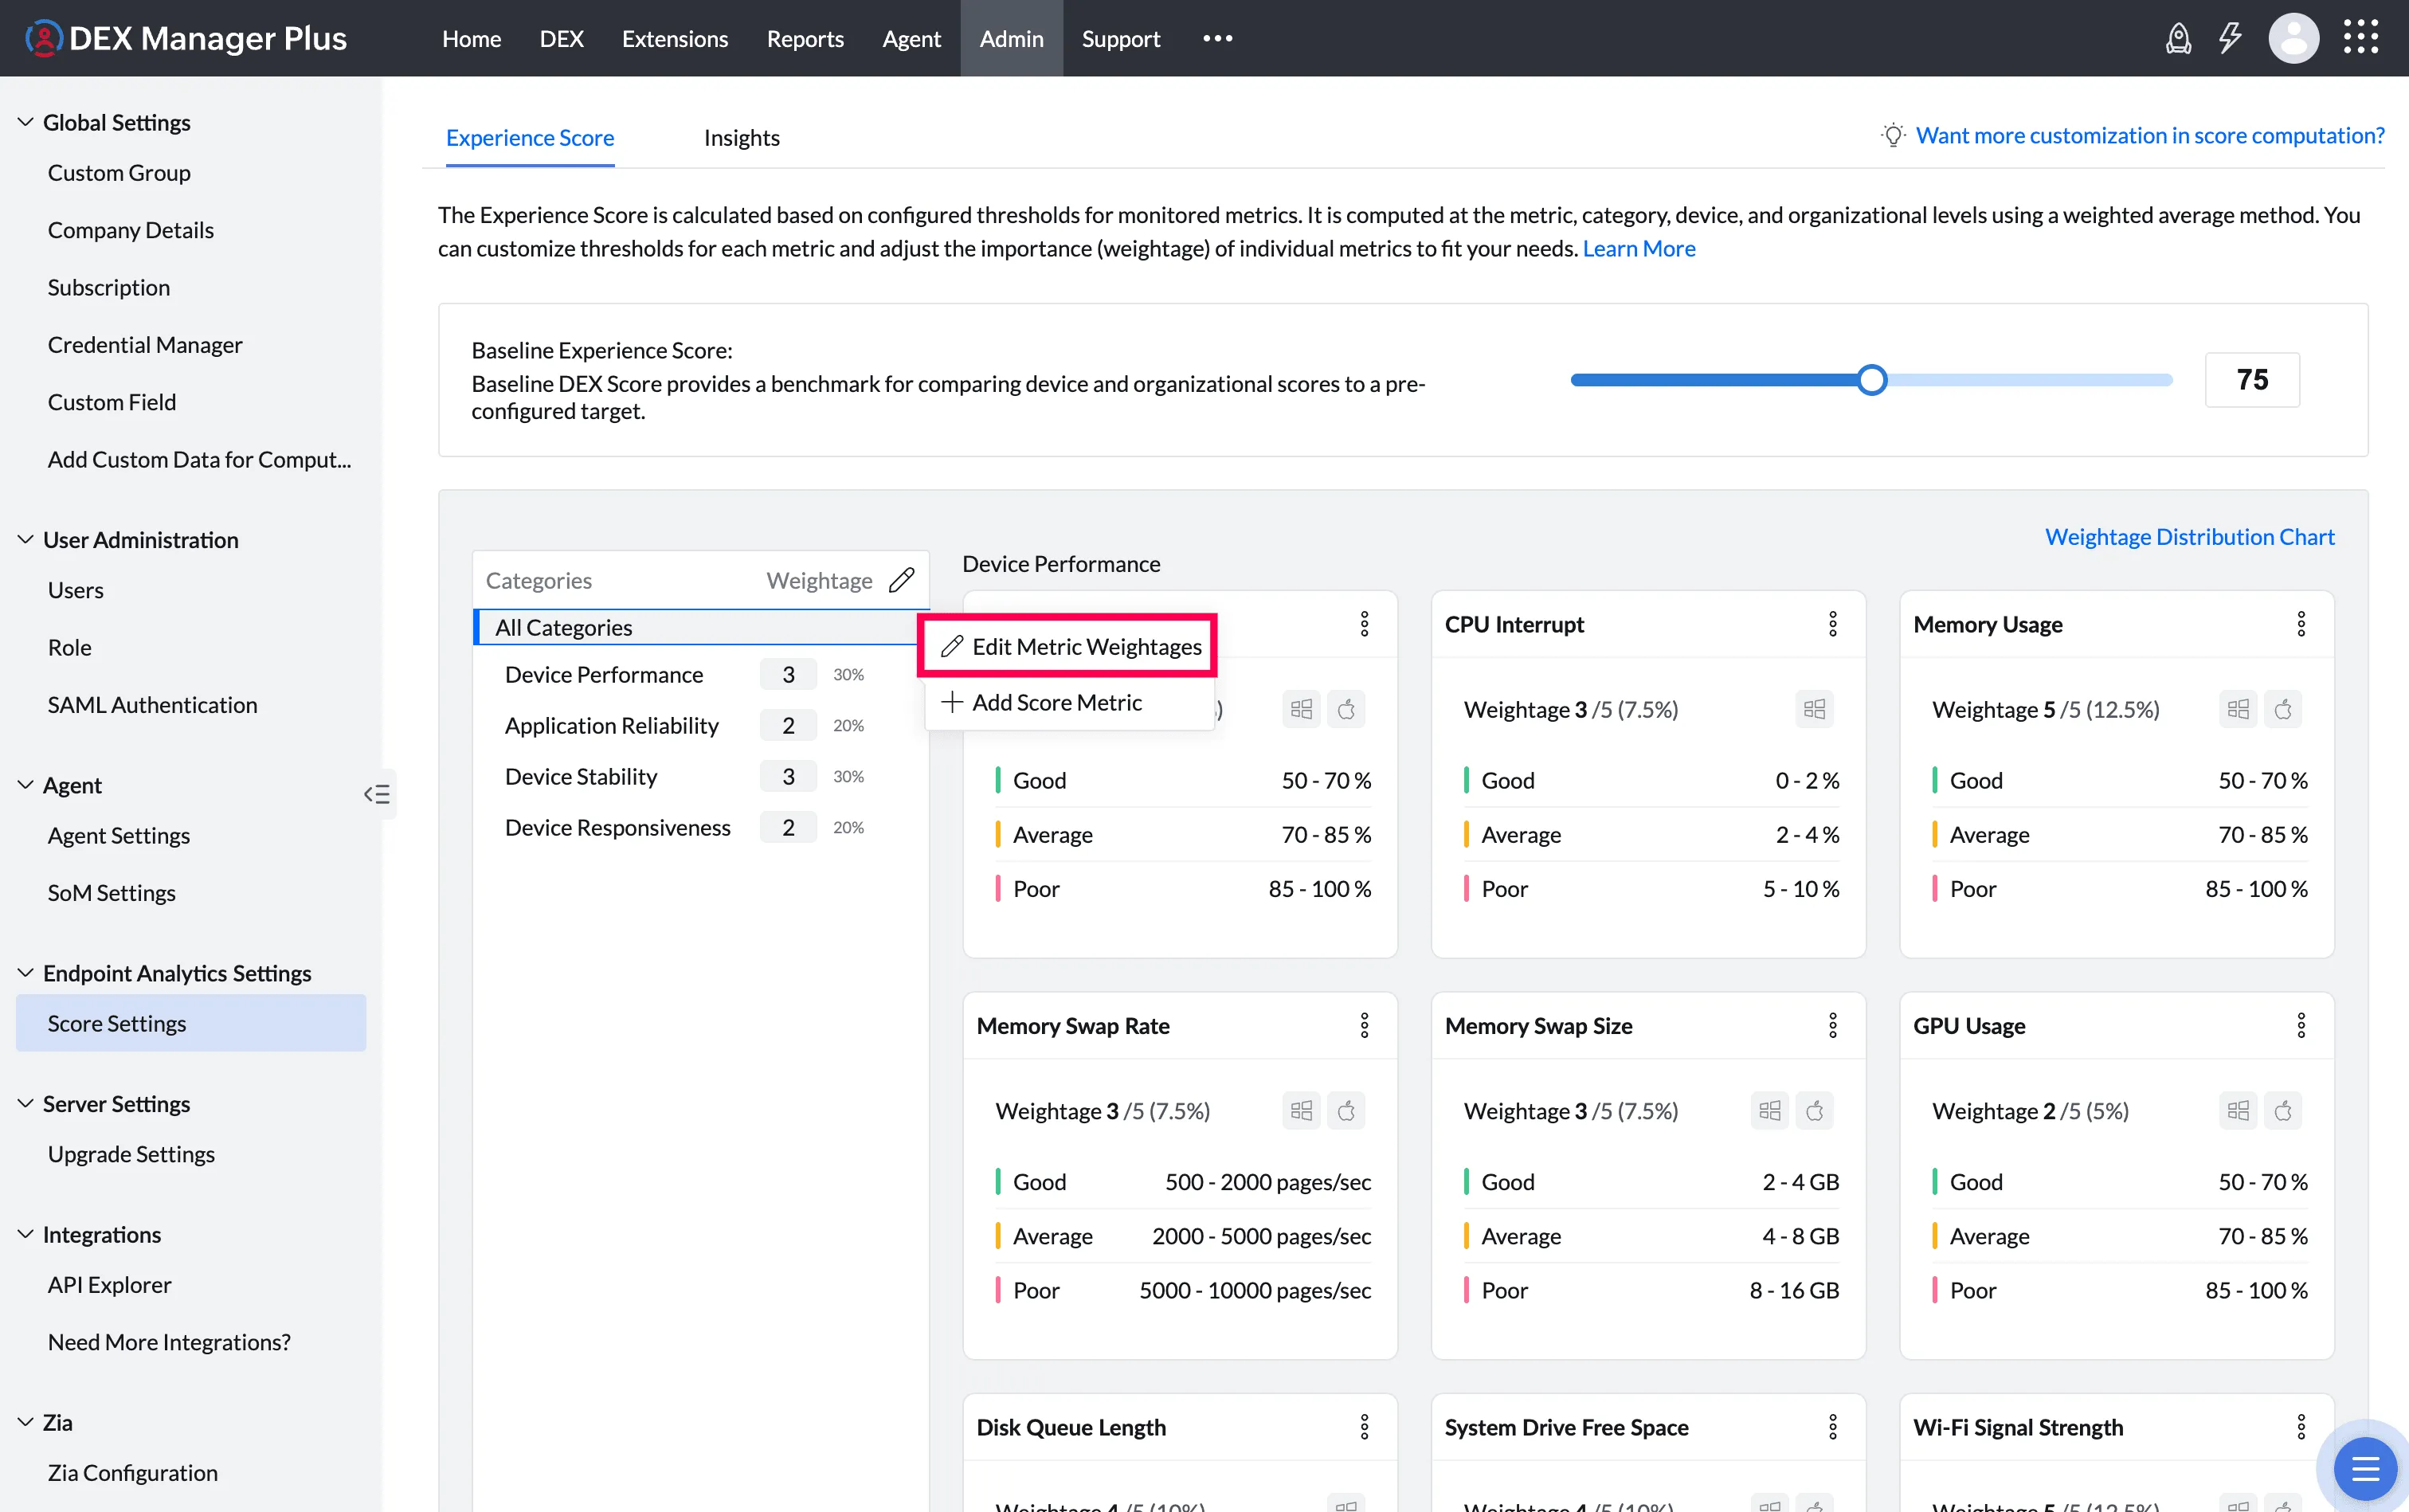
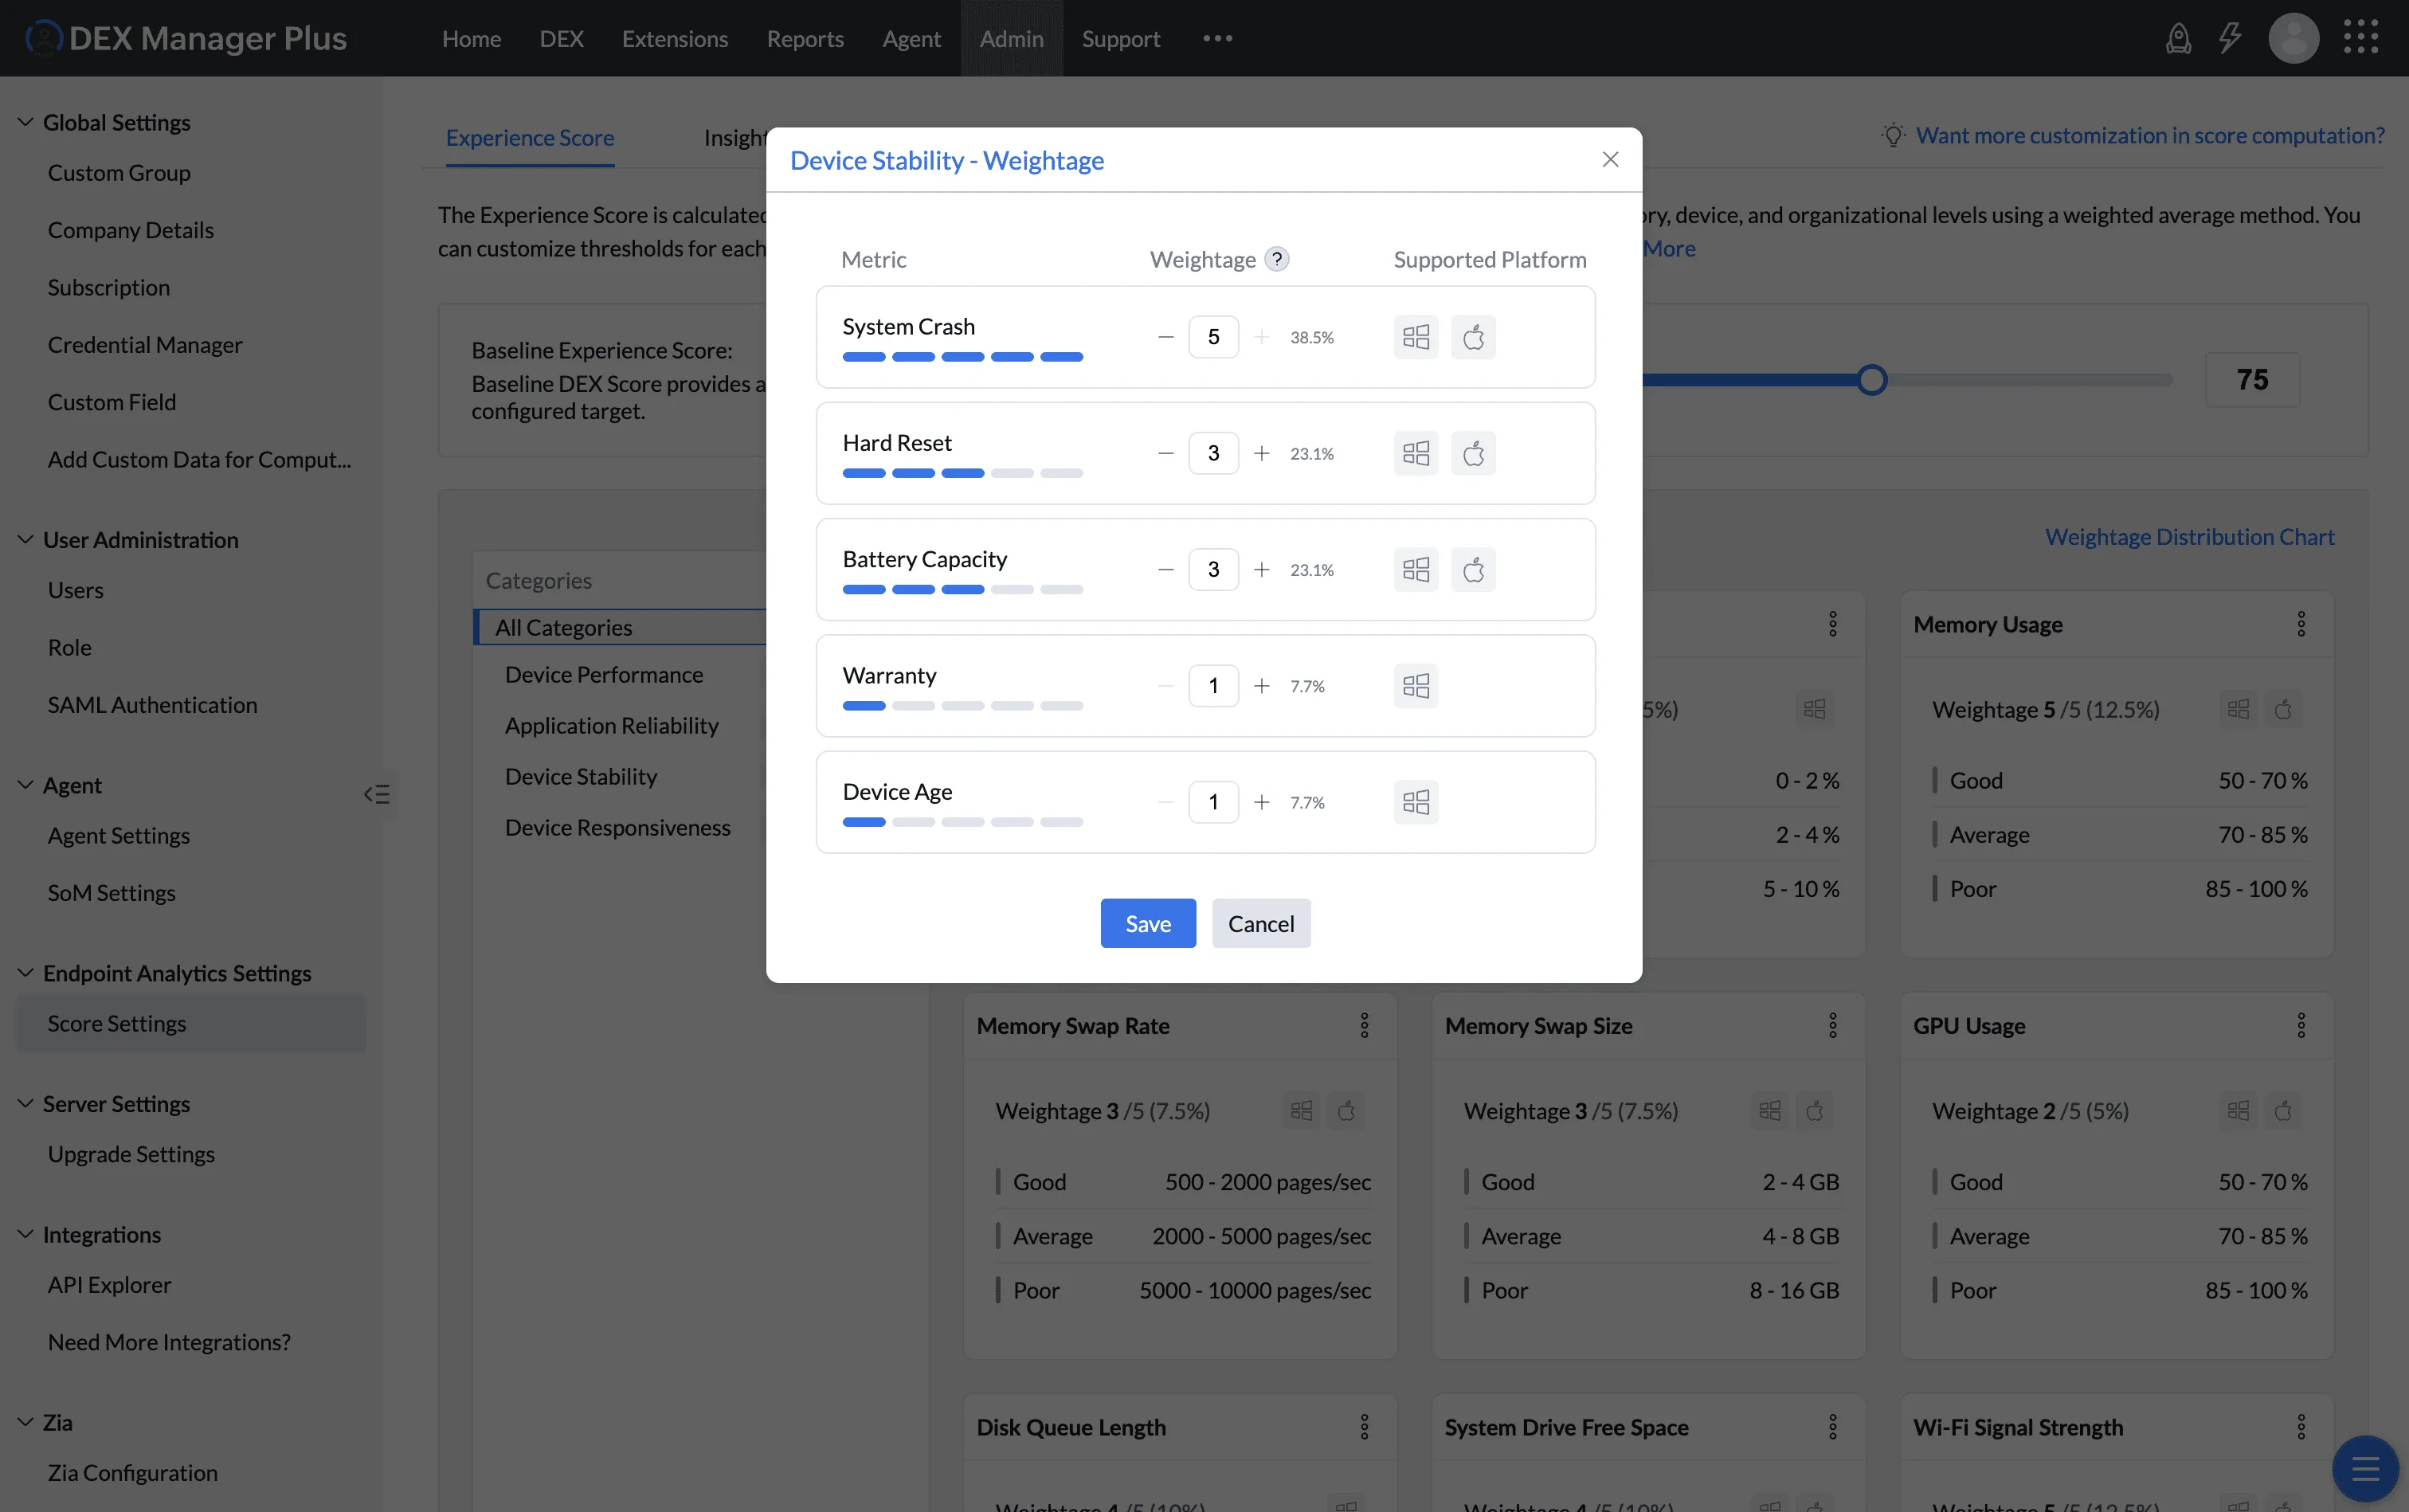
To adjust metric weightage:
- Hover over the category and click its three-dot menu.
- Select Edit Metric Weightages.
- Adjust the weight for each metric using the slider.
- Click Save.
Changing one metric's weight automatically adjusts the relative percentage of all other metrics in the same category, since all weights must sum to 100%.
3. Configuring Category Weightage
The four built-in categories each contribute to the overall DEX Score based on their assigned weight. Adjust this to reflect what matters most in your environment.
| Category | Covers |
|---|---|
| Device Performance | CPU, memory, disk, and network usage metrics |
| Device Stability | System crashes, battery capacity, device age, and warranty |
| Device Responsiveness | Boot time, logon duration, and input delay |
| Application Reliability | Application crash frequency |
Weights are assigned on a scale of 1 to 5 and normalized to percentages automatically.
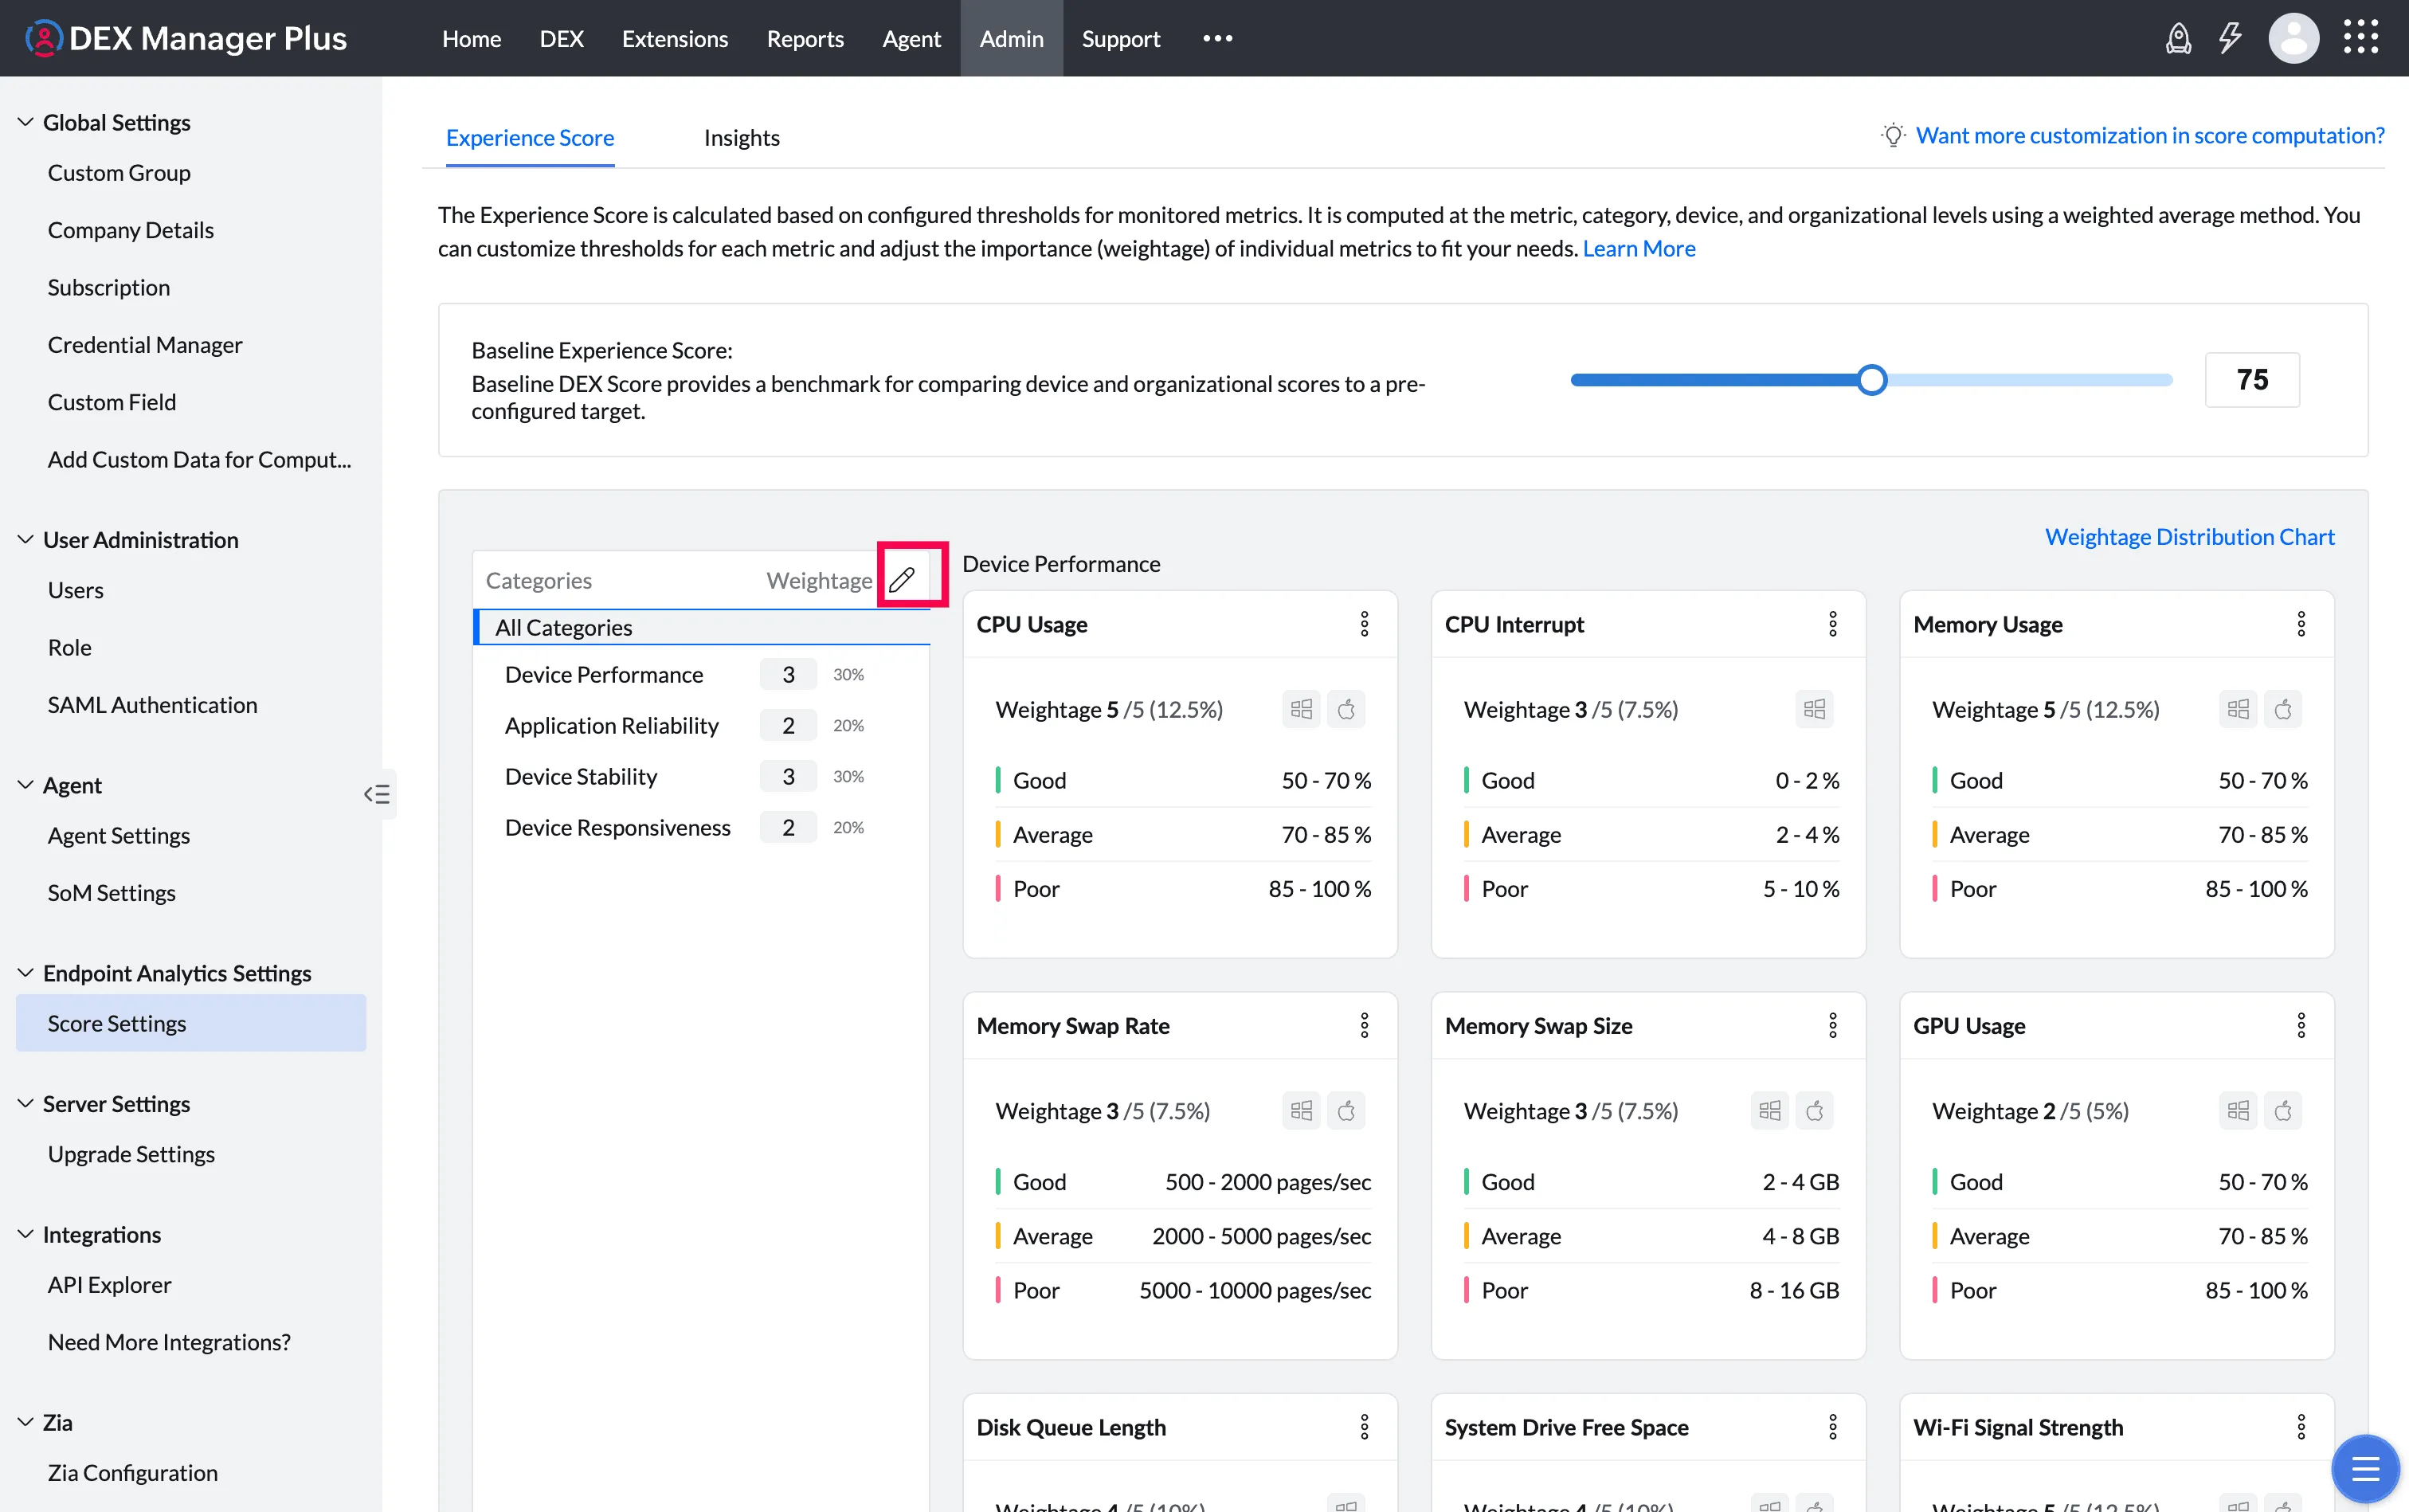
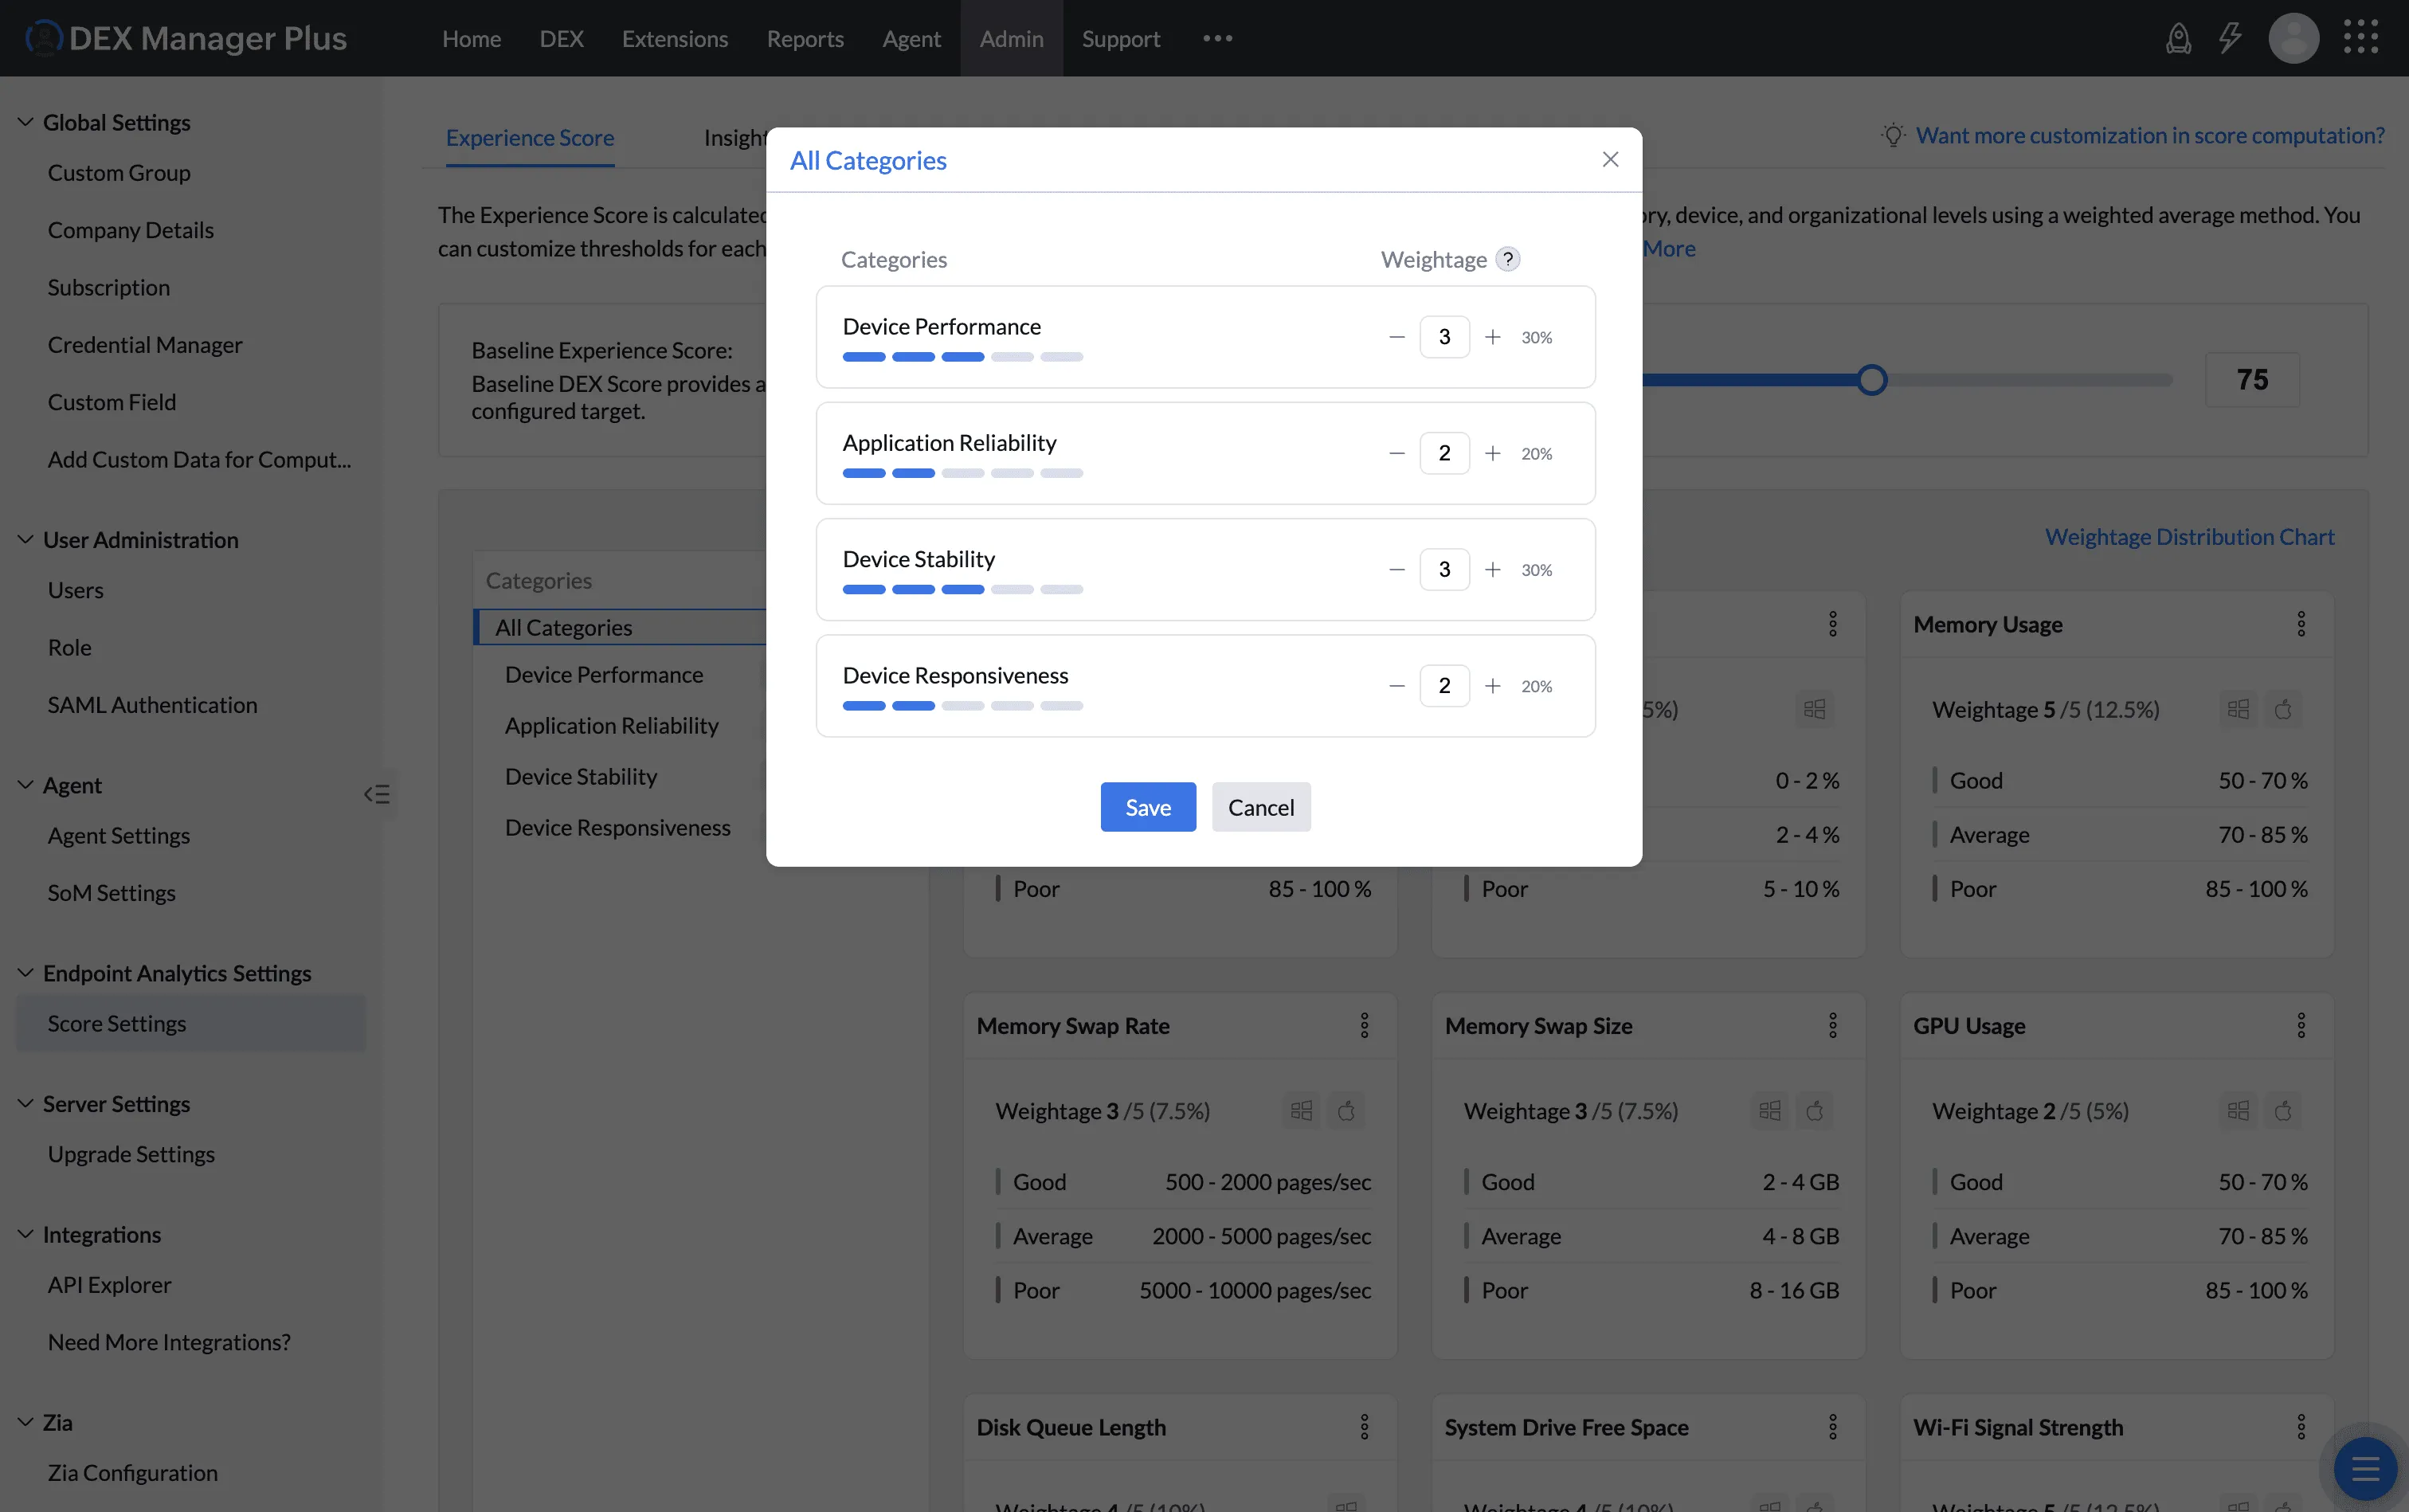
To adjust category weightage:
- Click the pencil icon next to Categories.
- Move the slider for each category to the desired weight.
- Click Save.
Assign higher weights to categories that reflect your business-critical priorities. For example, if your workforce is remote and relies heavily on video conferencing, weighting Device Responsiveness and Device Performance higher makes the score more representative of their experience.
4. Disabling Metrics
If a metric is not relevant to your environment, you can disable it. Disabled metrics are excluded from score calculations and hidden in dashboards, reports, and device detail views.
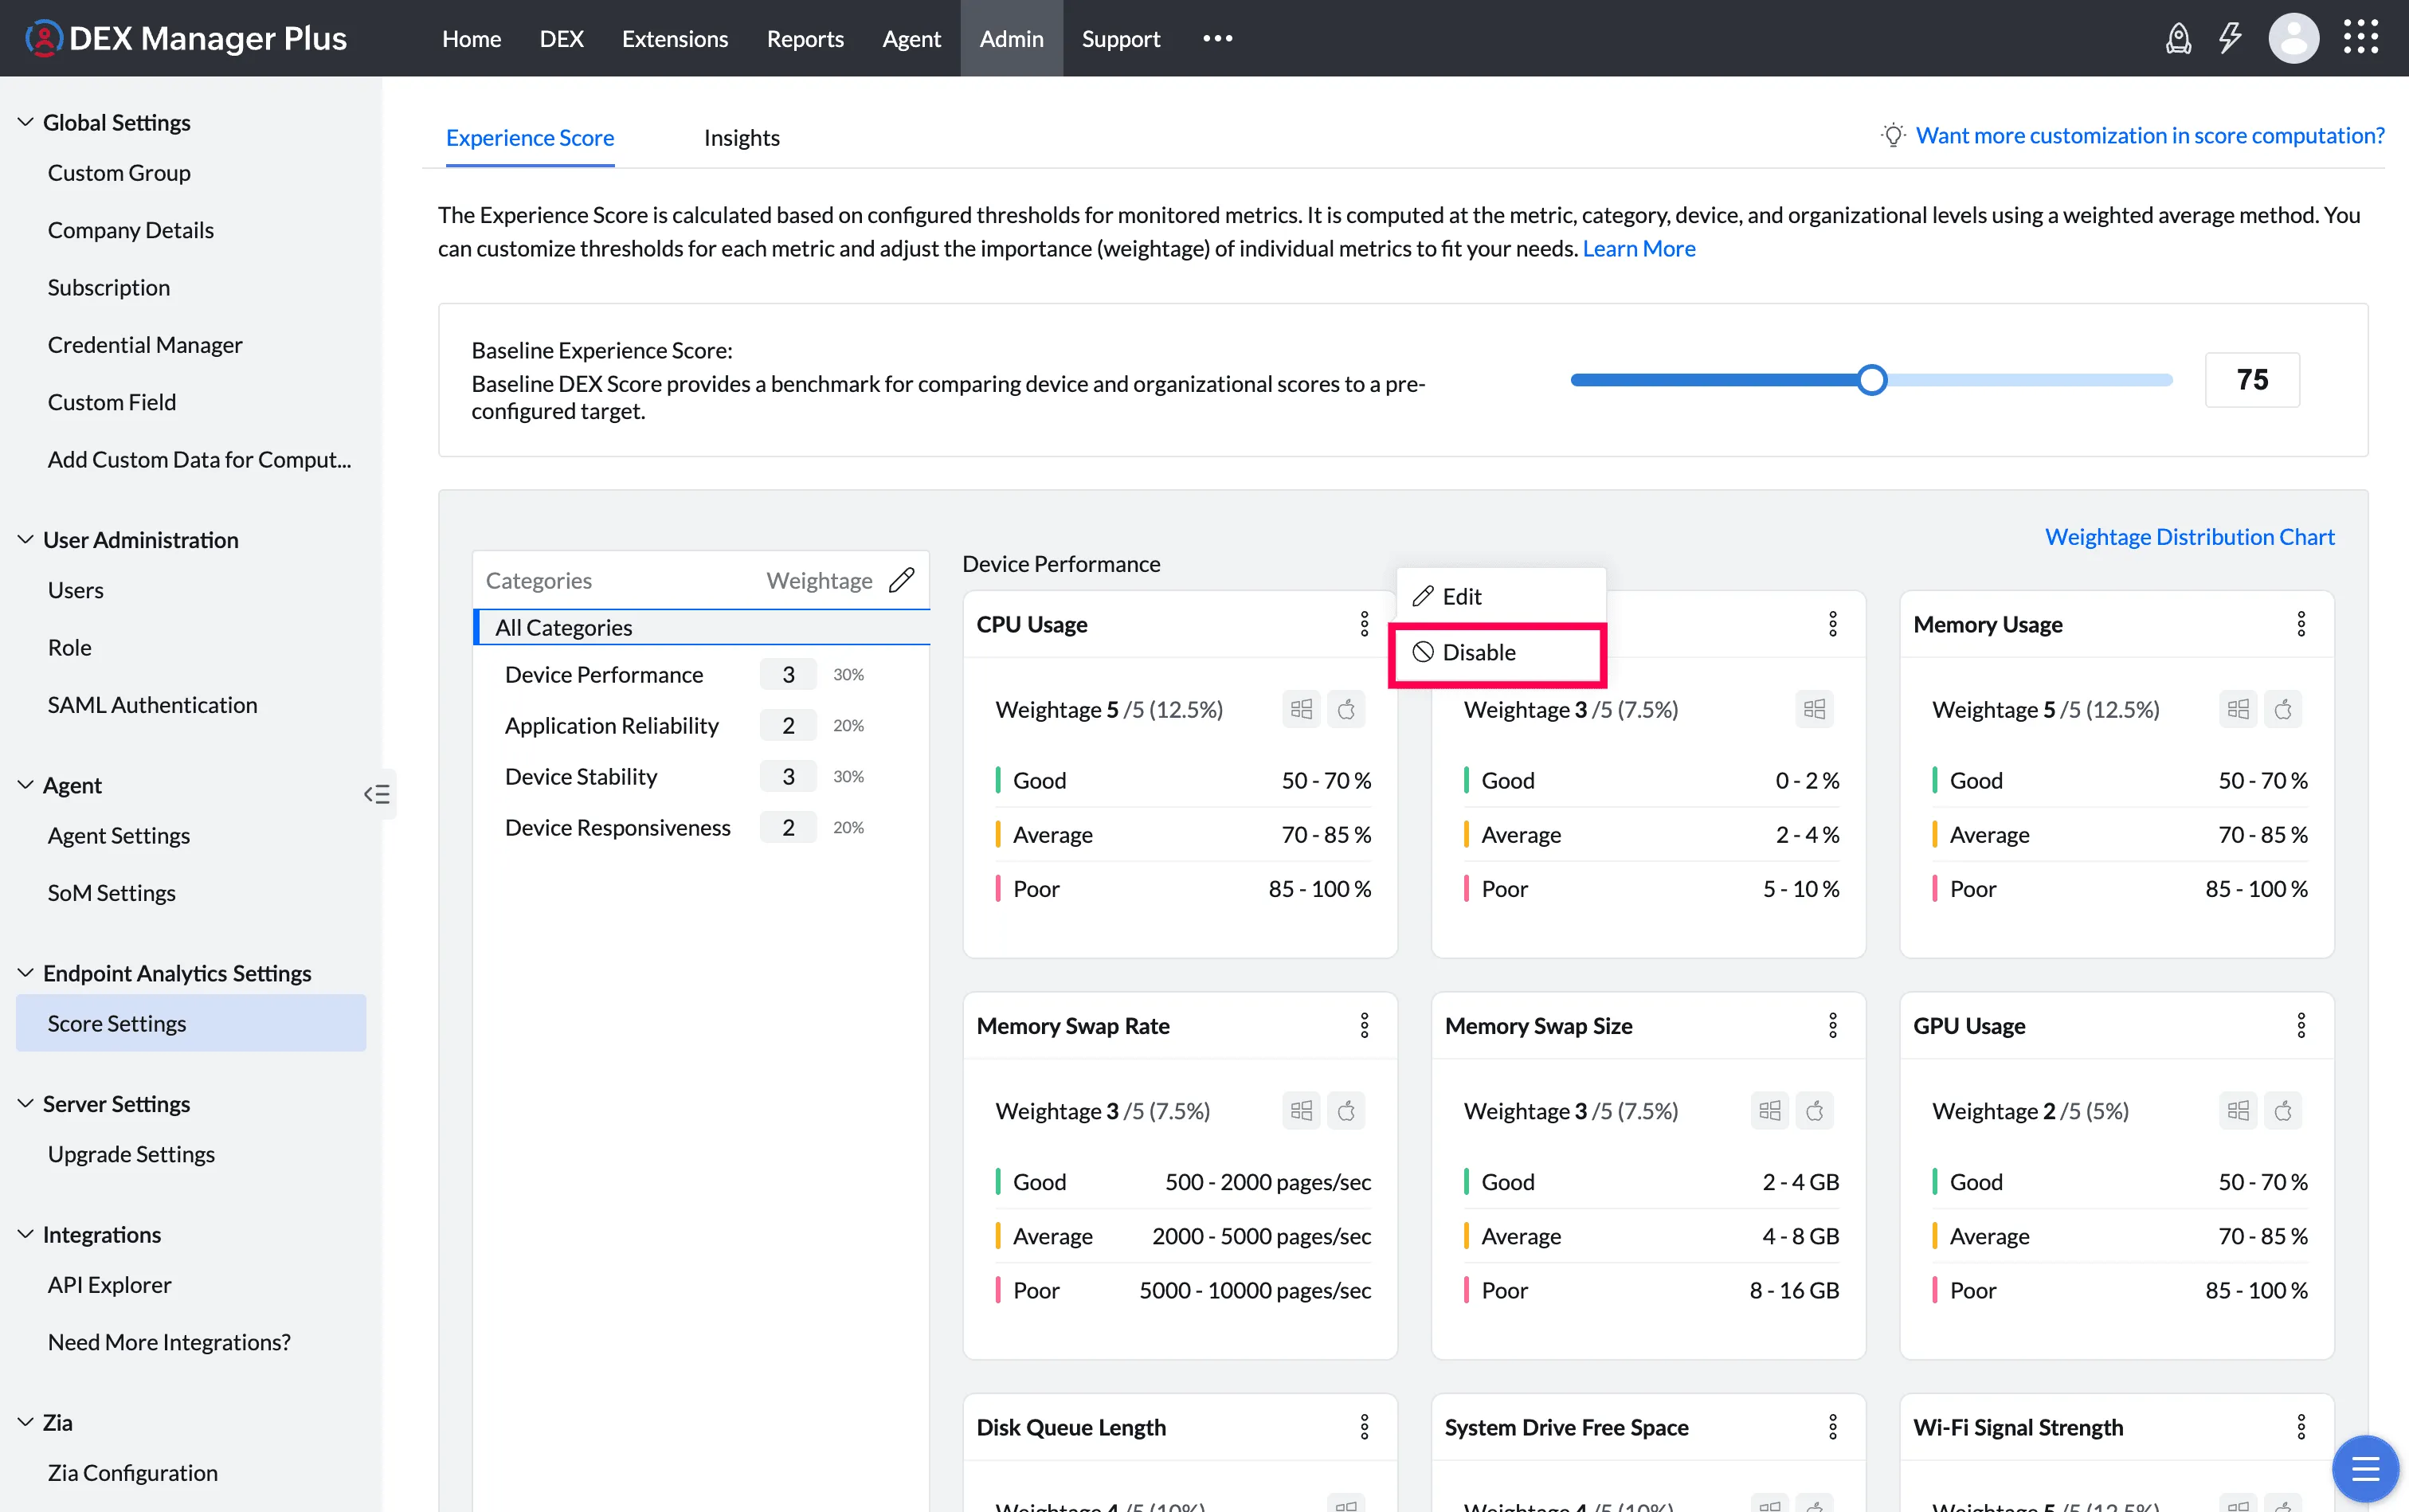
To disable a metric:
- Click on the metric tile.
- Click Disable.
- Click Save.
This is especially useful during initial rollout. Start with the metrics most relevant to your environment and enable others as your scoring model matures.
5. Setting the Baseline Score
The baseline score is the minimum DEX Score you consider acceptable for a device in your organization. Devices that fall below this value are flagged in dashboards and insights for follow-up.
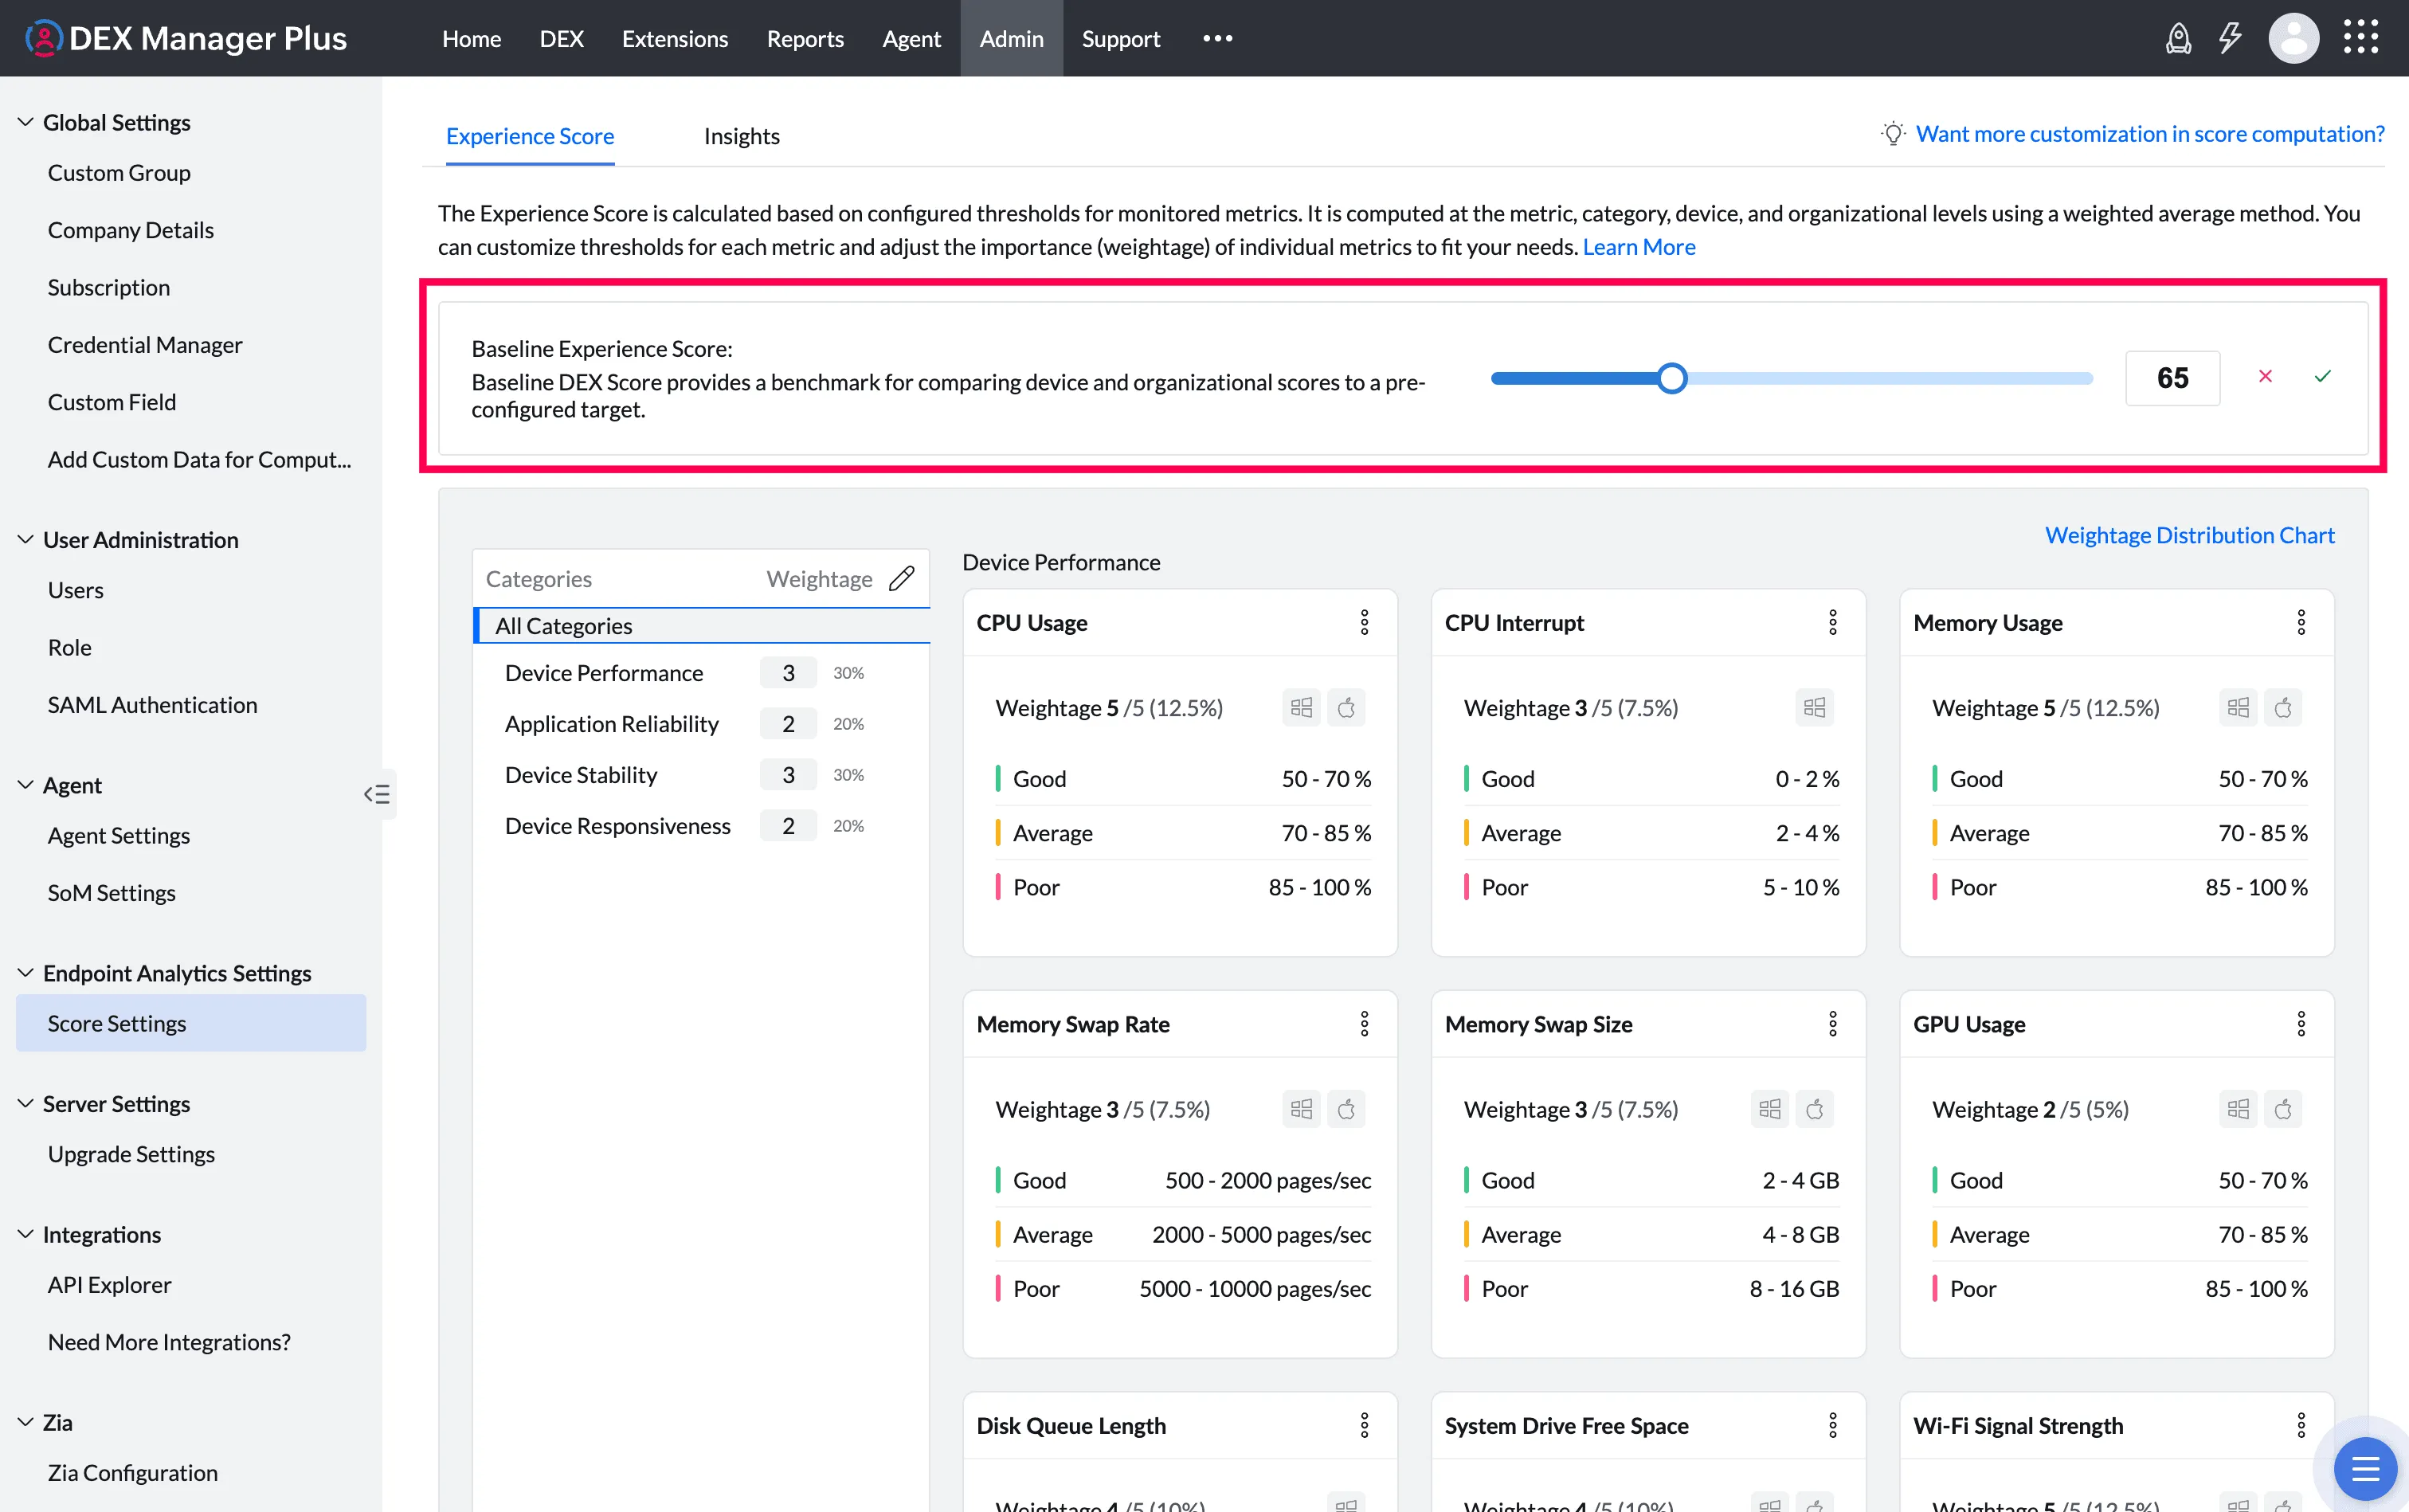
To set the baseline:
- In Score Settings, locate the Baseline Score field.
- Enter your target value.
- Click Save.
There is no system default. A common starting point is 75. Set this based on your SLAs or internal experience standards, and revisit it as your scoring model is refined.
6. Adding a Custom Category
You can add categories beyond the four predefined ones to extend the DEX Score to dimensions specific to your organization. There are two types of custom categories:
General Experience Category Used for any experience dimension you want to score using sensor field data, such as security posture, compliance status, or application-specific metrics. Metrics in a general experience category are sourced from sensor fields.
Sentiment Experience Category Used exclusively for capturing user feedback through Engage. When you enable the Sentiment Score Category toggle, only Engage stages from deployed workflows are available as metric sources for that category. Sensor-based metrics cannot be added to a sentiment experience category.
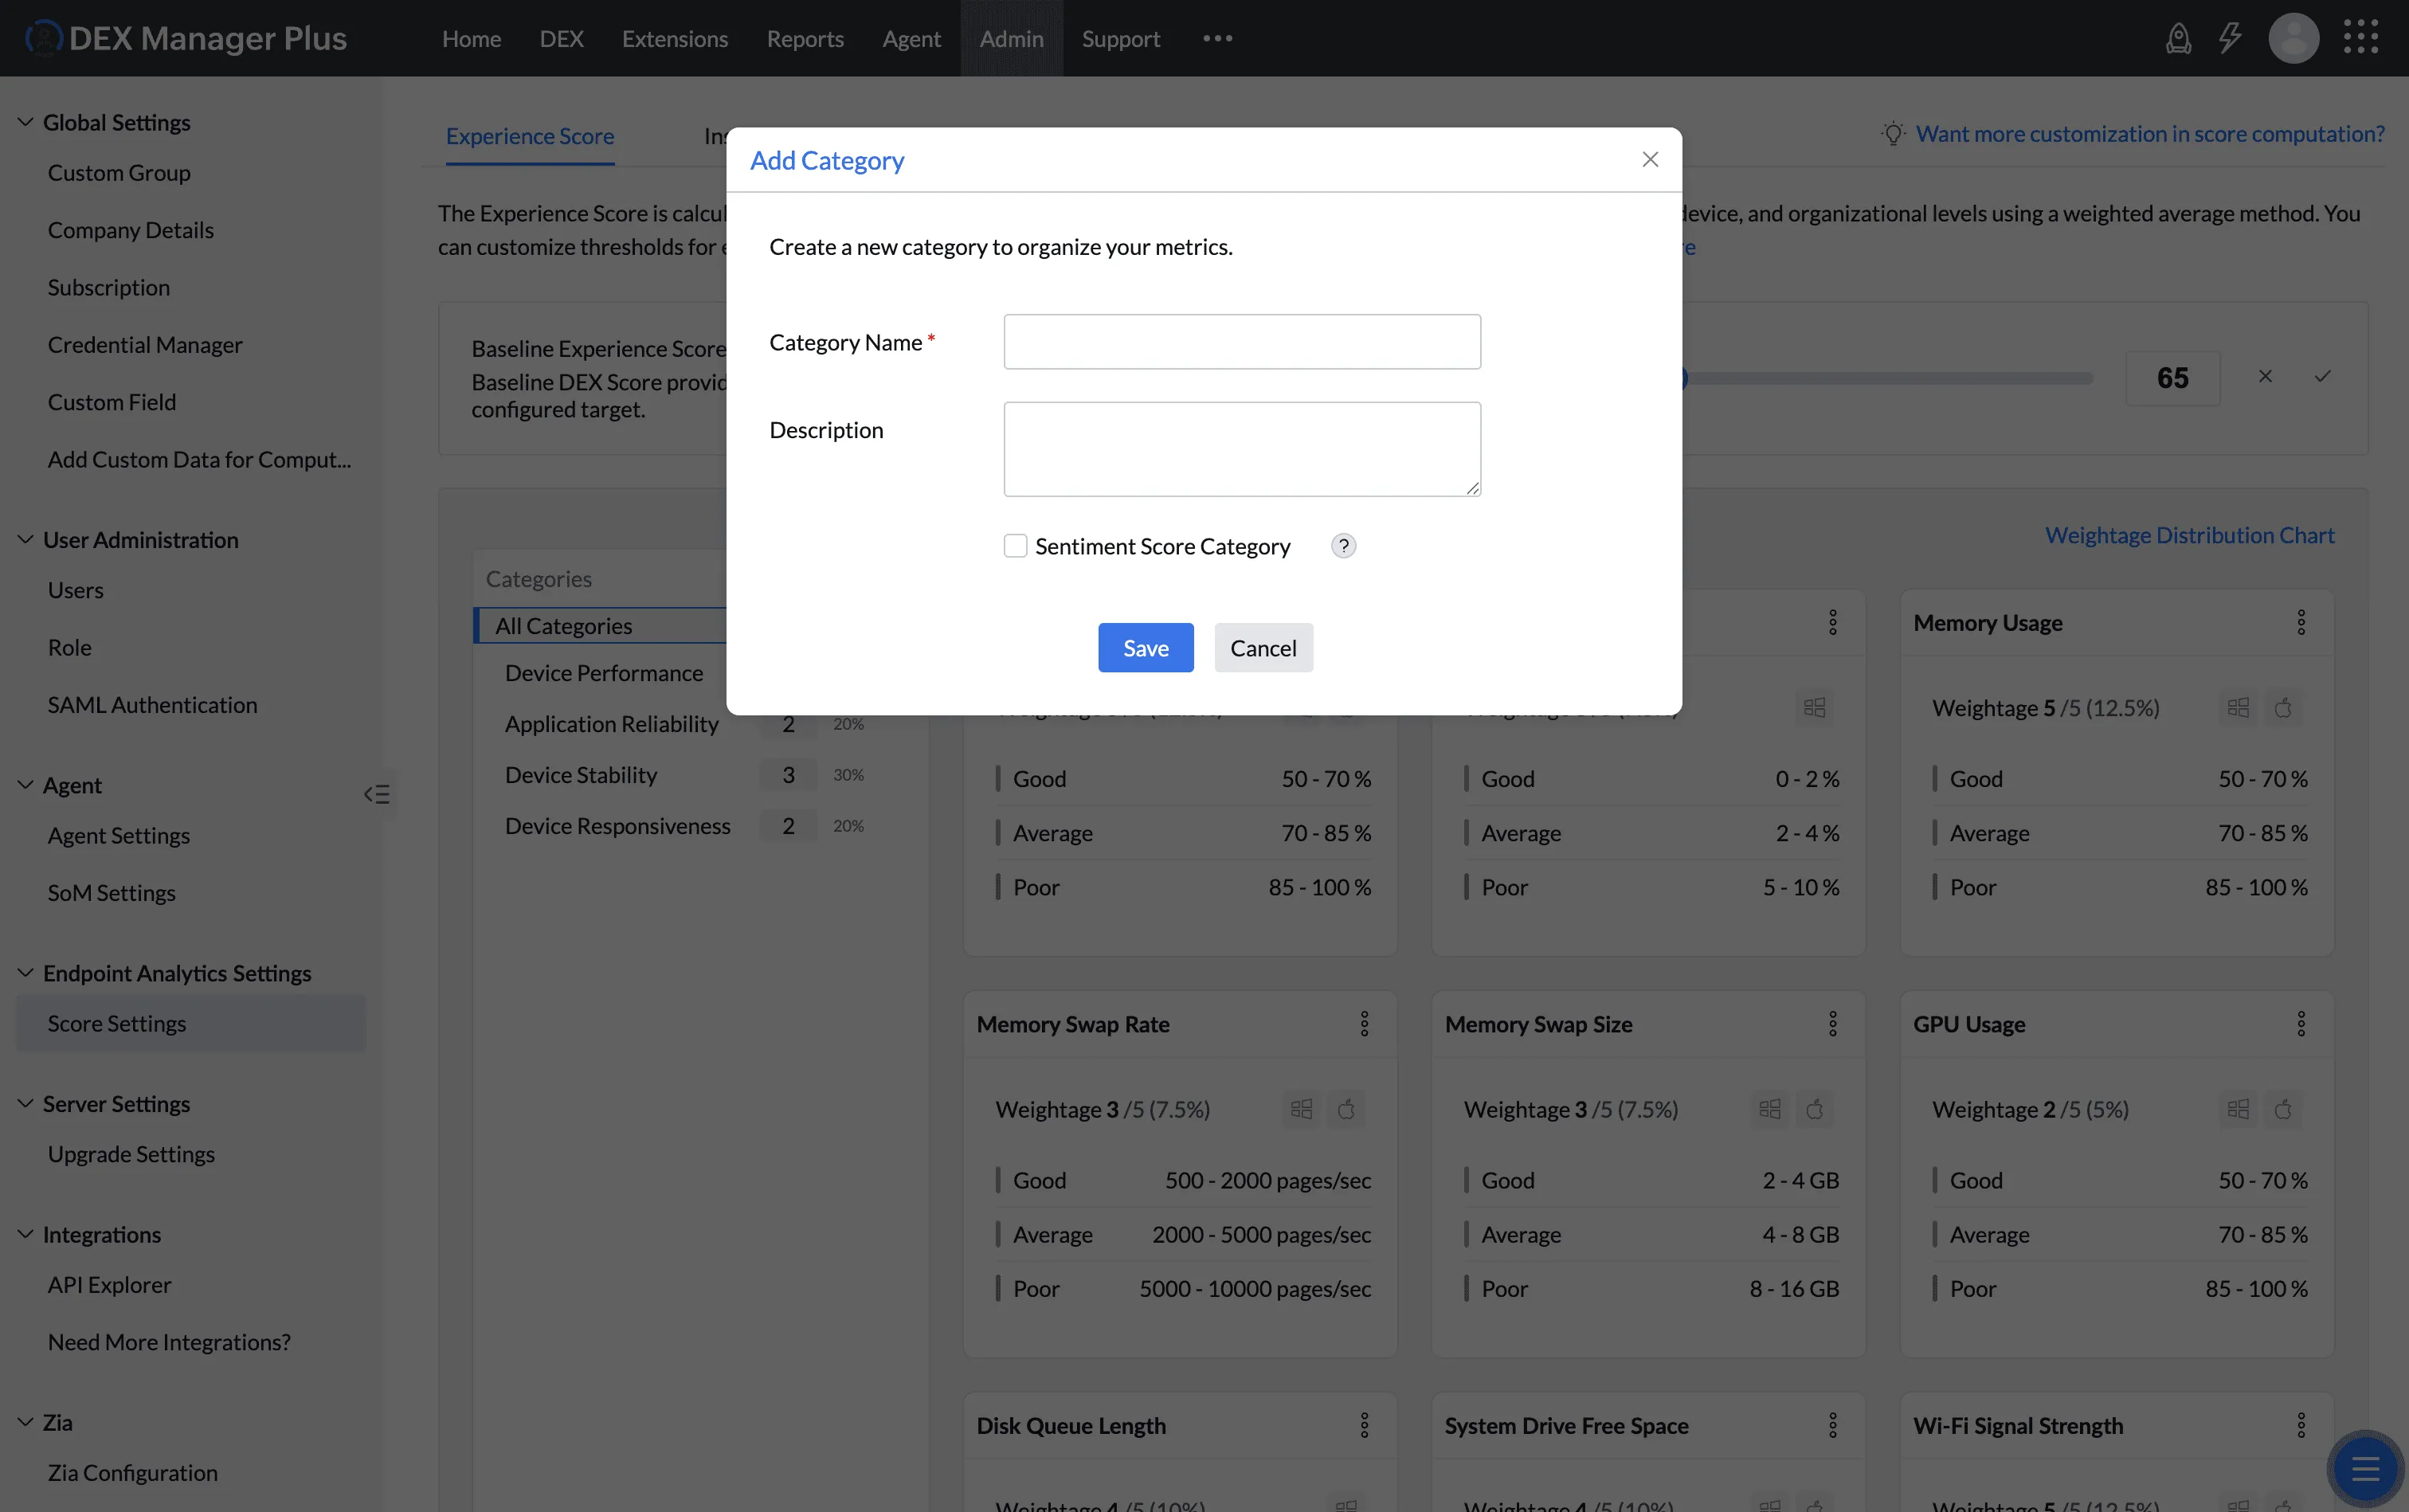
To add a custom category:
- In Score Settings, click Add Category.
- Enter a name and description for the category.
- To create a sentiment experience category, enable Sentiment Score Category. Leave this off for a general experience category.
- Click Save. You will be returned to the Score Settings page.
After creating the category, add metrics to it as described in the next section.
7. Adding a Custom Metric
You can add metrics to both predefined and custom categories using sensor fields. This extends the DEX Score to cover any device or application data your sensors collect.
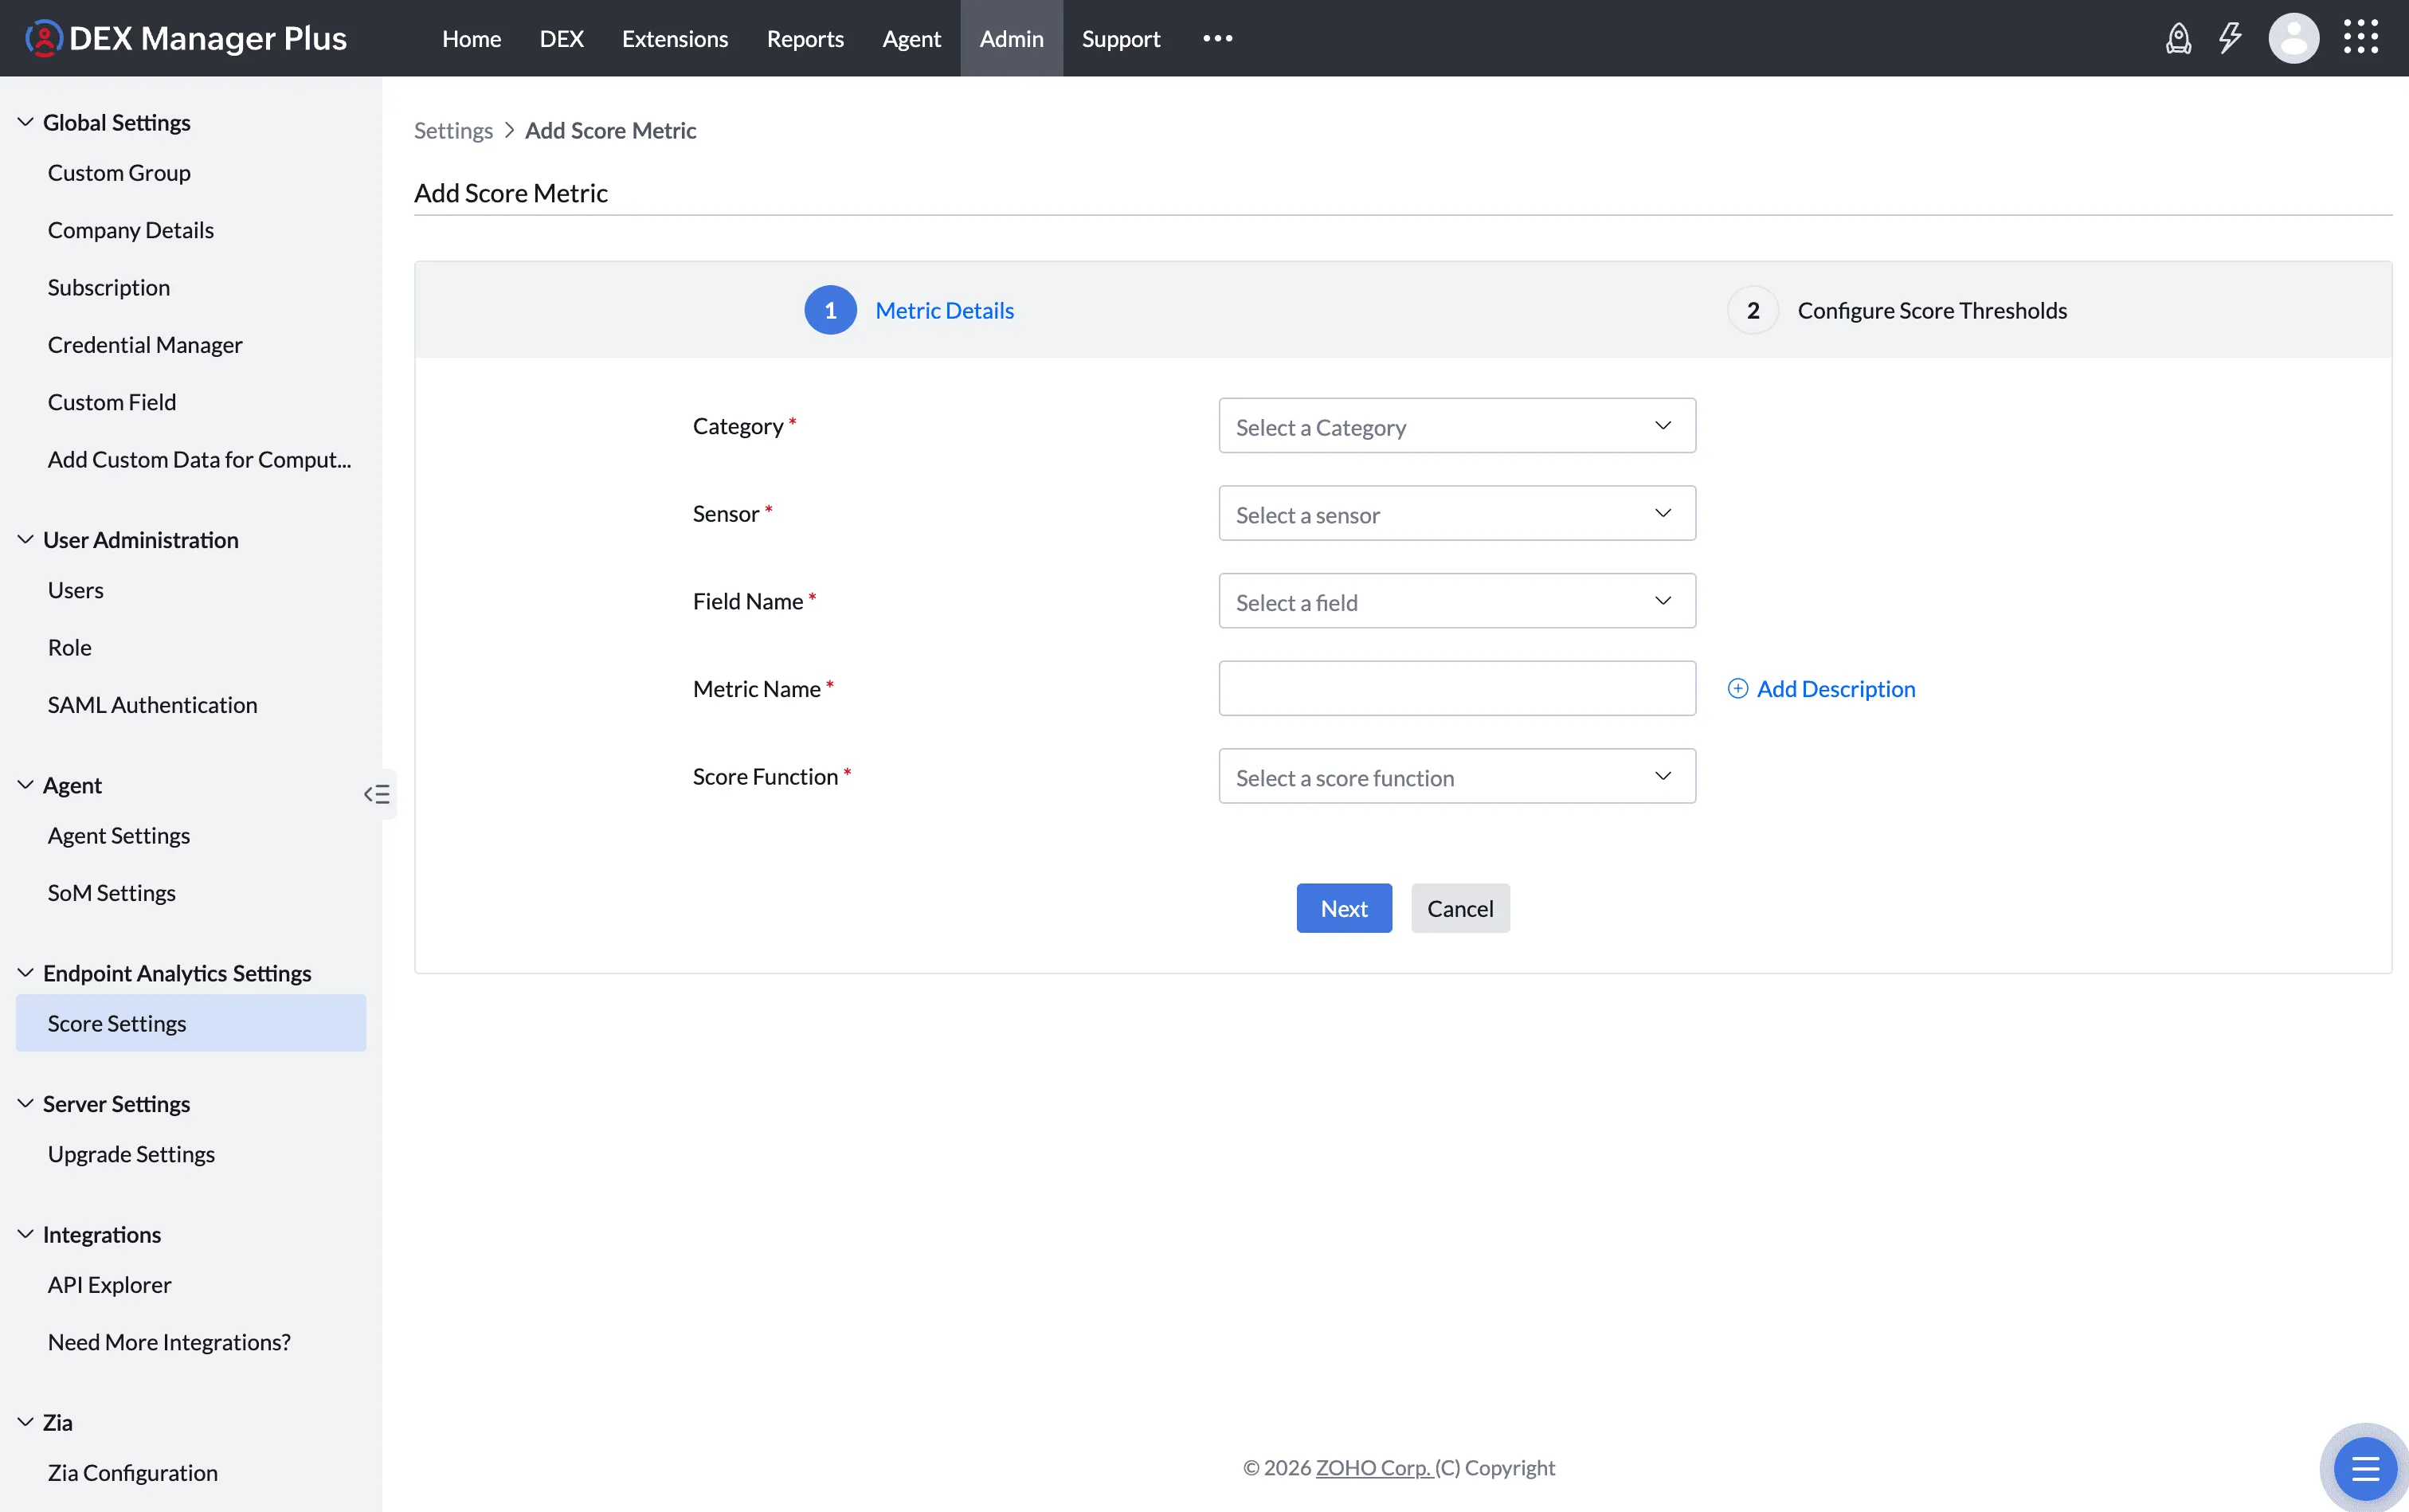
To add a custom metric:
- In Score Settings, click the three-dot menu at the end of the category you want to add a metric to.
- Select Add Score Metric.
- Select a Sensor. If the sensor you need does not exist yet, create one first by following the sensor configuration document.
- Select the Field Name from the available fields of that sensor. The metric name is filled in automatically.
- Select a Score Function based on the type of data this metric produces. This selection is permanent - the score function cannot be changed after the metric is saved. Only the threshold parameters can be updated later.
- Click Next.
- Configure the thresholds for the selected score function (see below).
- Click Add Score Metric to save.
You can adjust the weightage of custom metrics using the three-dot menu on the metric tile after it has been added.
Score Function: Linear Interpolation
Use this for numeric metrics where the score should change smoothly as the measured value moves through a range. You define two threshold points that divide the measurement range into Good, Average, and Poor zones. The score is interpolated linearly within each zone.
To configure:
- The slider displays the full measurement range for the metric (for example, 50 to 500 milliseconds for User Input Delay).
- Drag the left handle to set the boundary between Good and Average.
- Drag the right handle to set the boundary between Average and Poor.
- The table below the slider updates to show the resulting score range for each band:
- Good: score 71 to 100
- Average: score 31 to 70
- Poor: score 0 to 30
- Click Save.
Example: User Input Delay
| Performance | Threshold | Score |
|---|---|---|
| Good | Up to 100 milliseconds | 71 to 100 |
| Average | 100 to 300 milliseconds | 31 to 70 |
| Poor | Above 300 milliseconds | 0 to 30 |
A device with a 50ms delay scores 100. A device with a 200ms delay receives an interpolated score within the Average band. A device above 300ms falls into the Poor band.
Score Function: Range
Use this for numeric metrics where the score should jump to a fixed value when a measurement falls within a defined interval. Unlike Linear Interpolation, every value within a defined interval receives the same fixed score rather than one that changes gradually.
To configure:
- Each row defines a From value, a To value, and the Score assigned to any measurement in that interval.
- Use the + button to add rows and the - button to remove them.
- Values that fall outside all defined intervals receive a score of 0.
- Click Save.
Example: Warranty (remaining months)
| From | To | Score |
|---|---|---|
| 6 | 12 | 100 |
| 3 | 6 | 70 |
| 1 | 3 | 30 |
| 0 | 1 | 0 |
A device with 9 months of warranty remaining scores 100. A device with 2 months remaining scores 30.
Values outside the configured ranges default to a score of 0.
Score Function: Lookup
Use this for alphanumeric fields where specific text values map directly to specific scores. Each possible value the sensor field can return is listed alongside the score it should receive.
To configure:
- Each row defines a Metric Value (the exact text the field returns) and the Score assigned to it.
- Use the + button to add rows and the - button to remove them.
- Enter every possible value the field can return and assign a score from 0 to 100.
- Any value not listed in the table defaults to a score of 0.
- Click Save.
Example: Antivirus Enabled (sensor field)
| Metric Value | Score |
|---|---|
| Yes | 100 |
| No | 0 |
Values other than the ones listed default to a score of 0.
Lookup is also the score function used when configuring Engage-based metrics in a sentiment experience category. Survey response options are mapped to scores using the same interface.
8. User Sentiment Score
User sentiment scoring lets you include direct employee feedback as a component of the DEX Score. While technical metrics can identify that a device has high CPU usage or a slow boot time, they don't capture how the employee actually feels about their day-to-day experience. Sentiment scores fill that gap.
A sentiment experience category is distinct from general experience categories: it can only contain metrics sourced from Engage stages in deployed workflows. Standard sensor fields cannot be added to it. When an employee responds to a survey, their answer is mapped to a score using the Lookup function, and that score contributes to the device's overall DEX Score.
How It Works
- You create a sentiment experience category with the Sentiment Score Category toggle enabled.
- A workflow with Engage stages is deployed to devices on a recurring schedule.
- When an employee responds, their answer is recorded against the device.
- The Lookup configuration maps each possible response to a score between 0 and 100.
- The most recent response per device is used in the next scoring cycle. If no response is available, the metric is excluded and shown as "--".
Prerequisites
- A workflow containing one or more Engage stages must be created and deployed to the target devices before adding a sentiment metric.
- The workflow must run on a recurring schedule. A weekly cadence is recommended to avoid survey fatigue.
Setup
Step 1: Create a sentiment experience category
- In Score Settings, click Add Category.
- Enter a name (for example, "User Sentiment") and an optional description.
- Enable Sentiment Score Category.
- Click Save.
Step 2: Add a sentiment metric
- In the newly created category, click the three-dot menu and select Add Score Metric.
- For the sensor, select Engage. Only Engage stages from already-deployed workflows appear here.
- Select the Engage stage you want to use as the data source.
- The metric name is filled in automatically.
- Select Lookup as the score function and click Next.
- Under Configure Score Thresholds, add a row for each possible survey response and assign it a score:
- Positive or satisfied responses should map to higher scores (closer to 100).
- Negative or dissatisfied responses should map to lower scores (closer to 0).
- Click Add Score Metric to save.
Where Sentiment Scores Appear
- Dashboard: As part of the device and organization DEX Score breakdown by category.
- Device View: The sentiment experience category score appears alongside technical categories on the device detail page.
- Reports: The sentiment score field is available in custom reports.
Notes
- Only the most recent response per device is used. If no response has been collected in the current period, the metric is excluded from that device's score.
- Engage stages from workflows that have not yet been deployed will not appear in the sensor selection list.
- You can add multiple Engage-based metrics to a single sentiment experience category if your workflow has more than one survey stage.
Best Practices
| Practice | Why It Matters |
|---|---|
| Use a weekly survey schedule | More frequent surveys reduce response rates and cause fatigue |
| Keep questions focused on specific experience pain points | Vague questions produce less actionable score data |
| Combine sentiment with technical metrics | Sentiment signals where to look; technical data explains why |
| Assign a moderate weightage to the sentiment experience category | Sentiment data is intermittent; weighting it too heavily can skew the overall score when responses are sparse |
Visualizing Weightage Distribution
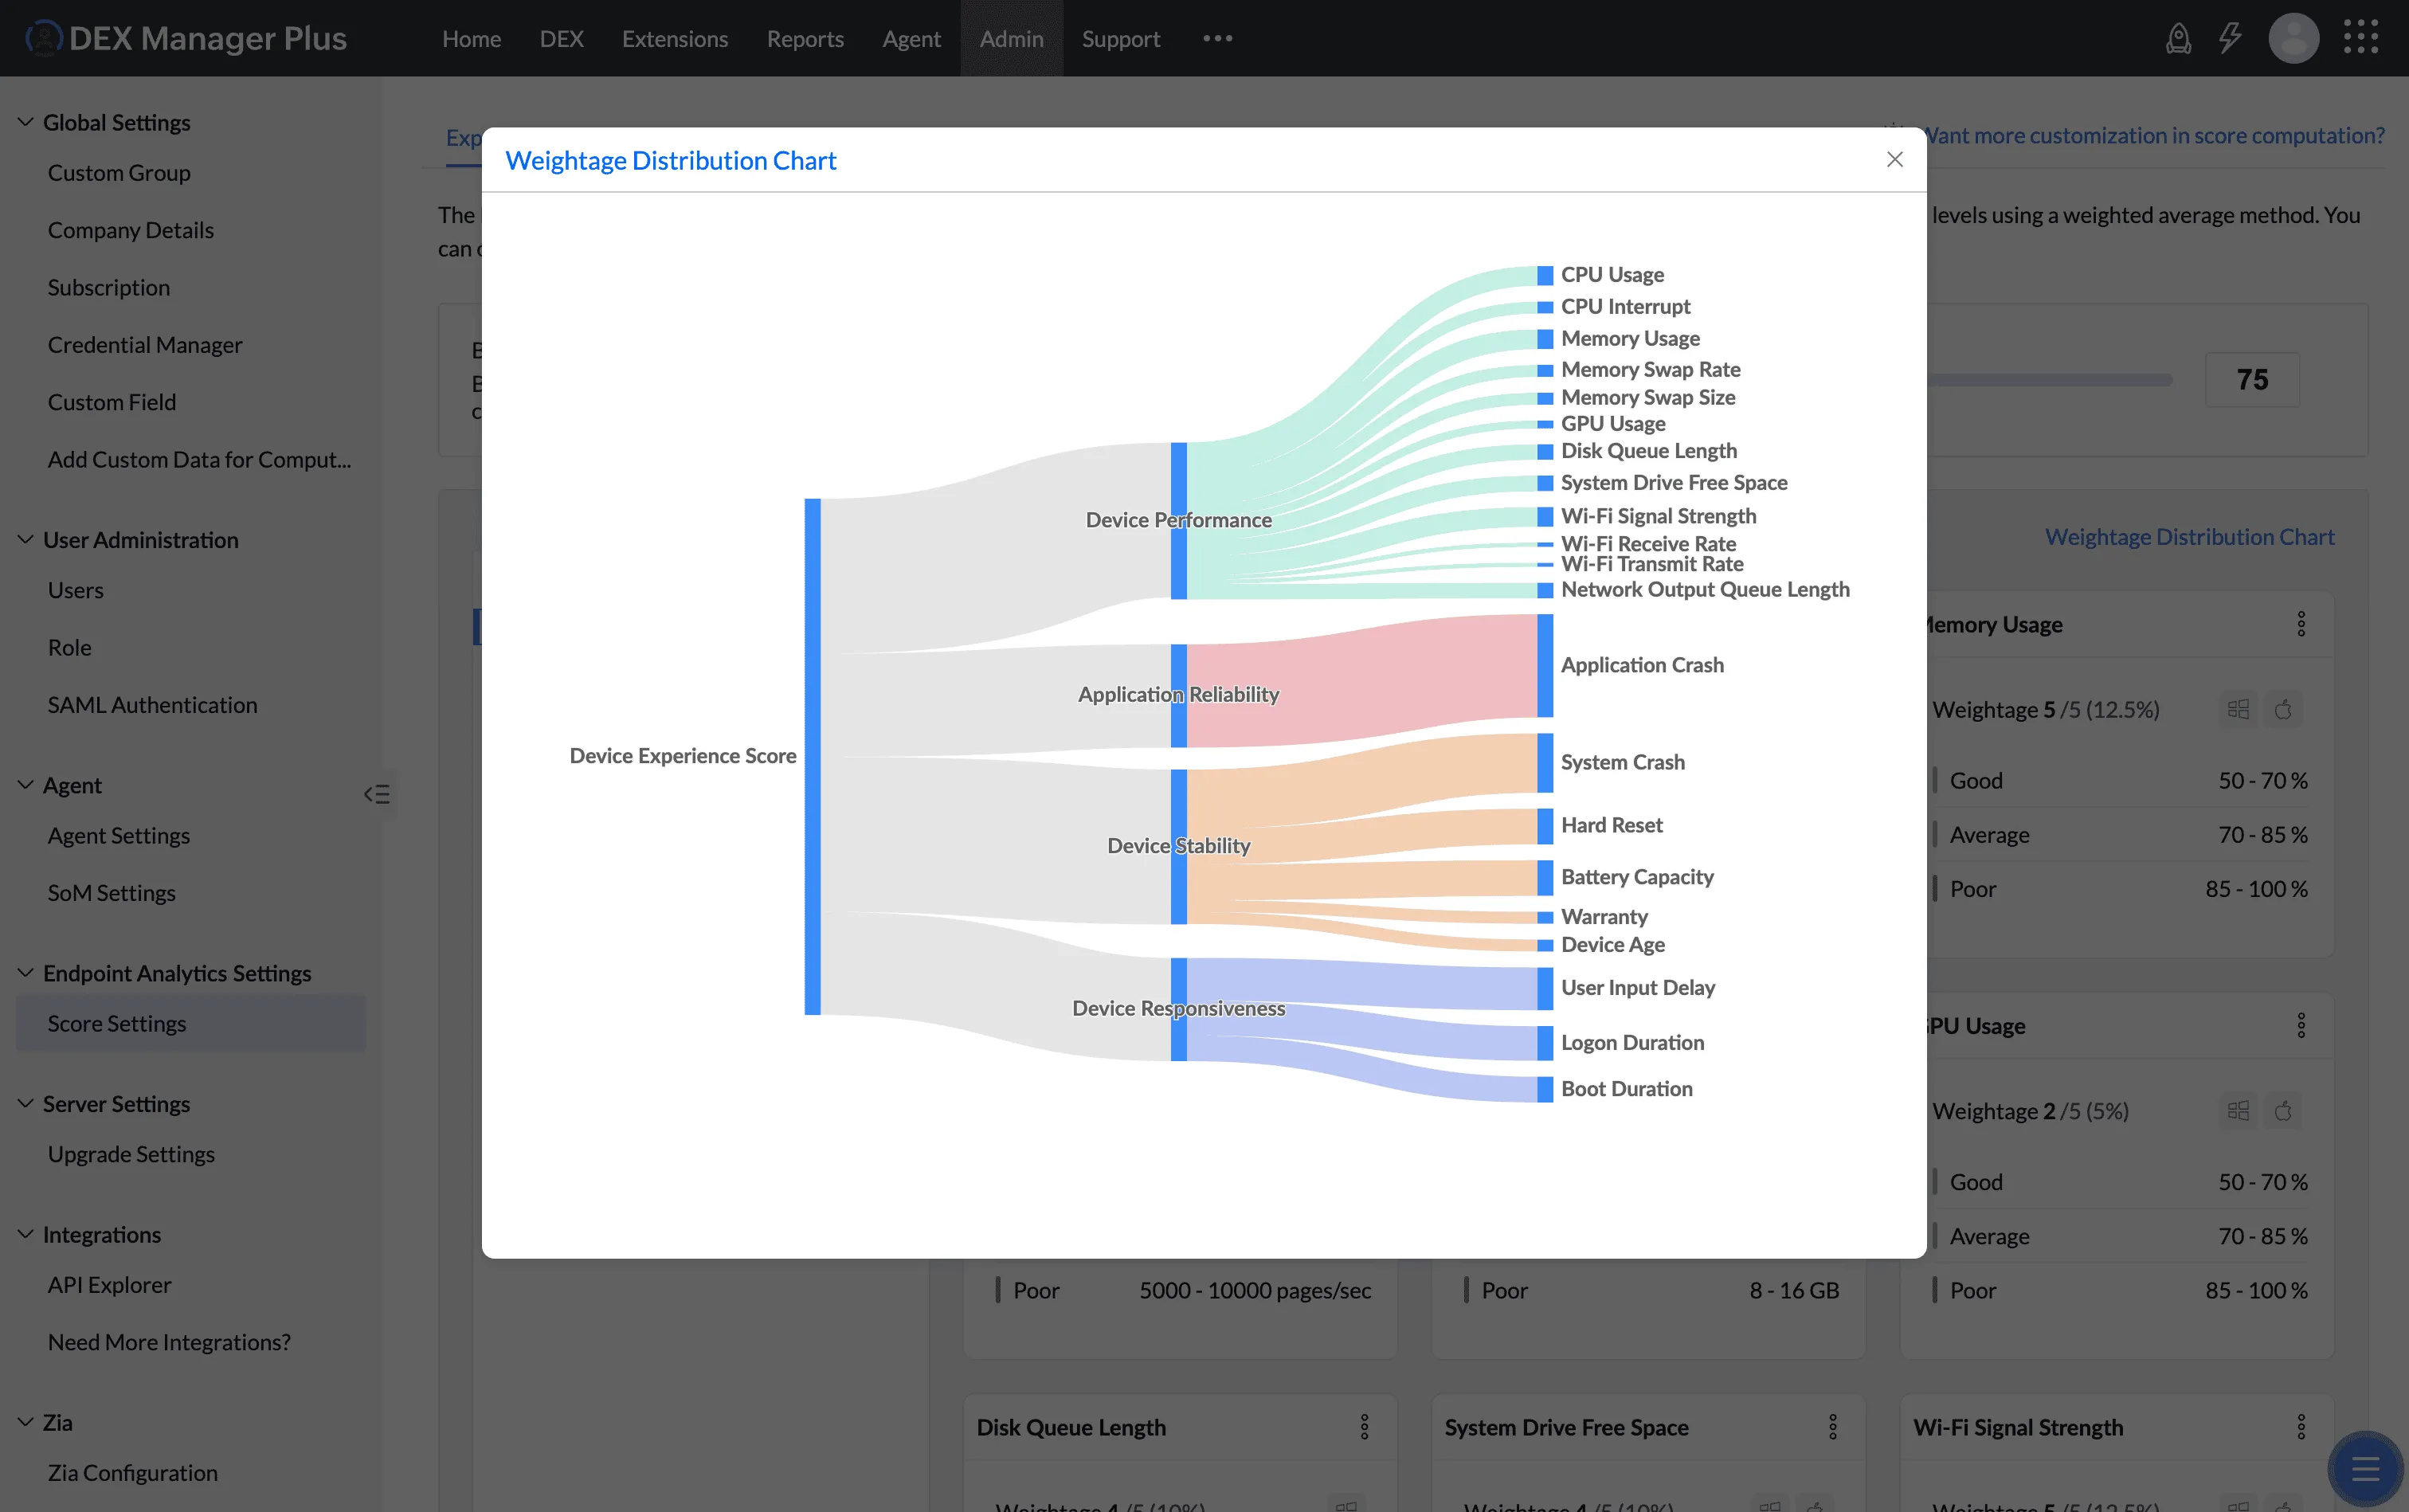
The Weightage Distribution Chart in Score Settings shows a visual breakdown of how each category and metric contributes to the overall DEX Score. Use this to verify that the weighting reflects your priorities before saving changes.
Best Practices
| Practice | Why It Helps |
|---|---|
| Assign higher weightage to categories that affect your users most | Keeps the score aligned with real-world priorities rather than equal-weight averages |
| Disable metrics with little relevance during initial rollout | Reduces noise and makes insights easier to interpret early on |
| Set a baseline score before sharing dashboards with stakeholders | Ensures flagging thresholds are meaningful from day one |
| Review score settings every quarter | Adapts the scoring model as your infrastructure, workforce, or business priorities change |
| Test threshold changes on a small device group first | Let's you validate the impact before applying changes organization-wide |