Switch stack monitoring in OpManager
A switch stack is a method of grouping or bridging several switches in a way that they act as one single switch, with the aim of delivering maximum scalability and performance. This manner of stacking is generally regarded as the most effective way of scaling up the capacity of a network.
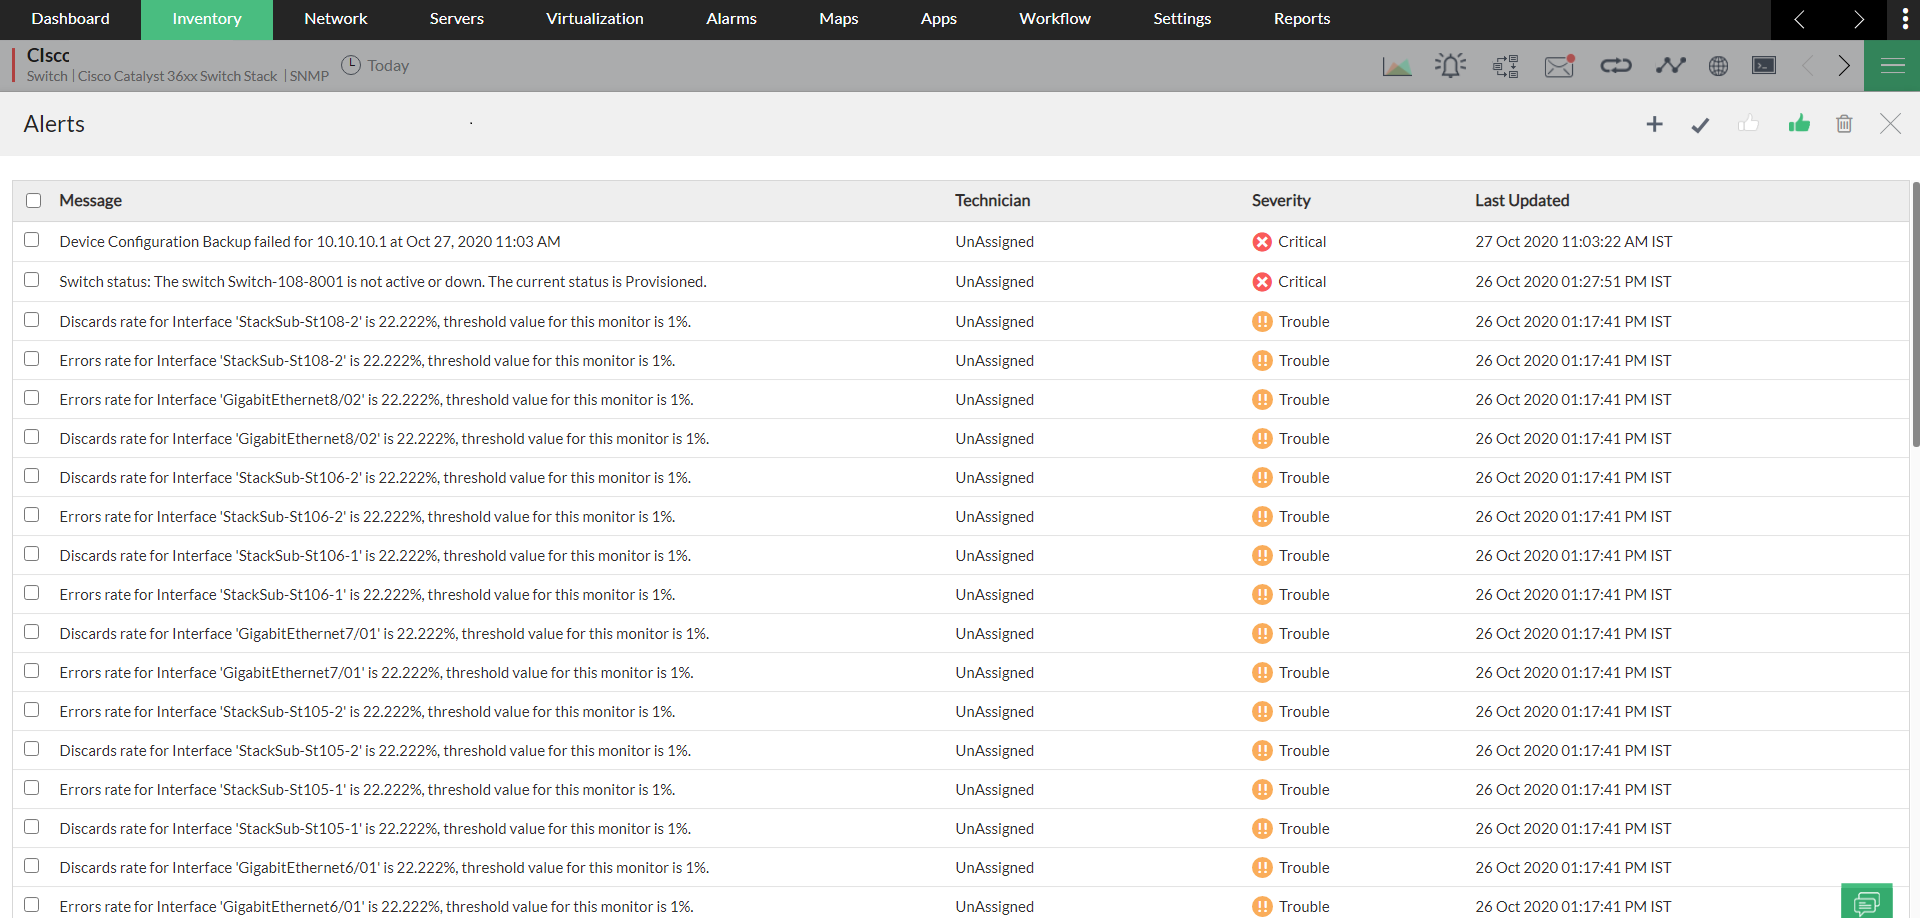
OpManager's Switch stack monitoring feature helps you discover and monitor your switch stacks for their health and optimum performance and receive alarms. This helps you initiate corrective actions at the earliest, enabling faster troubleshooting.
- Adding a switch stack in OpManager
- Supported models
- Various states of a switch stack in OpManager
- How to suppress switch stack alarms?
- Frequently Asked Questions
Adding a switch stack in OpManager
You can discover stack switches via Add Device or Network Discovery page just like every other device. Click here to learn more about device discovery in OpManager.
Once the switch stack is discovered by using the management IP, OpManager starts monitoring it using SNMP protocol. Furthermore, the switch stacks will be polled at regular intervals to know if there has been any changes made.
Supported Models
| Vendor Name | Switch Stack Type | Supported Models | SYSOID Details | Supported MIB |
|---|---|---|---|---|
| Cisco | StackWise | Cisco Catalyst 37xx Switch Stack | .1.3.6.1.4.1.9.1.516 | CISCO-STACKWISE-MIB |
| Cisco Catalyst 29xx Switch Stack | .1.3.6.1.4.1.9.1.1208 | |||
| Cisco Catalyst 9200L Fixed Switch Stack | .1.3.6.1.4.1.9.1.2694 | |||
| Cisco Catalyst 9200R Switch Stack | .1.3.6.1.4.1.9.1.2695 | |||
| Cisco Catalyst 9300L Switch Stack | .1.3.6.1.4.1.9.1.2804 | |||
| Cisco Catalyst 36xx Switch Stack | .1.3.6.1.4.1.9.1.2066 | |||
| Cisco Catalyst 38xx Switch Stack | .1.3.6.1.4.1.9.1.1745 | |||
| Cisco Catalyst 93xx Switch Stack | .1.3.6.1.4.1.9.1.2494 | |||
| Cisco Catalyst 35xx Switch Stack | .1.3.6.1.4.1.9.1.2277 | |||
| Cisco 9500 Fixed Switch Stack | .1.3.6.1.4.1.9.1.2593 | |||
| Cisco | Virtual Switching System (VSS) | Cisco Catalyst 45xx VSS | .1.3.6.1.4.1.9.1.1732 | CISCO-VIRTUAL-SWITCH-MIB |
| Cisco Catalyst 65xx VirtualSwitch | .1.3.6.1.4.1.9.1.896 | |||
| Cisco | StackWise Virtual | Cisco Catalyst 9500 Virtual Stack | .1.3.6.1.4.1.9.1.2688 | CISCO-STACKWISE-MIB |
| HPE Aruba | Aruba VSF (Virtual Switching Framework) | Hewlett-Packard 3800 48G-PoE+-4SFP+ (J9574A) | .1.3.6.1.4.1.11.2.3.7.8.5.2 | HP-STACK-MIB |
| HP Aruba2920-48G-POE+ | .1.3.6.1.4.1.11.2.3.7.8.5.3 | |||
| HP Aruba3810M | .1.3.6.1.4.1.11.2.3.7.8.5.4 | |||
| HP ARUBA 2930F 24G 4SFP (L253A) | .1.3.6.1.4.1.11.2.3.7.8.5.5 | |||
| HP Aruba5400R | .1.3.6.1.4.1.11.2.3.7.8.5.6 | |||
| HP Aruba 2930M Switch Stack | .1.3.6.1.4.1.11.2.3.7.8.5.7 | |||
| Huawei | iStack | Huawei S5720 52X PWR SI AC | .1.3.6.1.4.1.2011.2.23.335 | HUAWEI-STACK-MIB |
| Huawei Switch Stack supported with HUAWEI-STACK-MIB | .1.3.6.1.4.1.2011.2.23.* | |||
| Juniper | Virtual Chassis (VC) | Juniper EX3200 Series | .1.3.6.1.4.1.2636.1.1.1.4.30.* | JUNIPER-VIRTUALCHASSIS-MIB / JUNIPER-CHASSIS-DEFINES-MIB |
| Juniper EX4200 Series | .1.3.6.1.4.1.2636.1.1.1.4.31.* | |||
| Juniper EX2200 Series | .1.3.6.1.4.1.2636.1.1.1.4.43.* | |||
| Juniper EX4400 Series | .1.3.6.1.4.1.2636.1.1.1.4.44.* | |||
| Juniper EX4300 Series | .1.3.6.1.4.1.2636.1.1.1.4.63.* | |||
| Juniper EX4550 Series | .1.3.6.1.4.1.2636.1.1.1.4.92.* | |||
| Juniper VCC | .1.3.6.1.4.1.2636.1.1.1.4.* | |||
| Juniper EX4300 VCC | .1.3.6.1.4.1.2636.1.1.1.2.63 | |||
| SRX 4200 48P | .1.3.6.1.4.1.2636.1.1.1.2.143 | |||
| Extreme Networks | SummitStack | Extreme EXOS Switch Stack supported with EXTREME-STACKING-MIB | .1.3.6.1.4.1.1916.* | EXTREME-STACKING-MIB |
| HPE - H3C | Intelligent Resilient Framework (IRF) | HPE FlexFabric 5700 Switch Series - JG896A | .1.3.6.1.4.1.25506.11.1.172 | HH3C-STACK-MIB |
| HPE H3C Comware Switch supported with HH3C-STACK-MIB | .1.3.6.1.4.1.25506.11.1.* | |||
| Allied Telesis | Virtual Chassis Stacking (VCStack) | Allied Telesis AT SBX8112 | .1.3.6.1.4.1.207.1.14.86 | AT-VCSTACK-MIB |
| Allied Telesis AT SBx81CFC400 | .1.3.6.1.4.1.207.1.4.87 | |||
| Allied Telesis AT SBx81CFC960 | .1.3.6.1.4.1.207.1.4.88 | |||
| Allied Telesis AT GS970M28PS | .1.3.6.1.4.1.207.1.4.312 | |||
| Allied Telesis AT GS970M Series | .1.3.6.1.4.1.207.1.4.313 | |||
| Allied Telesis AT GS970M Series | .1.3.6.1.4.1.207.1.4.314 | |||
| Allied Telesis AT GS970M Series | .1.3.6.1.4.1.207.1.4.315 | |||
| Allied Telesis AT GS970M Series | .1.3.6.1.4.1.207.1.4.316 | |||
| Allied Telesis AT SBx908GEN2 | .1.3.6.1.4.1.207.1.14.137 | |||
| Allied Telesis AT GS980MX Series | .1.3.6.1.4.1.207.1.14.154 | |||
| Allied Telesis AT GS980MX Series | .1.3.6.1.4.1.207.1.14.155 | |||
| Allied Telesis AT GS980MX Series | .1.3.6.1.4.1.207.1.14.156 | |||
| Allied Telesis AT GS980MX Series | .1.3.6.1.4.1.207.1.14.157 | |||
| Allied Telesis AT x950 Series | .1.3.6.1.4.1.207.1.14.150 | |||
| Allied Telesis AT x950 Series | .1.3.6.1.4.1.207.1.14.151 | |||
| Allied Telesis AT x950 Series | .1.3.6.1.4.1.207.1.14.165 | |||
| Hewlett-Packard(HPE) | SWITCHSTACK (HPE Aruba AOS-CX VSF Stack) | HPE Aruba CX 6200 Series | .1.3.6.1.4.1.47196.4.1.1.1.(300–332,341–345) | ARUBAWIRED-VSFv2-MIB |
| HPE Aruba 6300M Series JL658A (Aruba CX 6300M Series) | .1.3.6.1.4.1.47196.4.1.1.1.100 | |||
| HPE Aruba 6300M Series JL659A (Aruba CX 6300M Series) | .1.3.6.1.4.1.47196.4.1.1.1.101 | |||
| HPE Aruba 8360-48Y6C JL719C (Aruba CX 8360 v2 Switch Series) | .1.3.6.1.4.1.47196.4.1.1.1.422 | |||
| HPE Aruba CX Switch Stack supported with ARUBAWIRED-VSFv2-MIB | 1.3.6.1.4.1.47196.4.1.1.1.* |
Note: Switches other than the ones mentioned above, will be discovered and classified as a normal switch for switch monitoring. Apart from the above-mentioned switches, users can also customize their supported models by providing the SysOID and the device type of their preferred stack switch.
Various states of a switch stack in OpManager
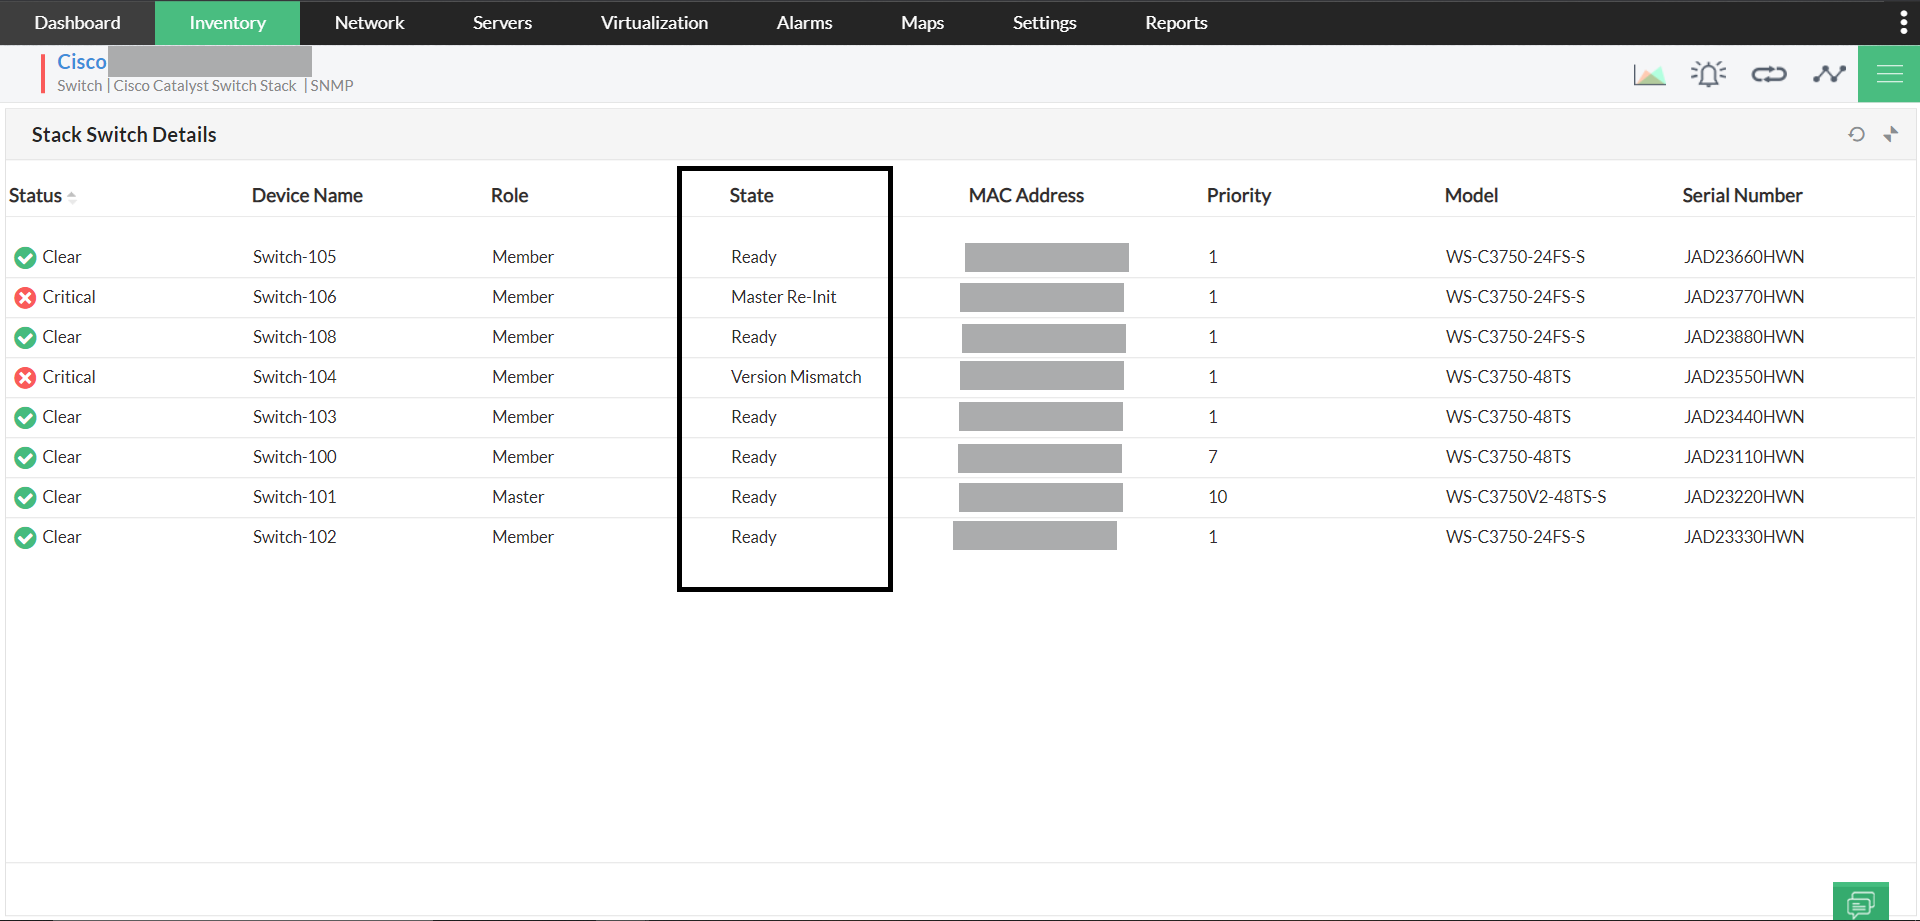
Listed below are the various member states displayed in OpManager. This can be viewed under the Stack switch details widget in the stack switch snapshot page.
| State | Description |
| Waiting | Waiting for a limited time on other switches in the stack to come online |
| Progressing | Master election or mismatch checks in progress |
| Added | The switch is added to the stack |
| Ready | The switch is operational |
| Removed | The switch is removed from the stack |
| Provisioned | The switch is not an active member of the stack. |
| Invalid | The switch's state machine is in invalid state. |
| SDM Mismatch | The SDM template configured on the master is not supported by the new member |
| Version Mismatch | The OS version running on the master is different from the on this member |
| Feature Mismatch | Some of the features configured on the master are not supported by this member |
| Master Re-Init | Waiting for the new master to finish initialization after master switchover |
Switch Stack Alarm Suppression
- If a switch role changes to Standby, an alert with Critical severity is raised. This will now be raised with Clear severity. The severity level can be customized using the following custom parameter:
SWITCHSTACK_STANDBYROLE_SEV Clear- Possible values:
Attention|Critical|Trouble|Clear
- By default, alerts for switch role changes (except when a new master is selected) will be suppressed.
- If alerts are required for other role changes, they can be enabled using the following custom parameter:
STACKROLE_SUPPRESS_ALARM false- Setting this to
falsewill generate an alert based on severity whenever a switch role changes.
Note: OpManager should be restarted for the changes to take effect.

