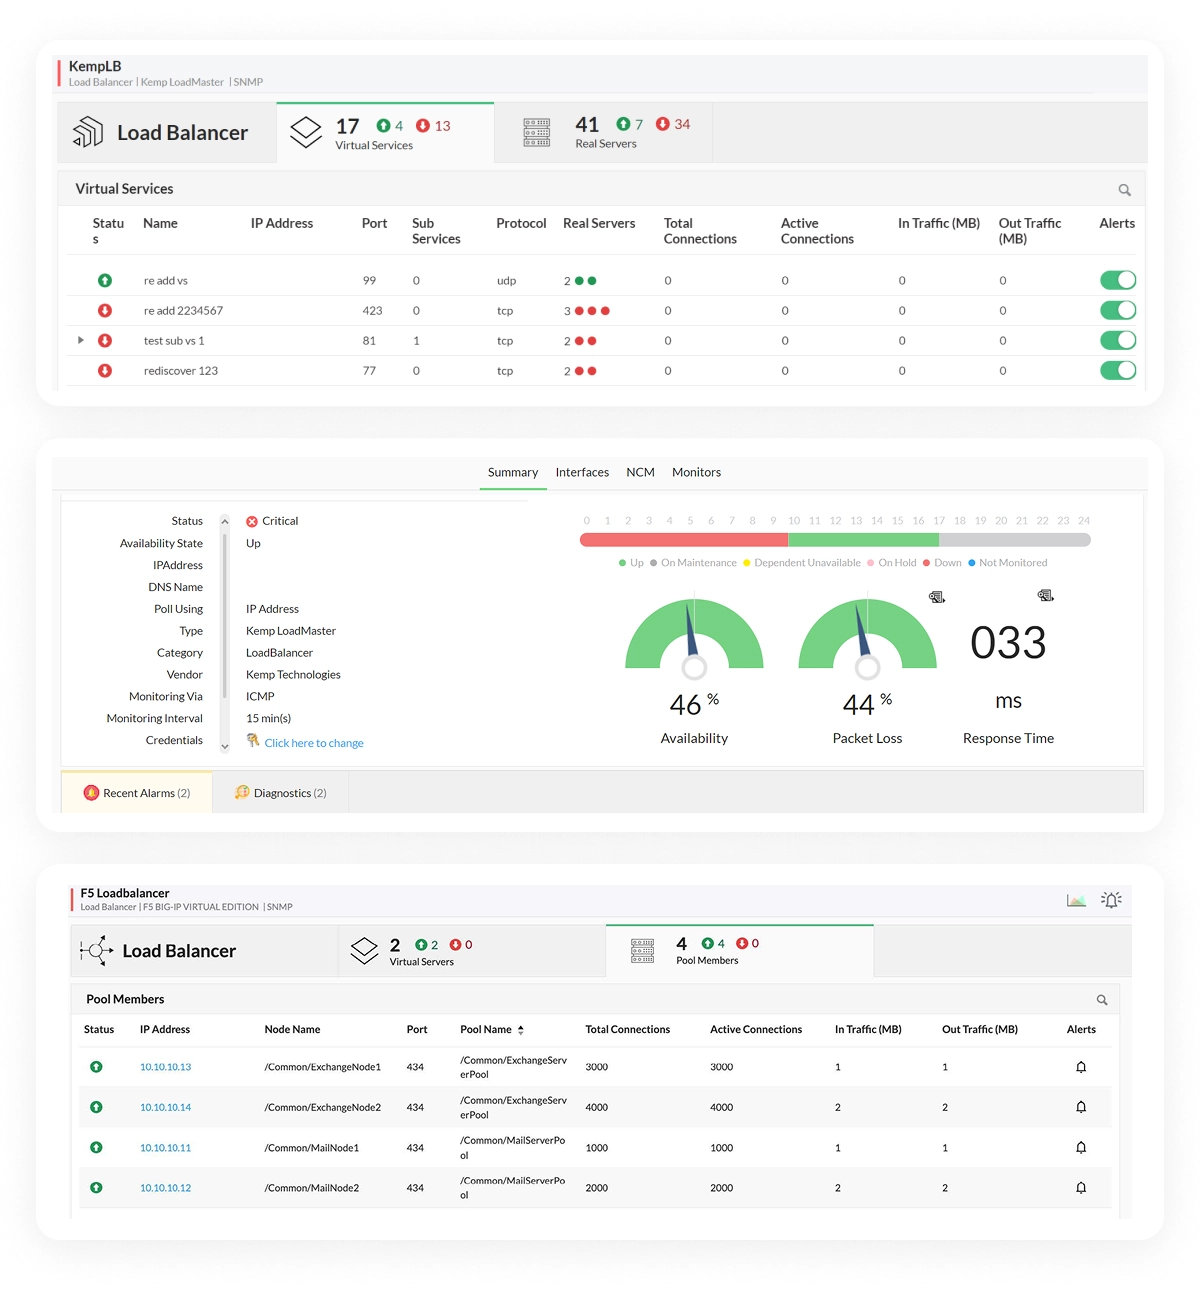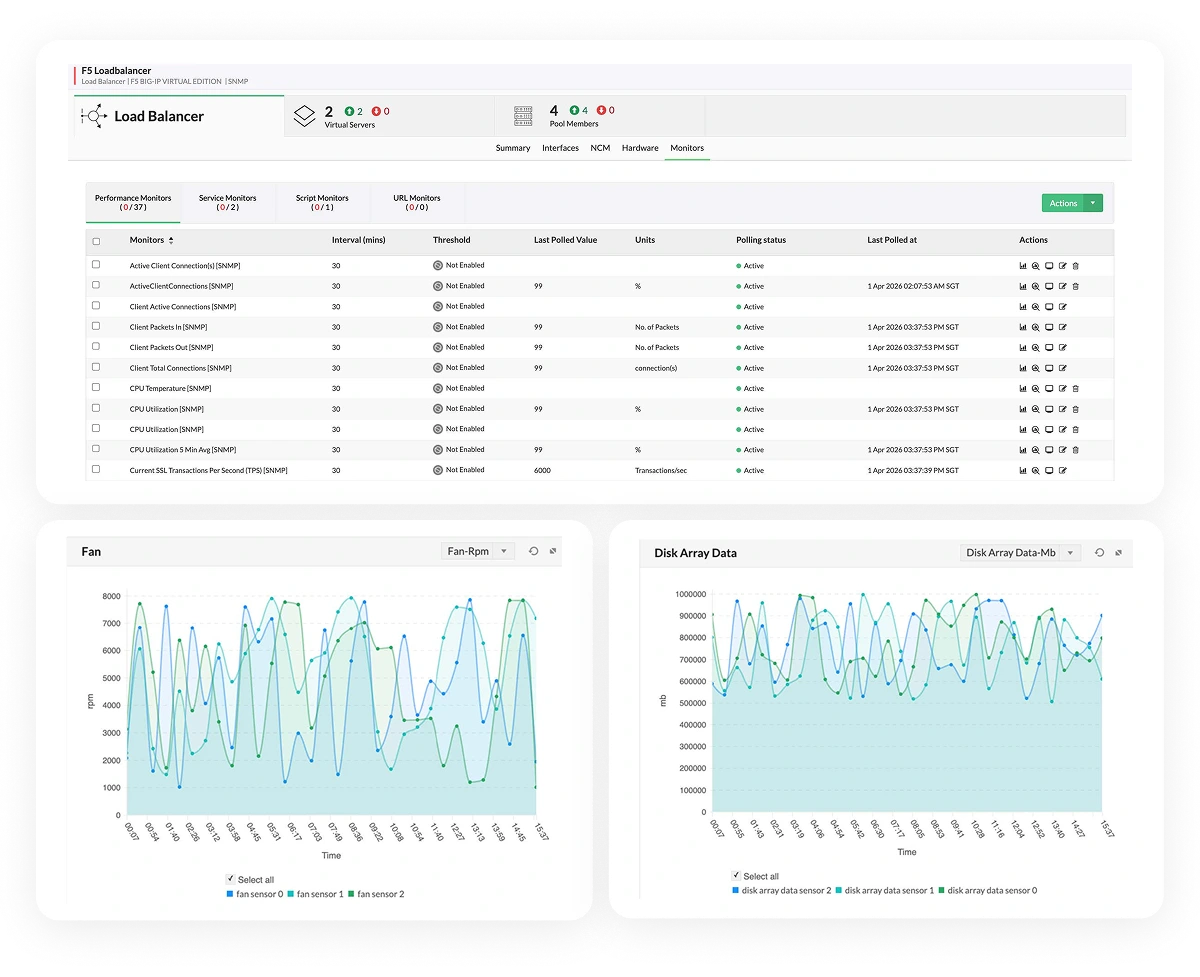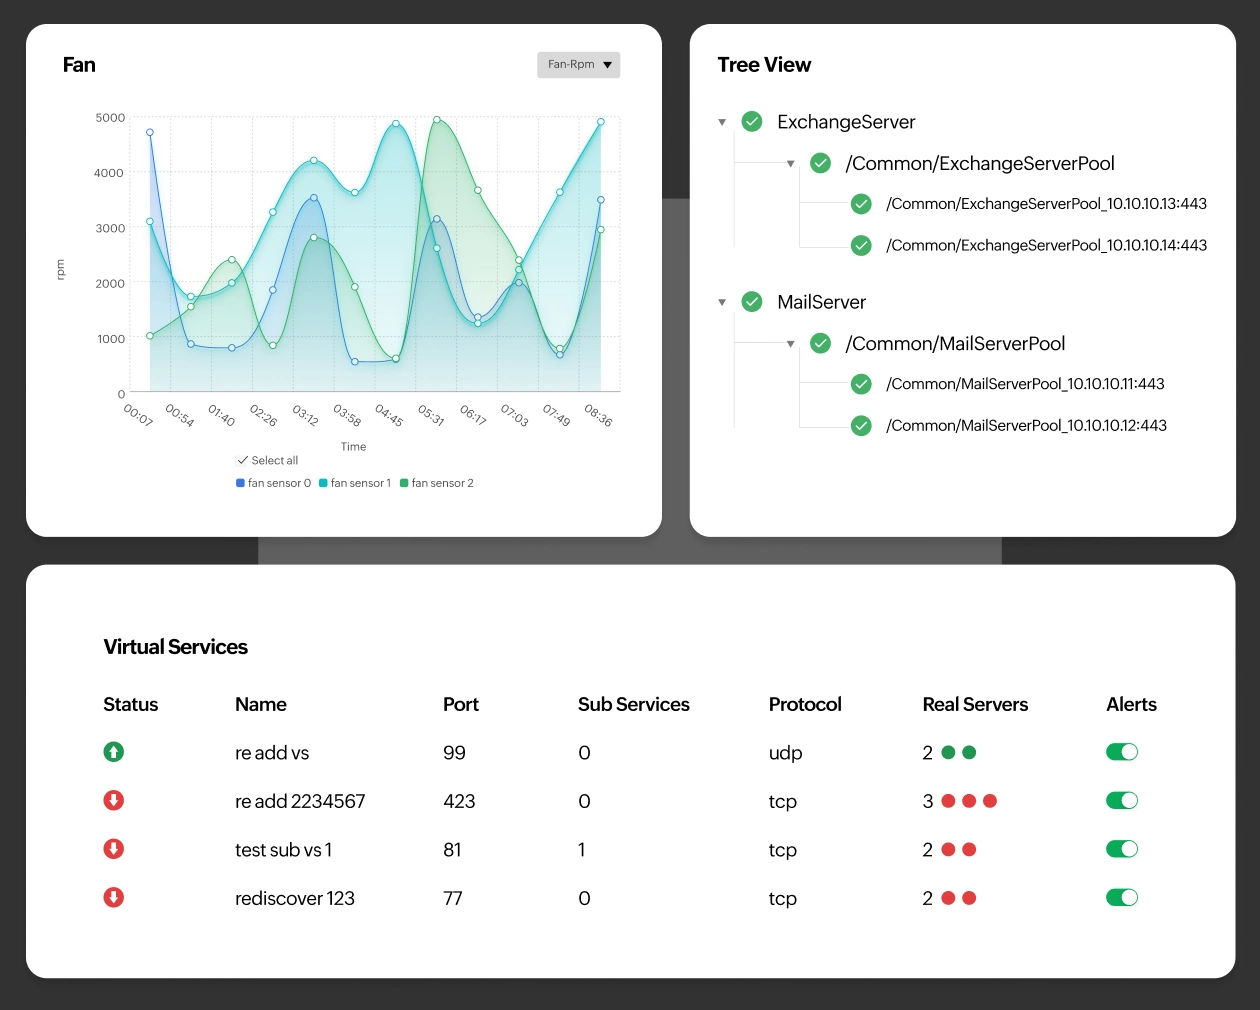
Monitor real service health, not just device uptime
Catch failures before your users do:
OpManager monitors the specific services behind your load balancer (like TCP ports, HTTP URLs, and FTP services), not just the device itself. If the web server is running but the application pool is down, you get alerted immediately saving your helpdesk from the flood of "Is the site down?" calls.
Eliminate the "It works for me" chaos:
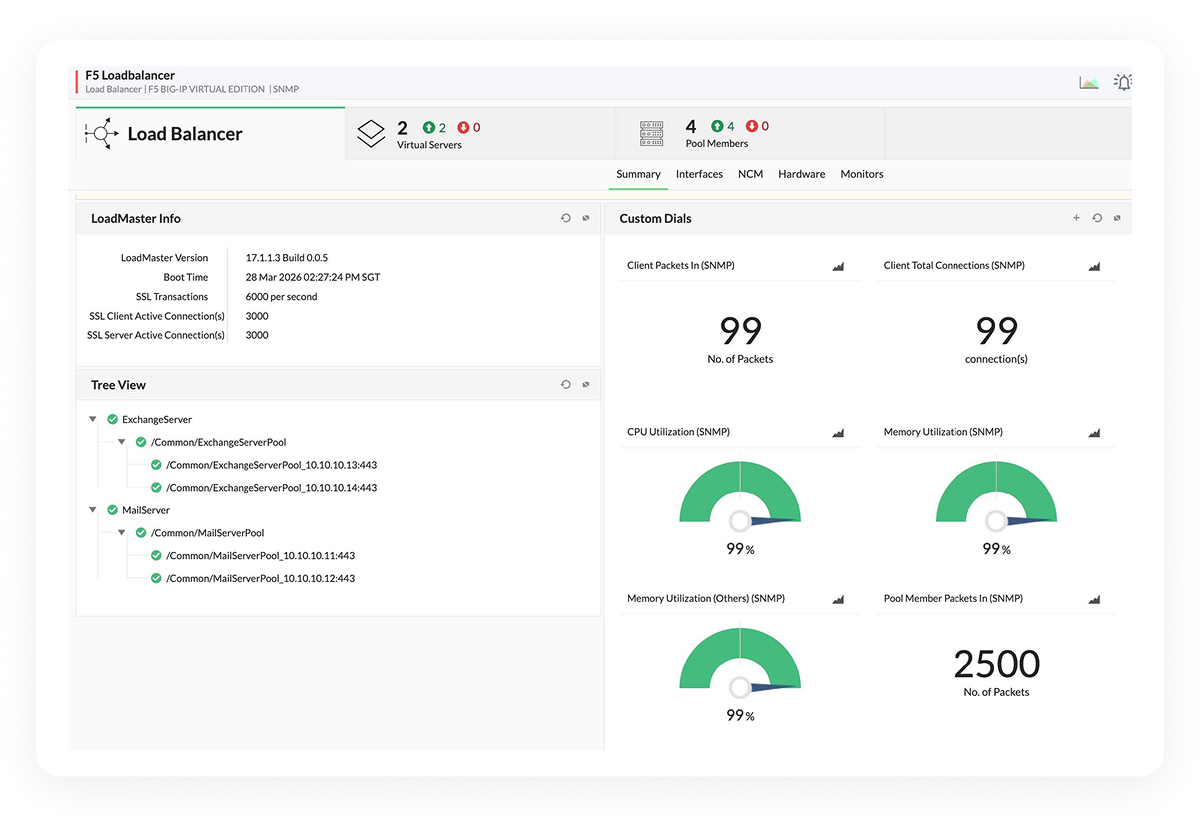
Get a real-time health status for every pool member. You instantly know which servers are actually serving traffic versus which ones are dead but still showing as "online" in basic monitoring tools.
Maintain SLAs with surgical precision:
Prove uptime to your stakeholders with granular availability reports. When a customer claims downtime, you have the data to show exactly when services were available and how traffic was routed.