Virtual machines (VMs) are indispensable in an enterprise network environment. If your organization falls under the small and medium-sized enterprise (SME) category, your network requirements may constantly be expanding, and VMs are the best option to meet these needs since you can manage your inventory with very little effort. Adding or deleting a device in a virtual network is possible with just a few clicks, whereas for physical devices, you'll need dedicated technicians and a lot of manual effort, not to mention the time it takes to make the necessary device configurations.
Nutanix, a cloud computing software company, is a preferred vendor of VMs across all scales of enterprise networks due to its cross-platform support for other VM service providers and its Hyperconverged Infrastructure (HCI) capabilities. In other words, all necessary components for a VM to function, such as processors, memory, and storage (SSDs and hard disks), are integrated within the VM itself, bringing latency down to almost negligible levels and remarkably increasing performance and efficiency.
ManageEngine OpManager: The comprehensive Nutanix performance monitoring solution
OpManager helps you extensively monitor Nutanix performance with ease, displaying data in various levels of the hierarchy from status and critical metrics of clusters and hosts to individual VM-related statistics. OpManager proves to be extremely efficient than most other Nutanix monitoring tools in holistically managing your Nutanix HCI environment, and can also monitor VMware, Hyper-V, and Hypervisor virtual environments.
Discover your Nutanix clusters in OpManager
Generally, discovering a Nutanix cluster from other network monitoring solutions can be tedious. There are various elements in the Nutanix network that you need to add individually, such as the cluster, the host, and the individual VMs.
With OpManager, discovering your entire Nutanix cluster is as simple as adding your IP and credentials, and OpManager will automatically fetch and list all hosts and VMs under that cluster. You can simply choose the ones you want to add in OpManager. Additionally, you can provide other credentials (SNMP/WMI/CLI) in the subsequent windows to perform Nutanix VM monitoring more extensively and fetch metrics that are otherwise not available through Prism, the default Nutanix monitoring API.
See everything about your Nutanix cluster in one place
As difficult as discovering your Nutanix environment is, the process of monitoring all your clusters, hosts, and VMs at the same time is even more tiresome and time-consuming, requiring constant navigation between multiple windows to get the metrics of every individual element in the Nutanix network.
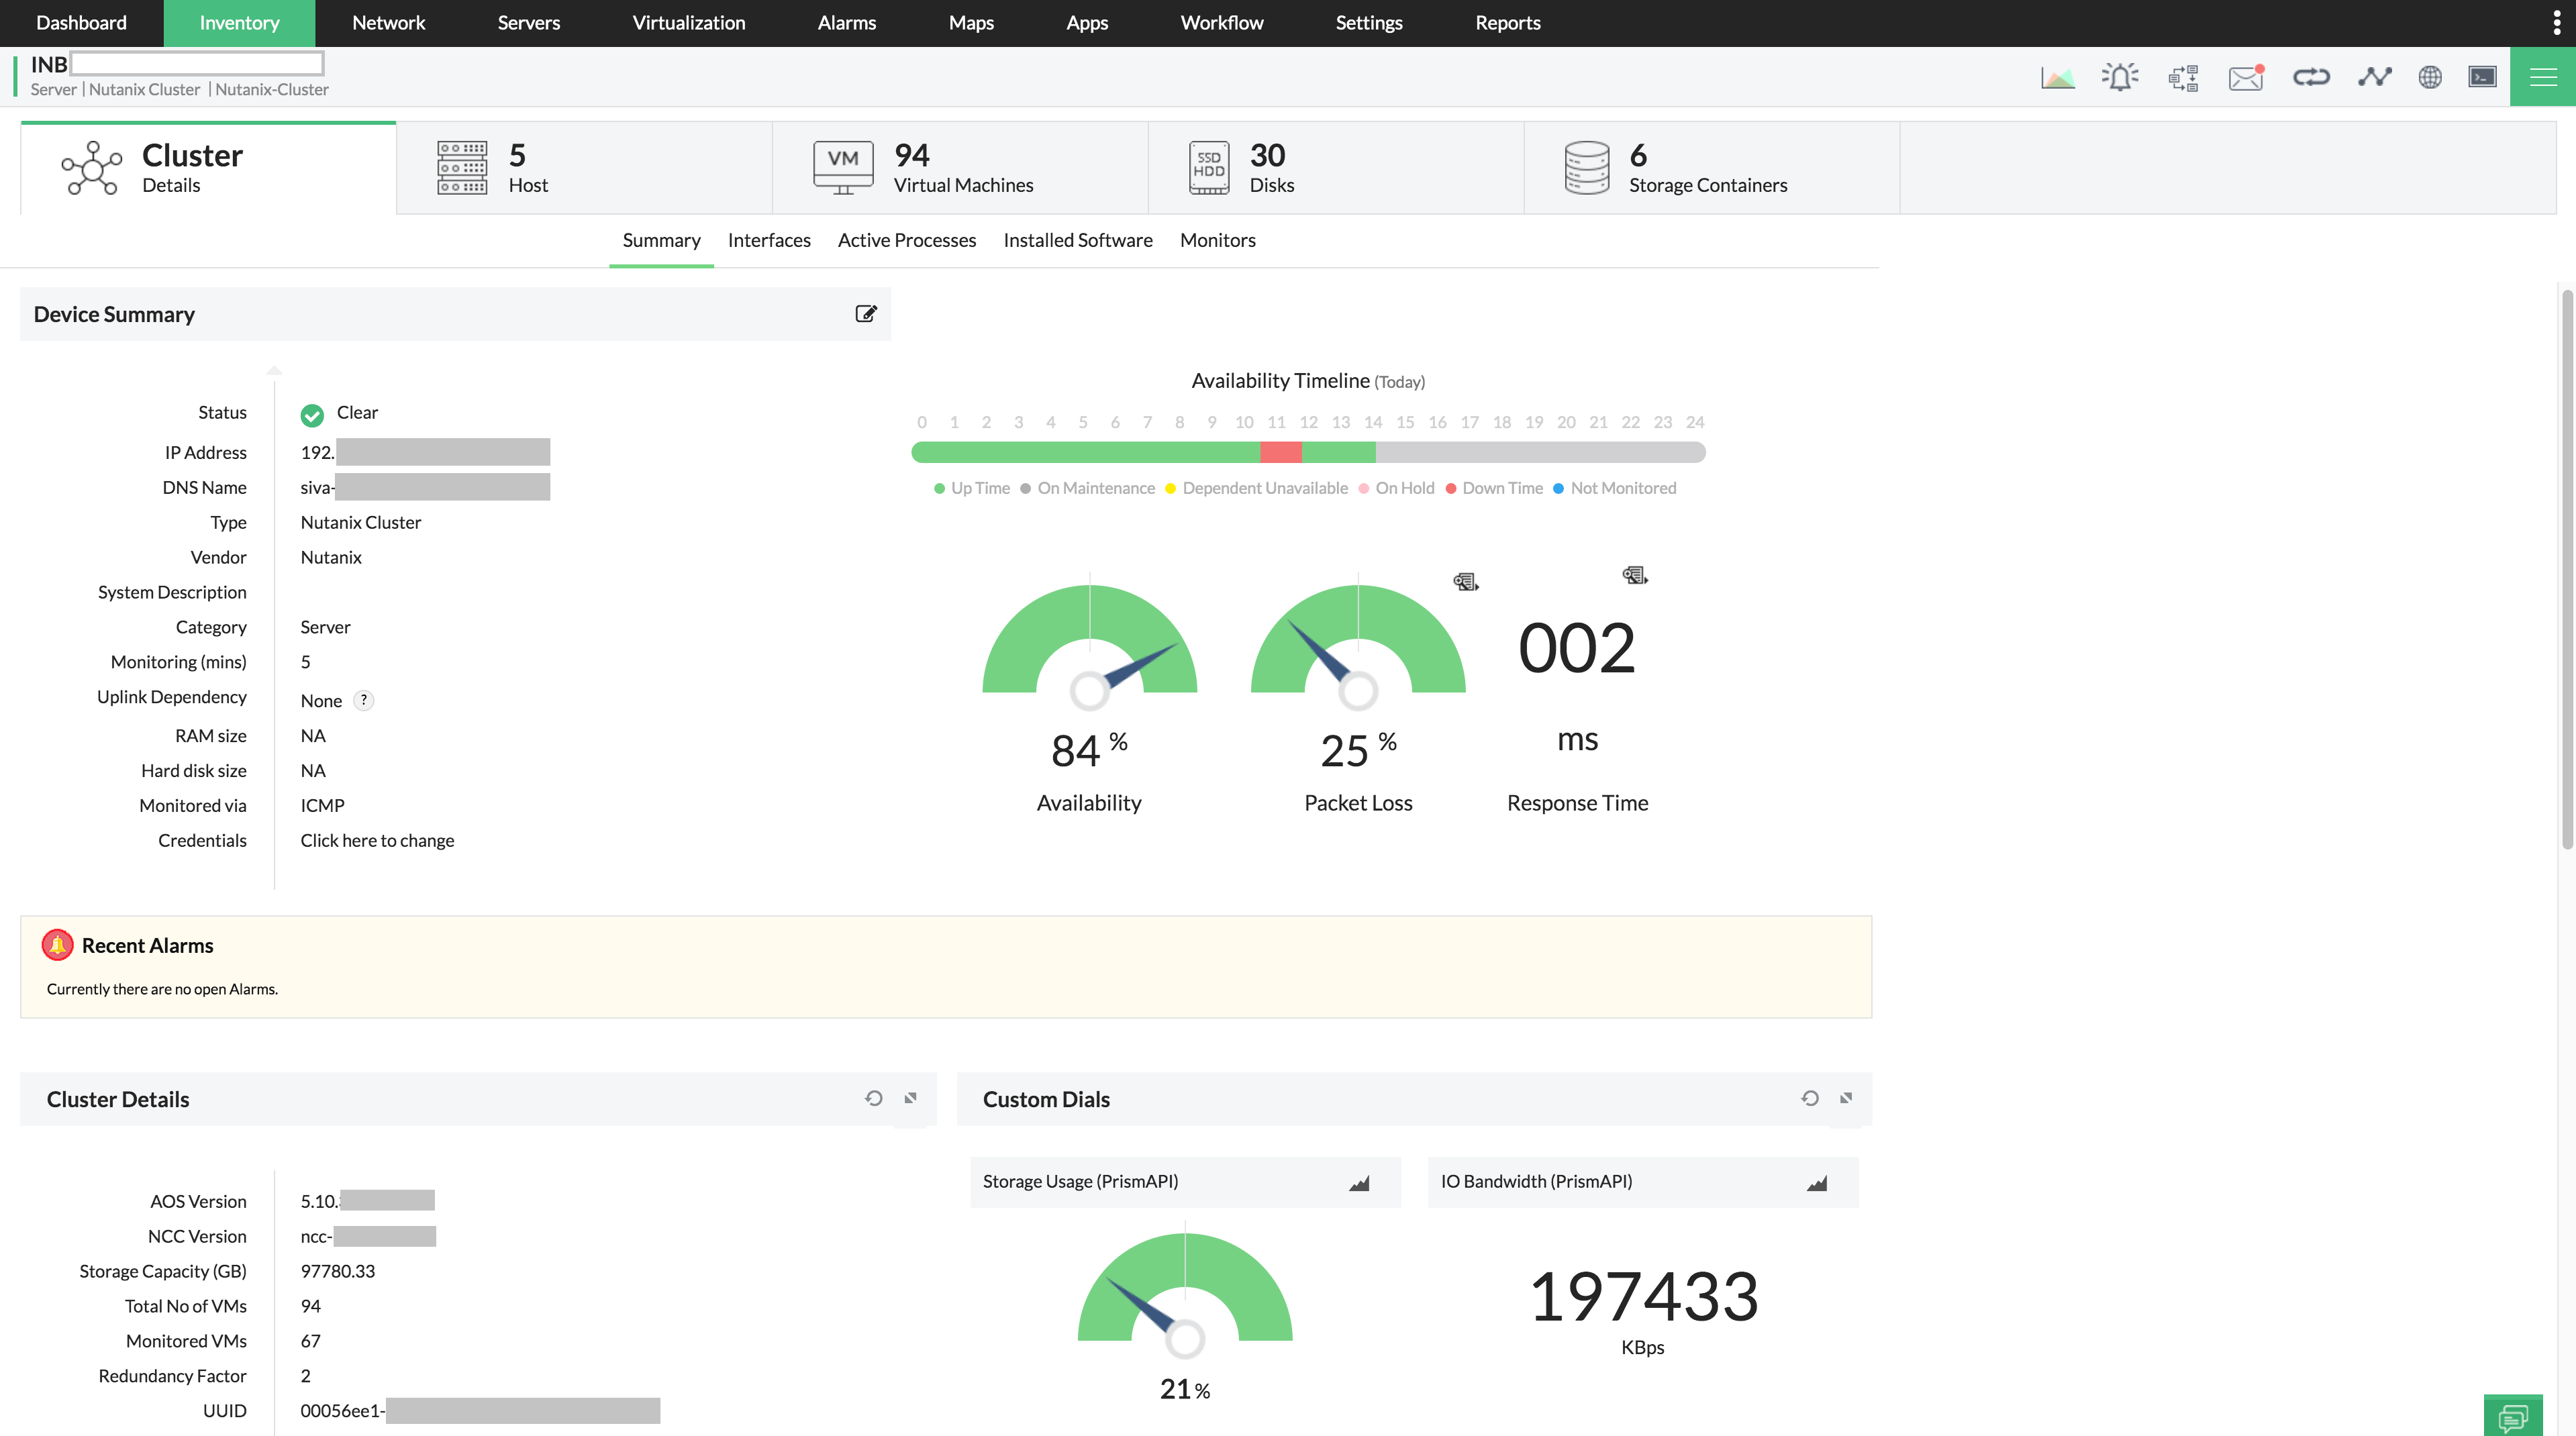
This is where OpManager gives you the upper hand over your virtual network. All critical stats and details about your Nutanix cluster are available on the device snapshot page of the cluster. From a single pane, all the data you need about the cluster, its health, hosts, and VMs are available in easily accessible tab views, ensuring you don't miss out on any updates. Nutanix-specific details such as the AOS version, NCC version, and redundancy factor are available on the snapshot page itself, making it easier to view everything you need to know about your cluster at once.
For more info on any of the hosts, you can directly navigate to the respective device snapshot page from the hosts tab of the cluster snapshot page.
Keep track of your Nutanix hosts in real-time
Monitor your hosts with ease with the help of real-time alerts, so you know the moment something goes wrong in your Nutanix environment. Being a 'hypervisor-agnostic' environment, your Nutanix environment might have several hypervisors running in its clusters - either the native 'Nutanix AHV', or hypervisors from other vendors such as Microsoft's Hyper-V or VMware's ESXi. All of these hosts are also discovered by OpManager, making it easier to manage the otherwise complex Nutanix HCI environment.
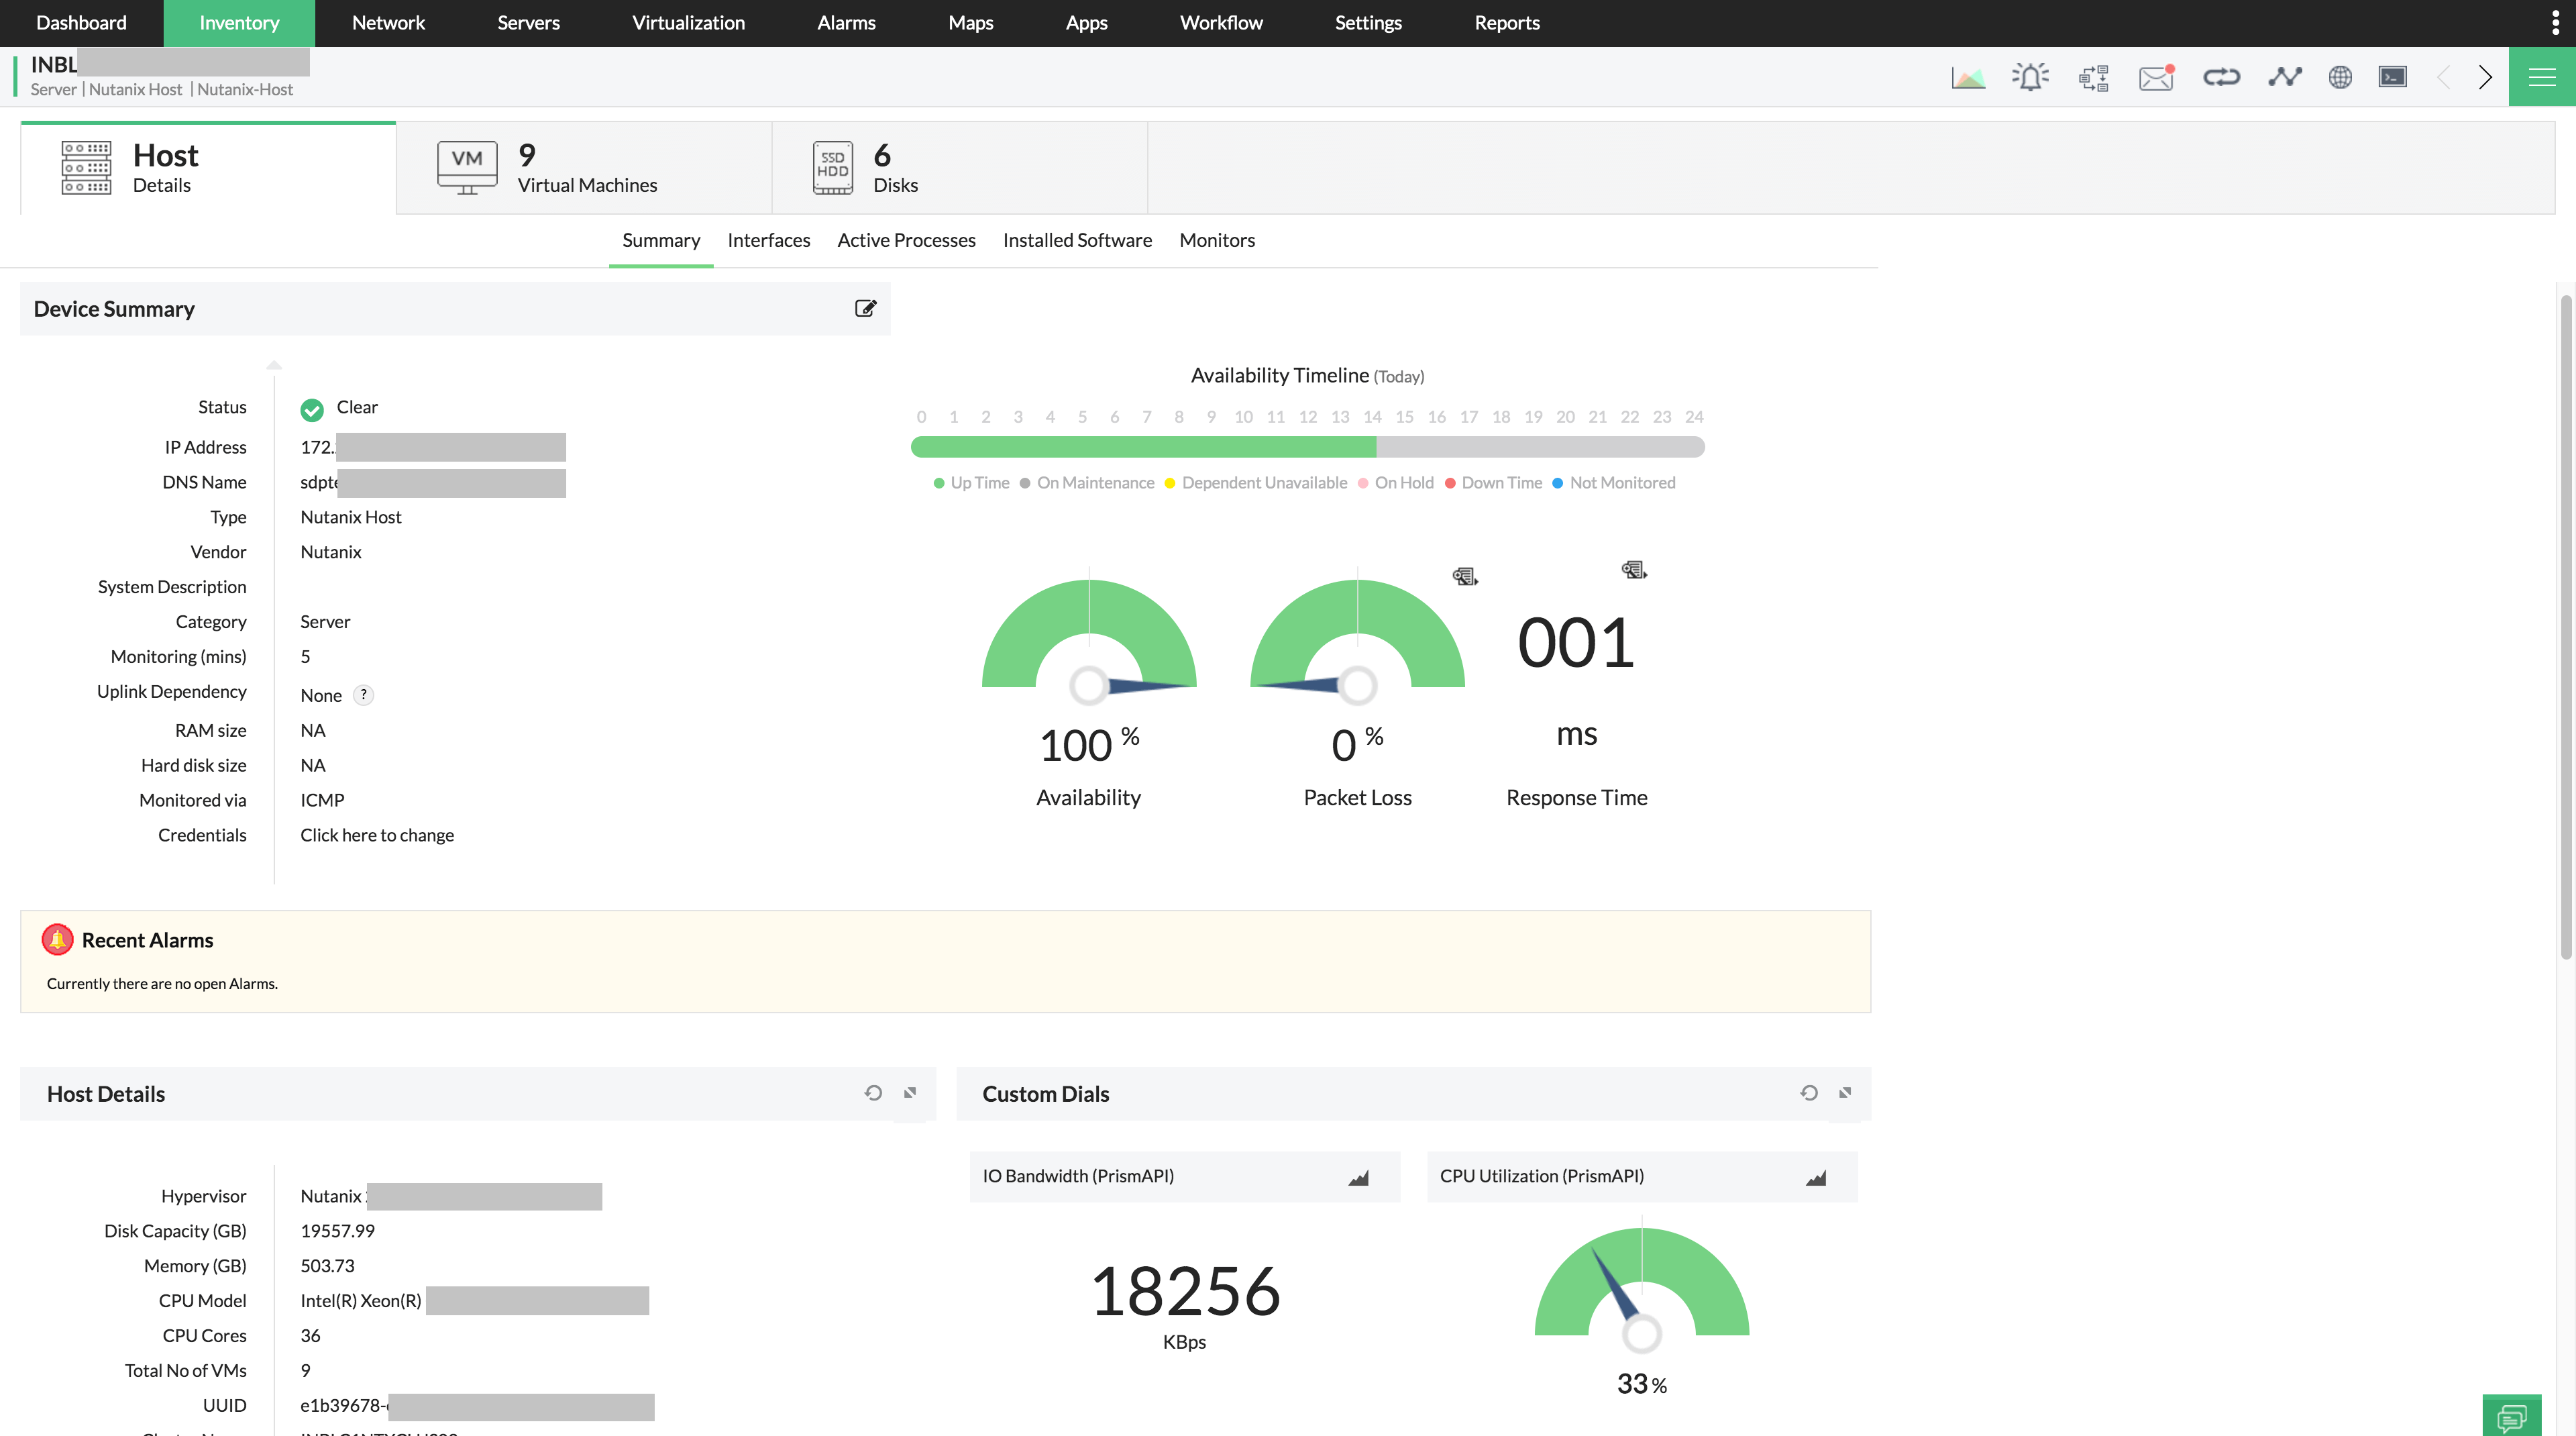
The host snapshot page in OpManager lists all the basic details of the Nutanix host, along with the list of VMs under it and storage disks in which they have been mounted. Clicking on any VM in the virtual machines list takes you to the individual VM snapshot page, from where you can perform VM-specific monitoring tasks.
Comprehensively monitor Nutanix VMs through SNMP/WMI/CLI
By default, OpManager fetches most performance-critical details from your Nutanix network using Prism API, the management plane for the Nutanix environment. However, you cannot monitor all possible metrics of any element in this case; exhaustive Nutanix performance monitoring using just the default monitors associated with the Prism element is not possible. For example, if the VM is running an MSSQL service, it is not possible to retrieve MSSQL service-specific metrics, such as batch request rate and stats about buffer cache.
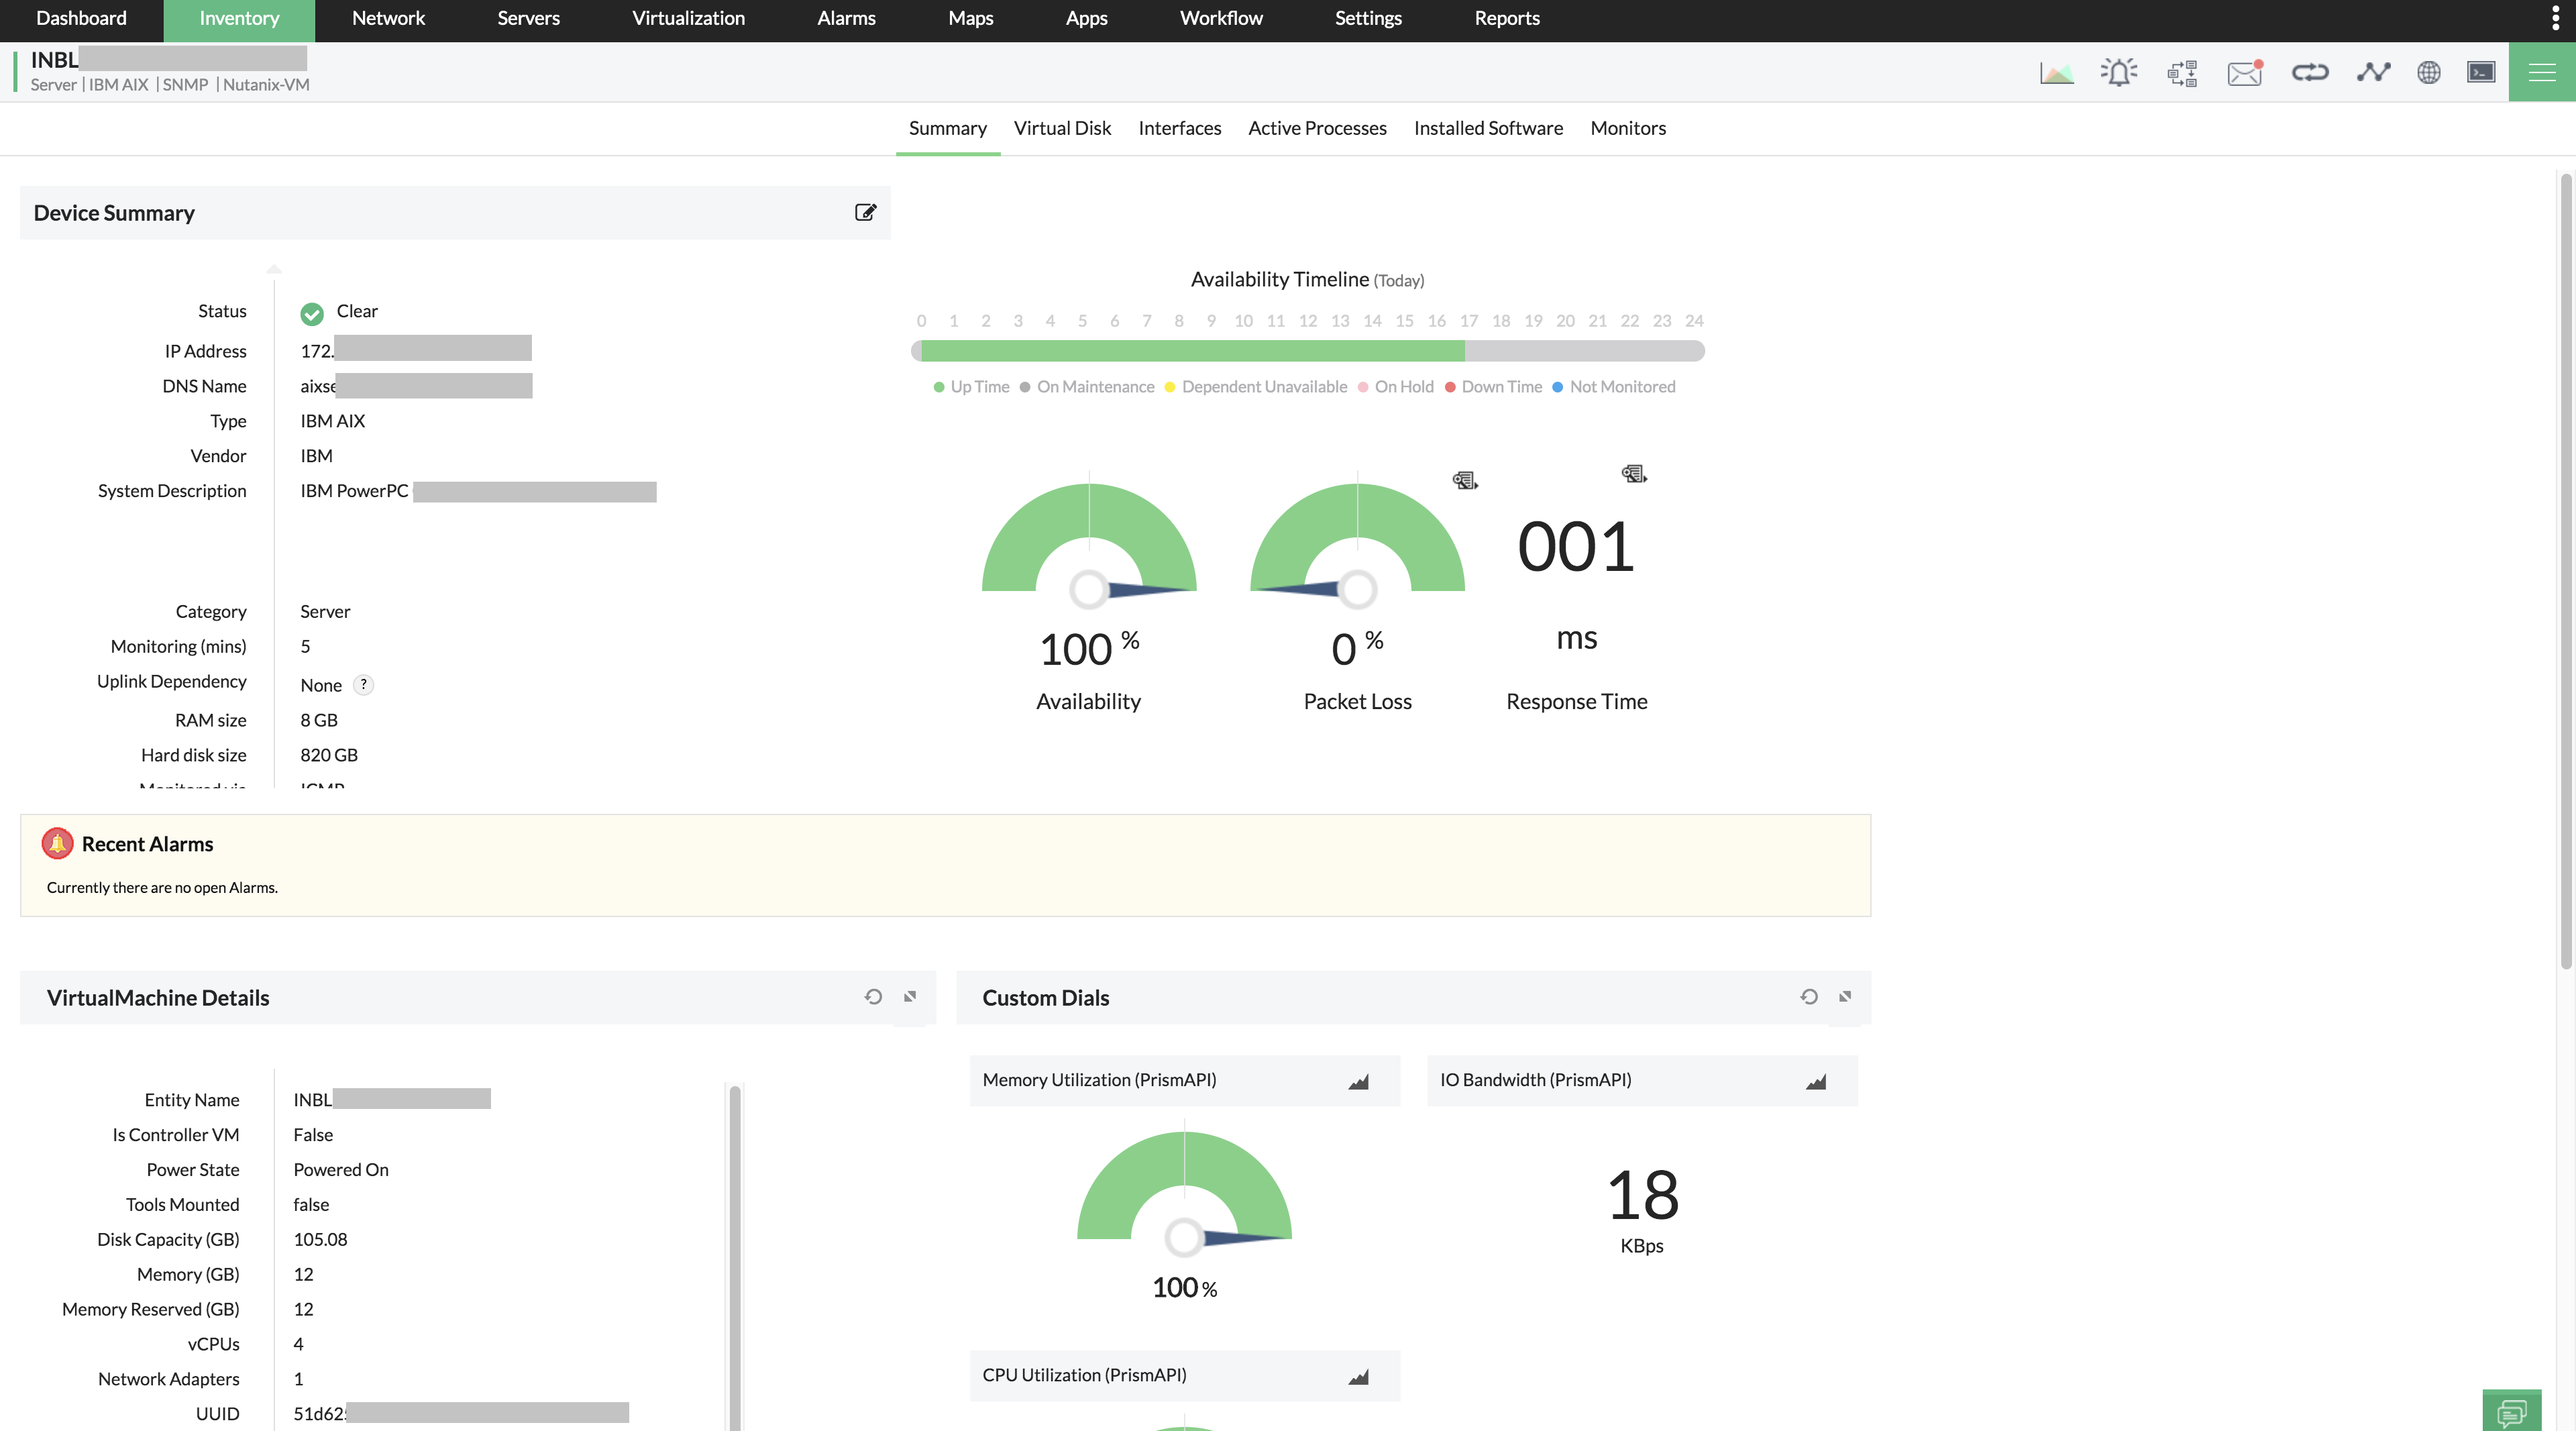
If you wish to perform extensive Nutanix VM monitoring for your environment, OpManager provides the option to use SNMP/WMI/CLI to fetch performance metrics from the VM directly. After you select the hosts and VMs during discovery, select the credential profiles for your VM on the next page, and OpManager will apply the suitable credentials and start monitoring your VMs.
If you want to start monitoring your VMs at a later period in time, you can add the credentials to OpManager and then associate those credentials to all your VMs using the discovery profile feature.
Monitor Nutanix performance in real-time
Once your cluster, related hosts, and VMs have been added to OpManager, the related performance monitors are automatically associated with the suitable objects. You can also associate other monitors with objects from the performance monitors page. By default, OpManager provides over 30 metrics for Nutanix performance monitoring to monitor all elements of the Nutanix Hyperconverged Infrastructure - clusters, hosts, and VMs, which are fetched from the corresponding objects through Prism API.
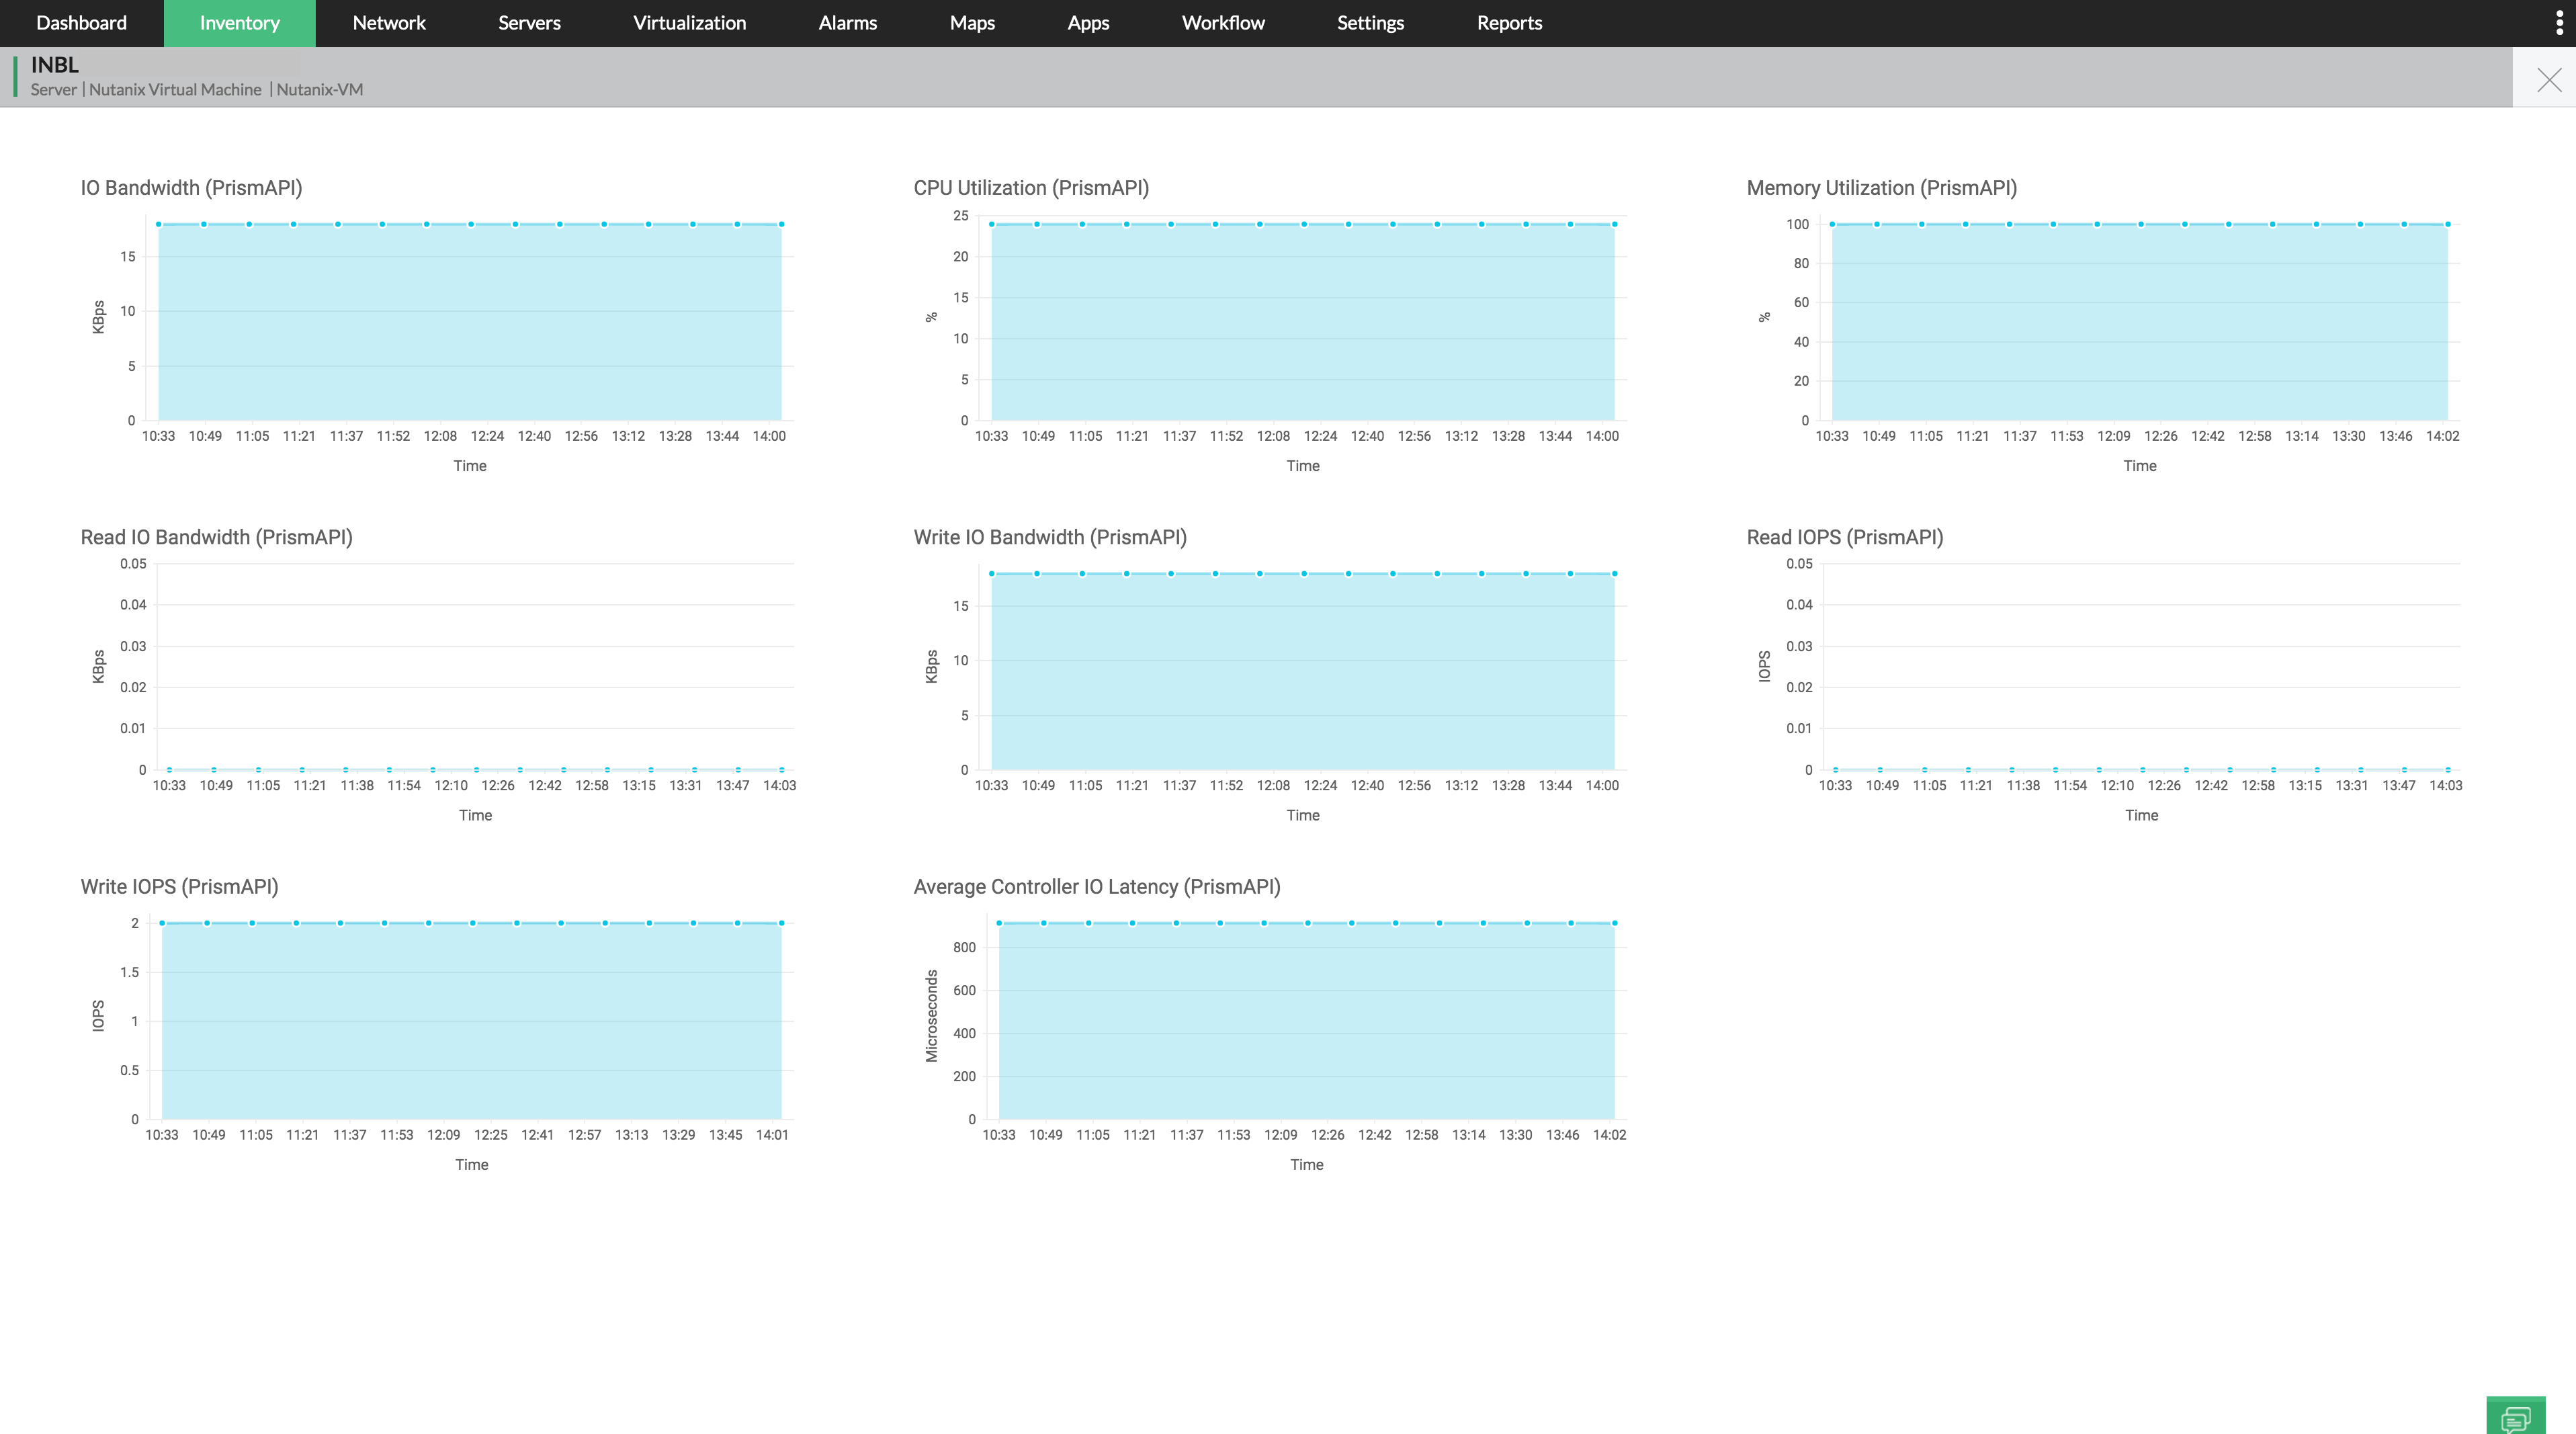
Apart from these, you can add custom monitors based on SNMP or WMI to monitor your VMs more extensively. They'll be used to fetch device-specific critical performance metrics that cannot be fetched through the primary Nutanix monitoring architecture.
Manage your Nutanix inventory, reports, and more
Once you're all set with discovering your Nutanix infrastructure, OpManager helps you manage them all efficiently with in-depth reporting and alerts. There is a separate section in OpManager reports dedicated to Nutanix elements, equipped with extensive reports that cater to all your Nutanix monitoring needs. Some of the reports offered include:
- VM Summary by Cluster
- VM Summary by Host
- Cluster Inventory
- Disk Inventory
- Top N hosts by IOPS/free space/latency/IO bandwidth
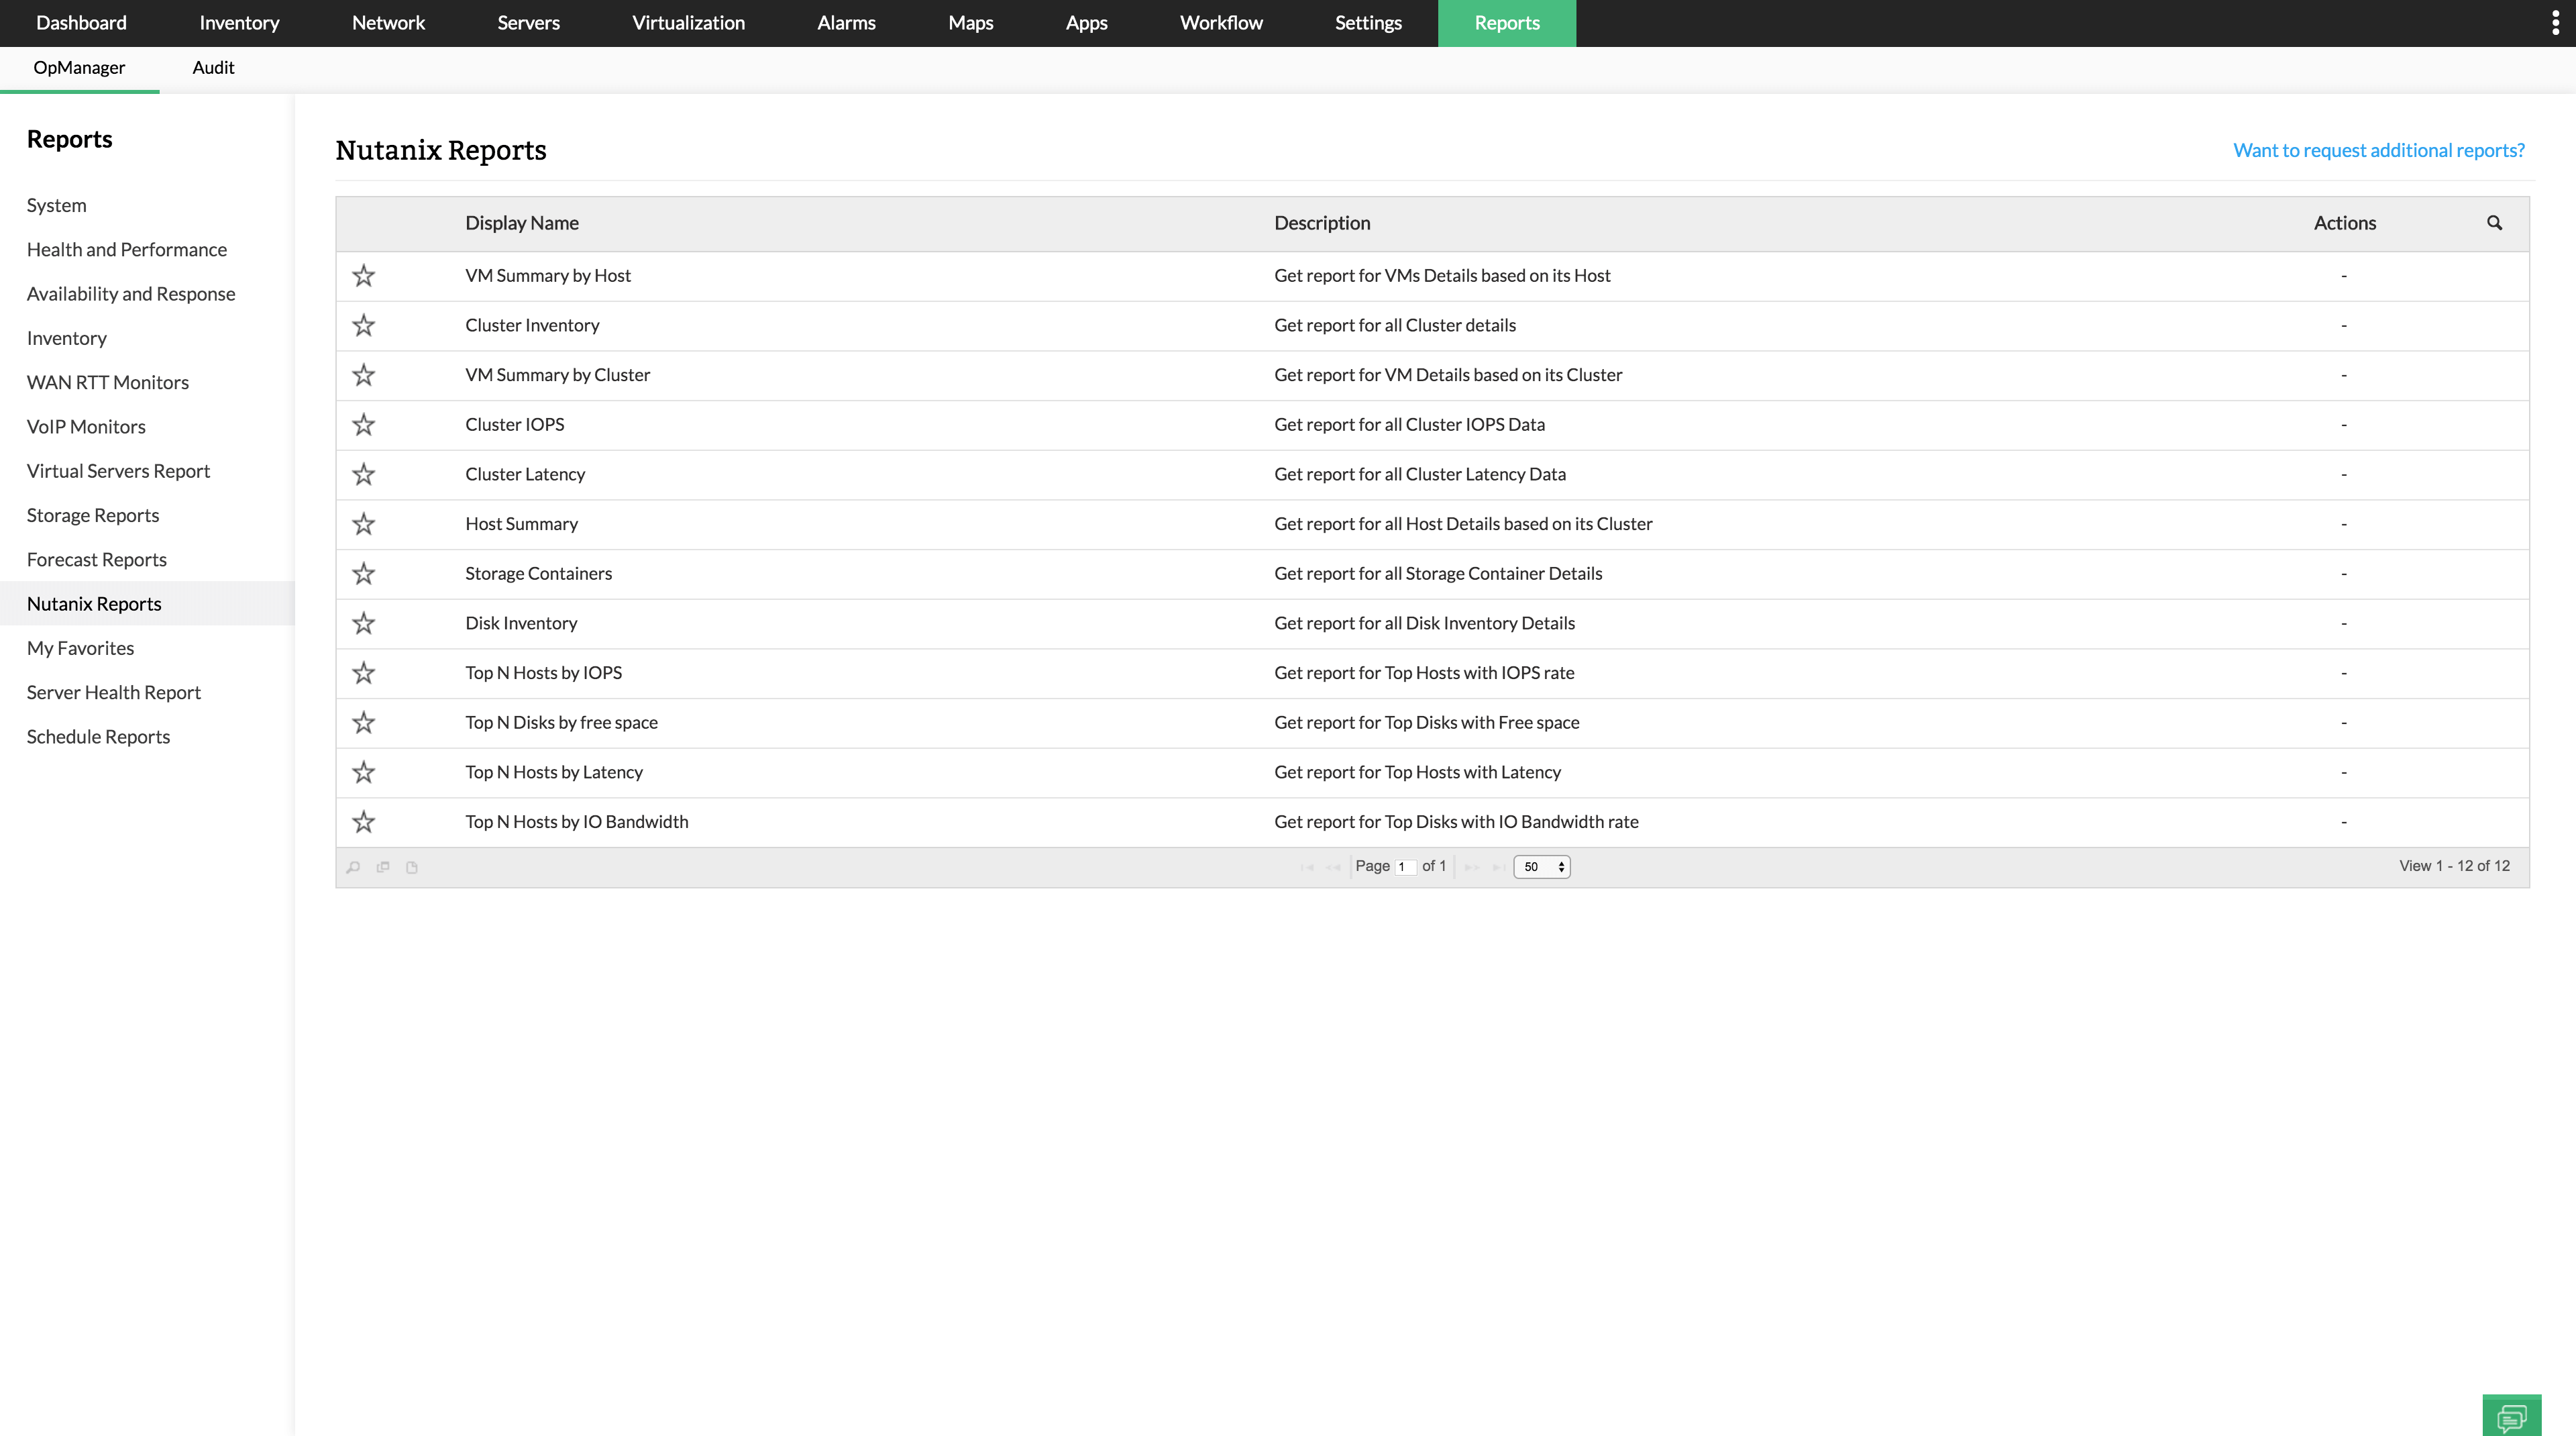
Apart from these, you can also create custom reports based on specific criteria to monitor other stats. You can even schedule these reports to be generated at a specific time every day, week, or month, and get them delivered to your email address or saved as PDFs for later use.
Simplify Nutanix HCI's monitoring with OpManager.
Download 30-day free trialCustomer reviews
Case Studies - OpManager
Awards & Honors
- Recognized as a May 2019 Gartner Peer Insights Customers' Choice for Network Performance Monitoring and Diagnostics Software
- Recognised as an April 2019 Gartner Peer Insights Customers' Choice for IT Infrastructure Monitoring Tools.
- Network Management and Monitor Vendor of the Year 2018, 2019
- Entered the 2019 Gartner NPMD Magic Quadrant.
- Ranked #2 in the Infotech Research Software Reviews Data Quadrant 2018.
