Router monitoring software
Monitor router availability, performance, traffic, and hardware health with ManageEngine OpManager.
- Automated router discovery
- AI-driven monitoring
- Multi-channel alerts
What is router monitoring?
Router monitoring is the process of monitoring a router's health, availability, and performance. Router monitoring software uses protocols like SNMP, ICMP, gNMI, and flow technologies to monitor your routers. ManageEngine OpManager is a network monitoring software with powerful router monitoring capabilities. OpManager's vendor-agnostic router support and AI-driven monitoring helps you find router issues before they affect the users.
OpManager's router monitoring capabilities
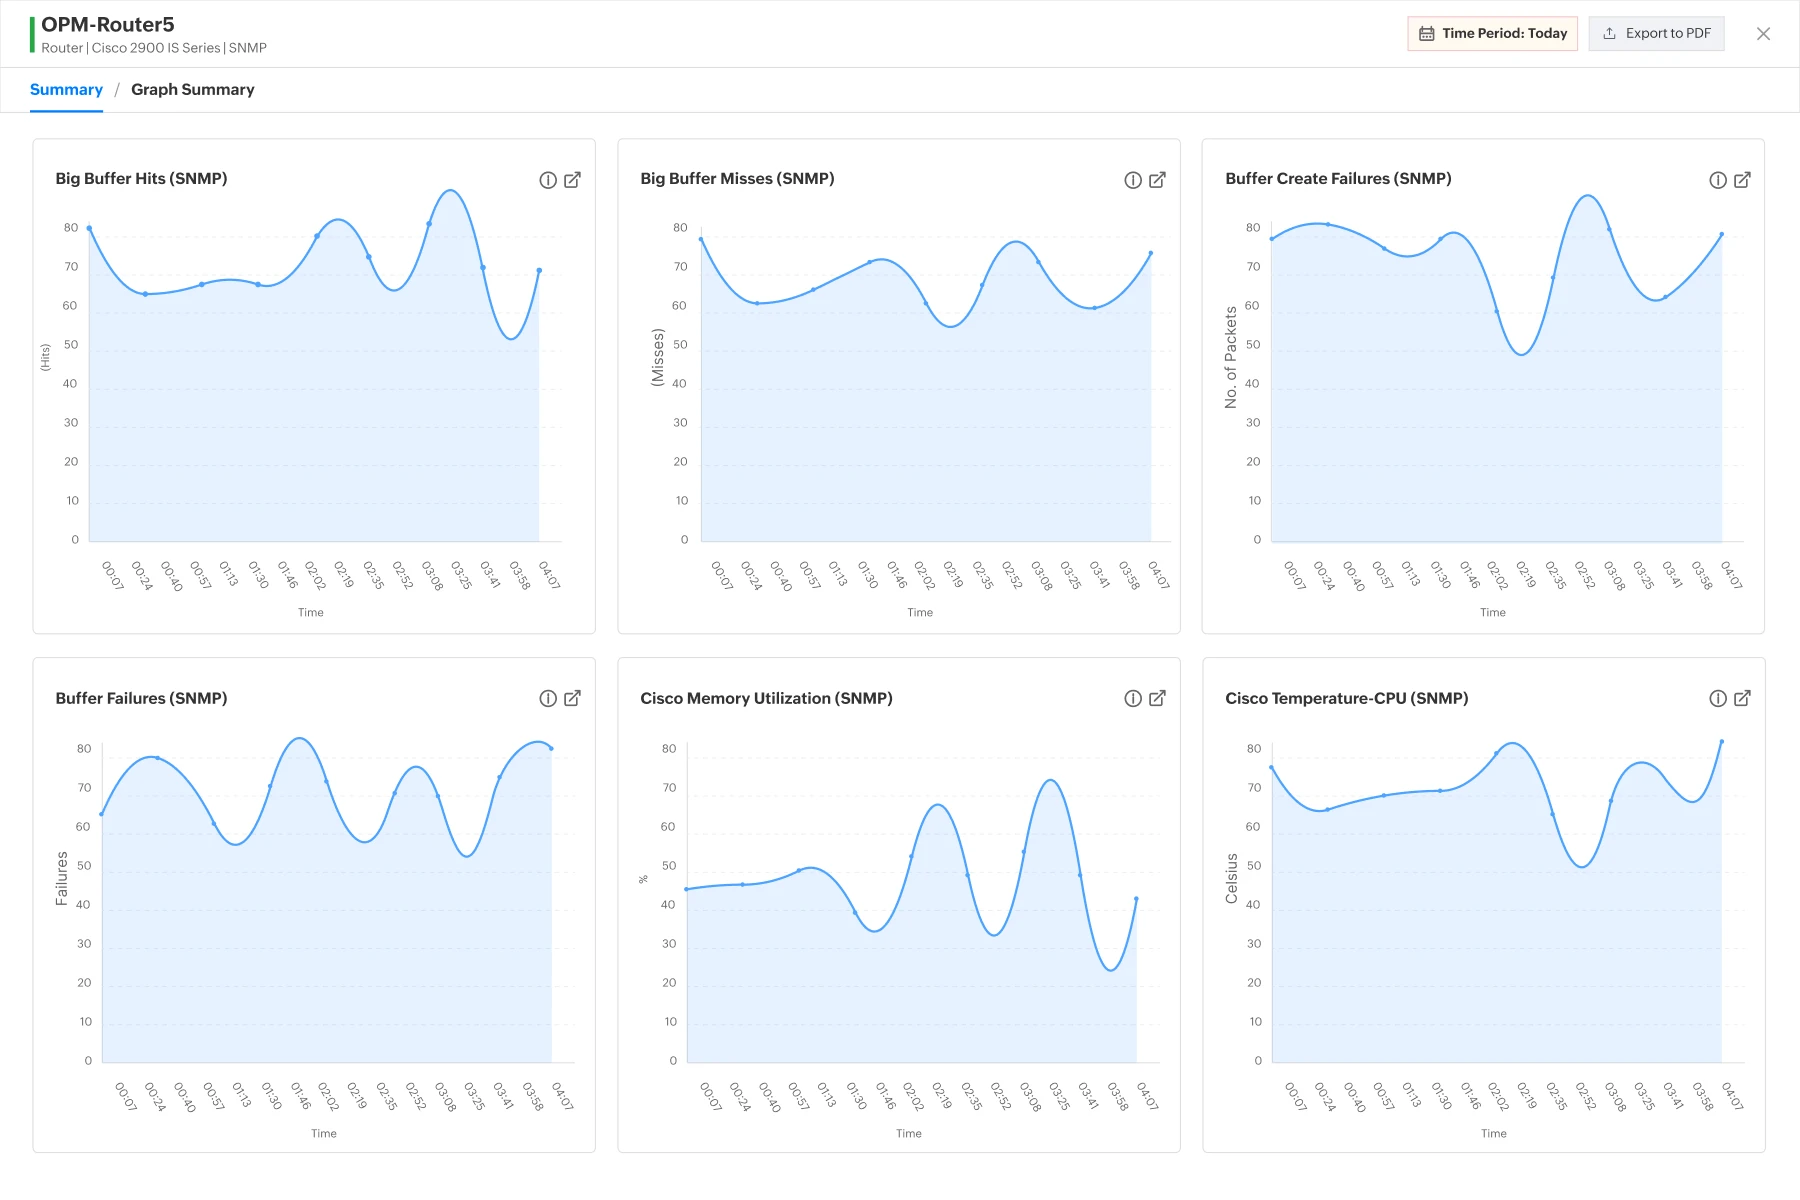
Track router availability and key performance indicators
OpManager pings your routers on a regular basis with protocols like SNMP, ICMP, TCP, and gNMI to monitor their uptime and performance.
- Review your router uptime statistics with timelines, graphs, auto-generated reports, and dashboards.
- Track key metrics like the CPU utilization, memory usage, traffic statistics, and buffers.
- Leverage dedicated maps, reports, and graphs to analyze router performance.
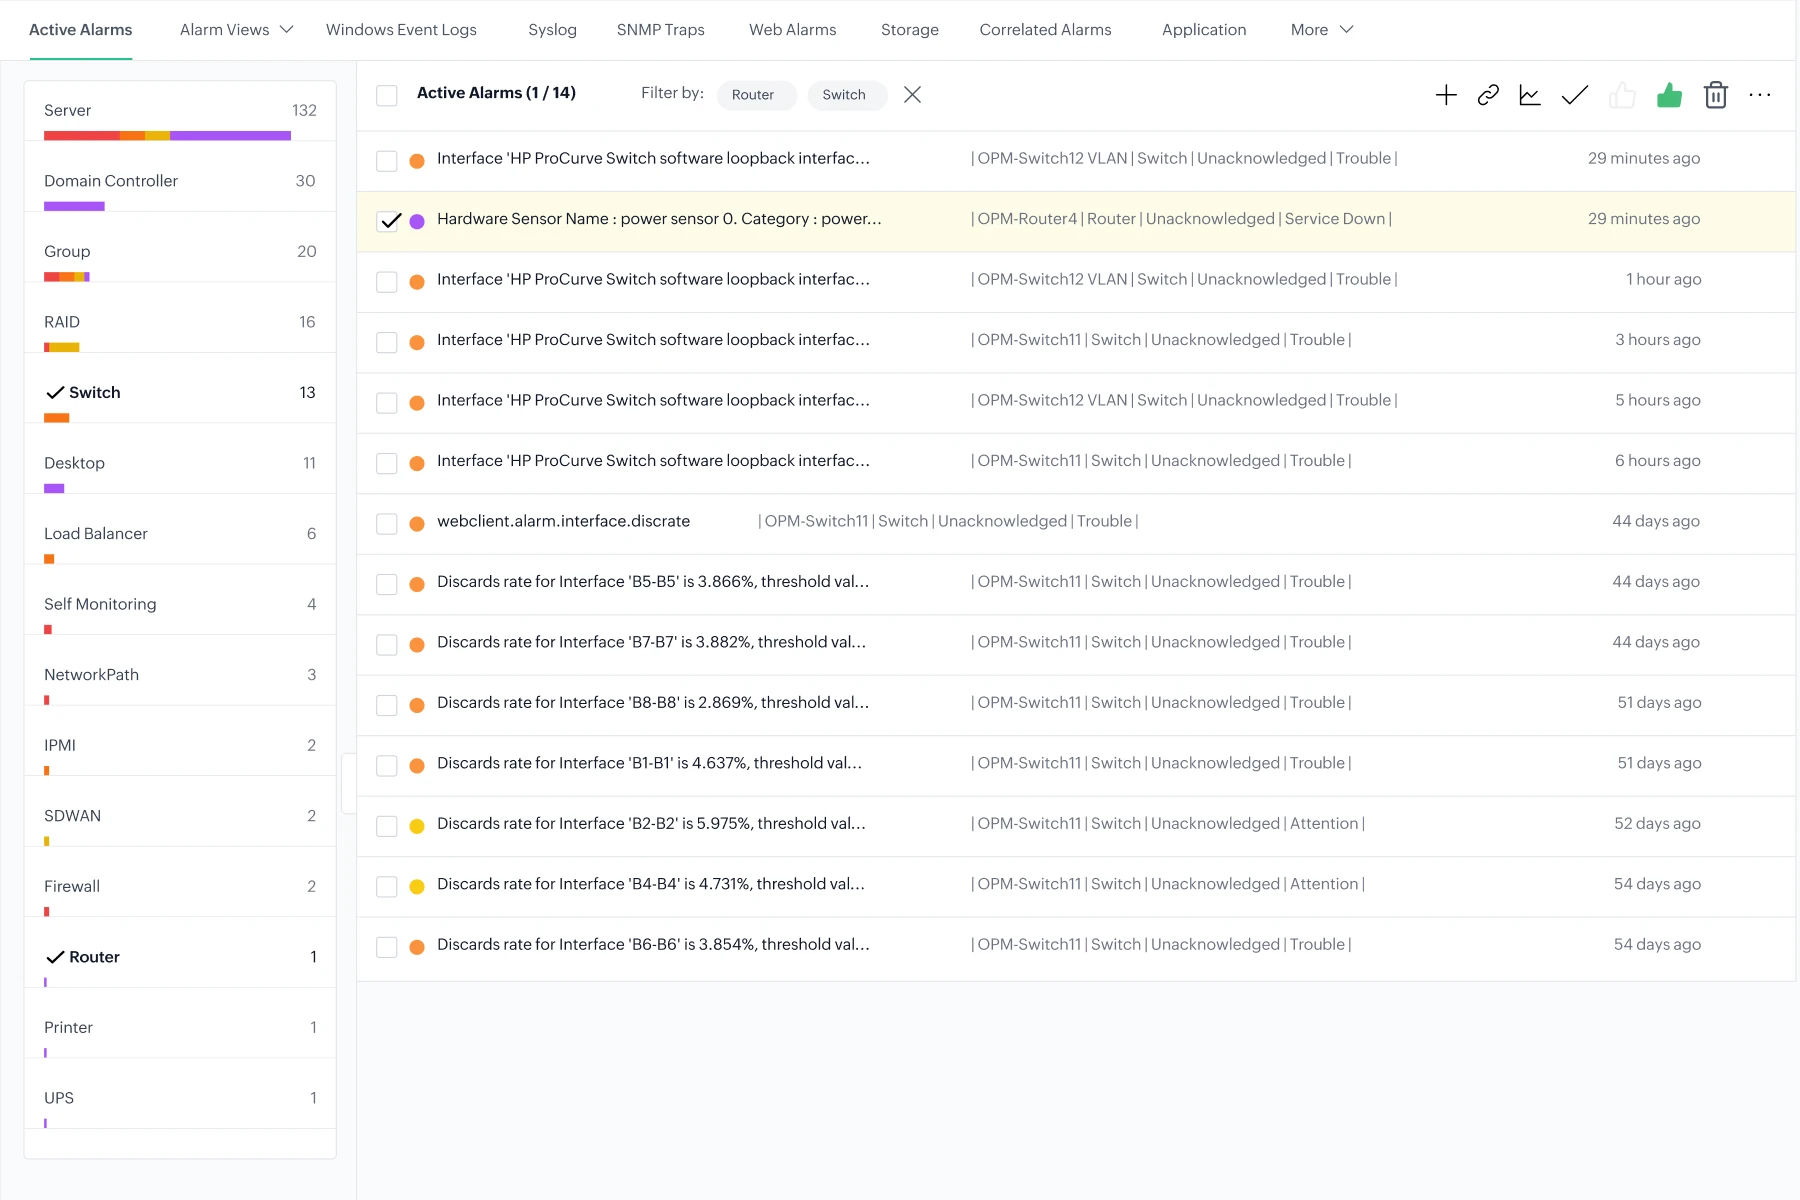
Speed up MTTD and MTTR with instant, context-rich alarms
Get colour-coded alarms with added context about the severity of the issue to aid troubleshooting.
- OpManager identifies network-level dependencies and suppresses alarms. So, if your core router goes down, you get one alarm instead a flood of alarms about the dependent devices going down.
- OpManager's AI-driven adaptive thresholds set and update performance monitoring alarms automatically, on an hourly-basis.
- Ensure that you're aware of all router issues by setting up notifications through SMS, email, helpdesk tickets, third-party chat tools, and more.
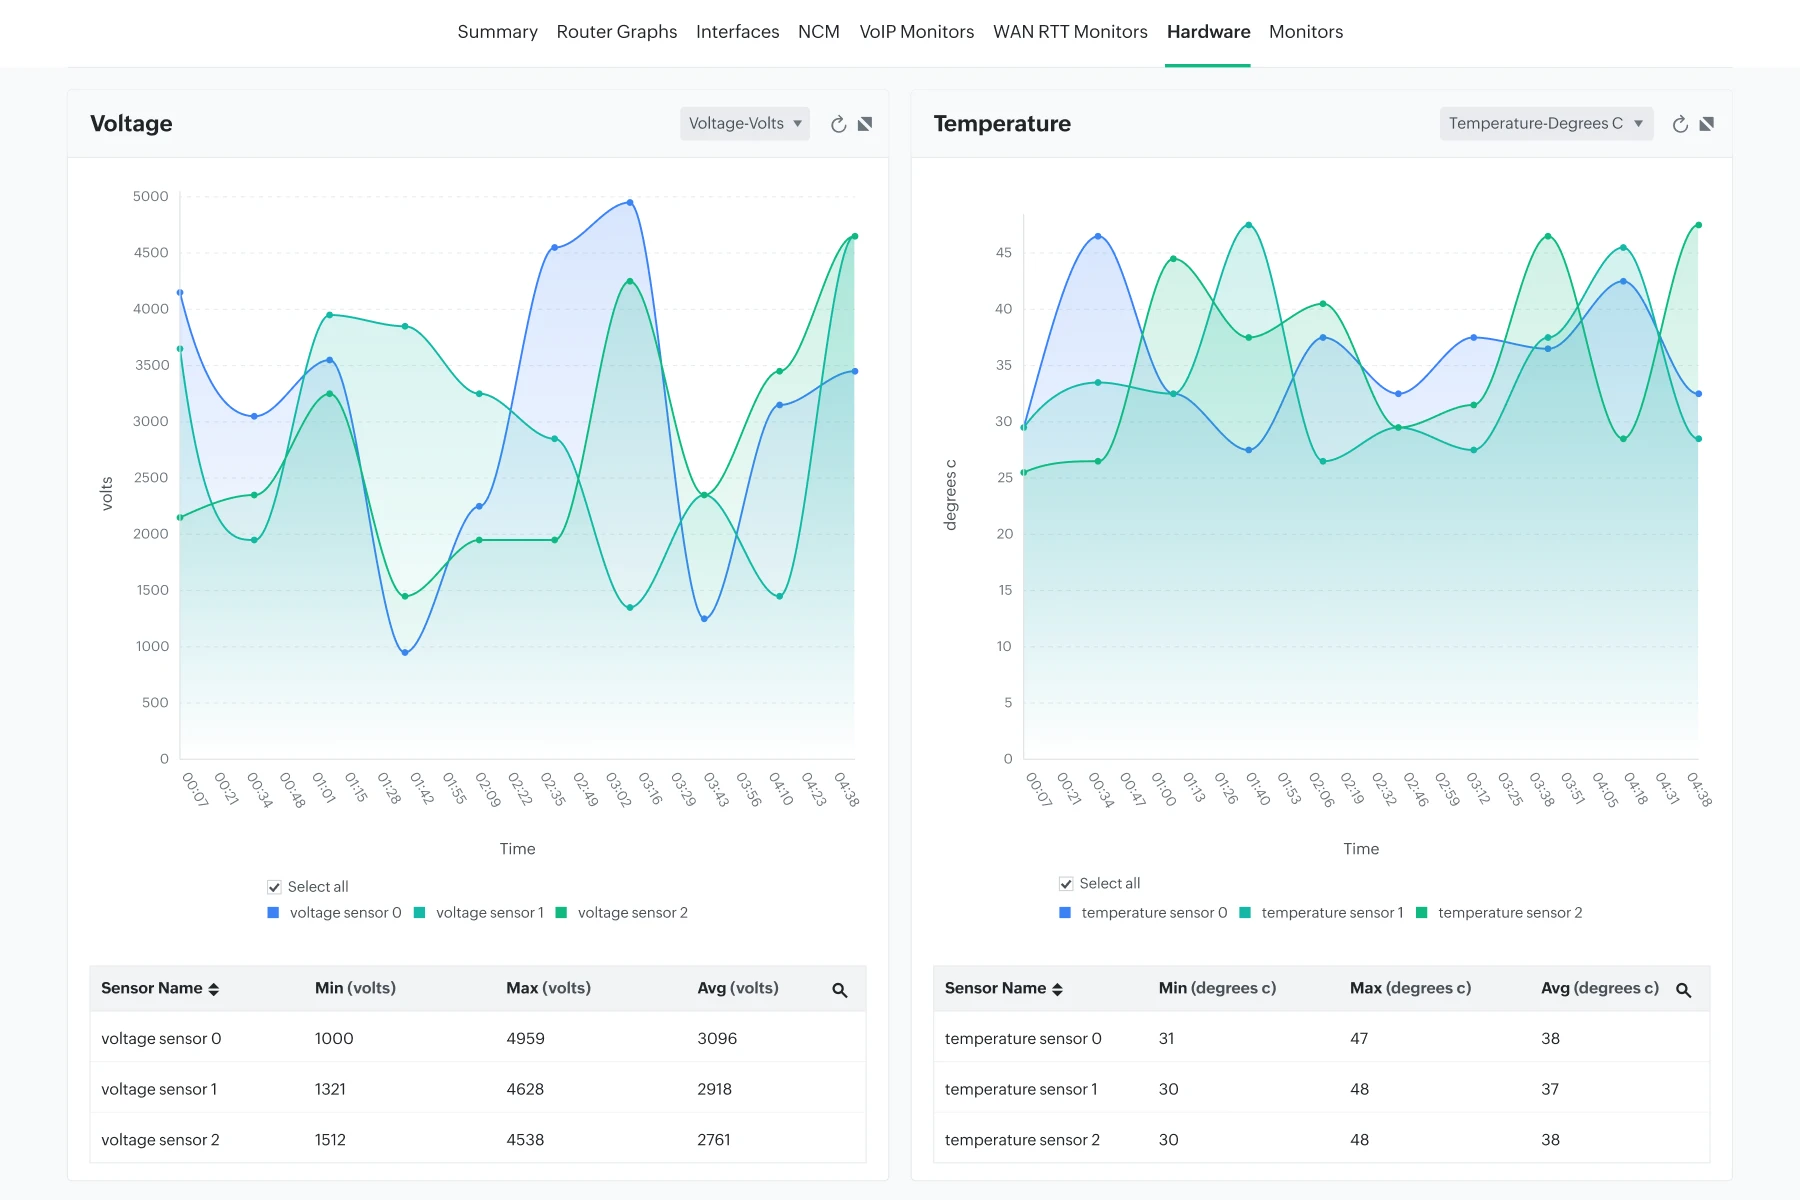
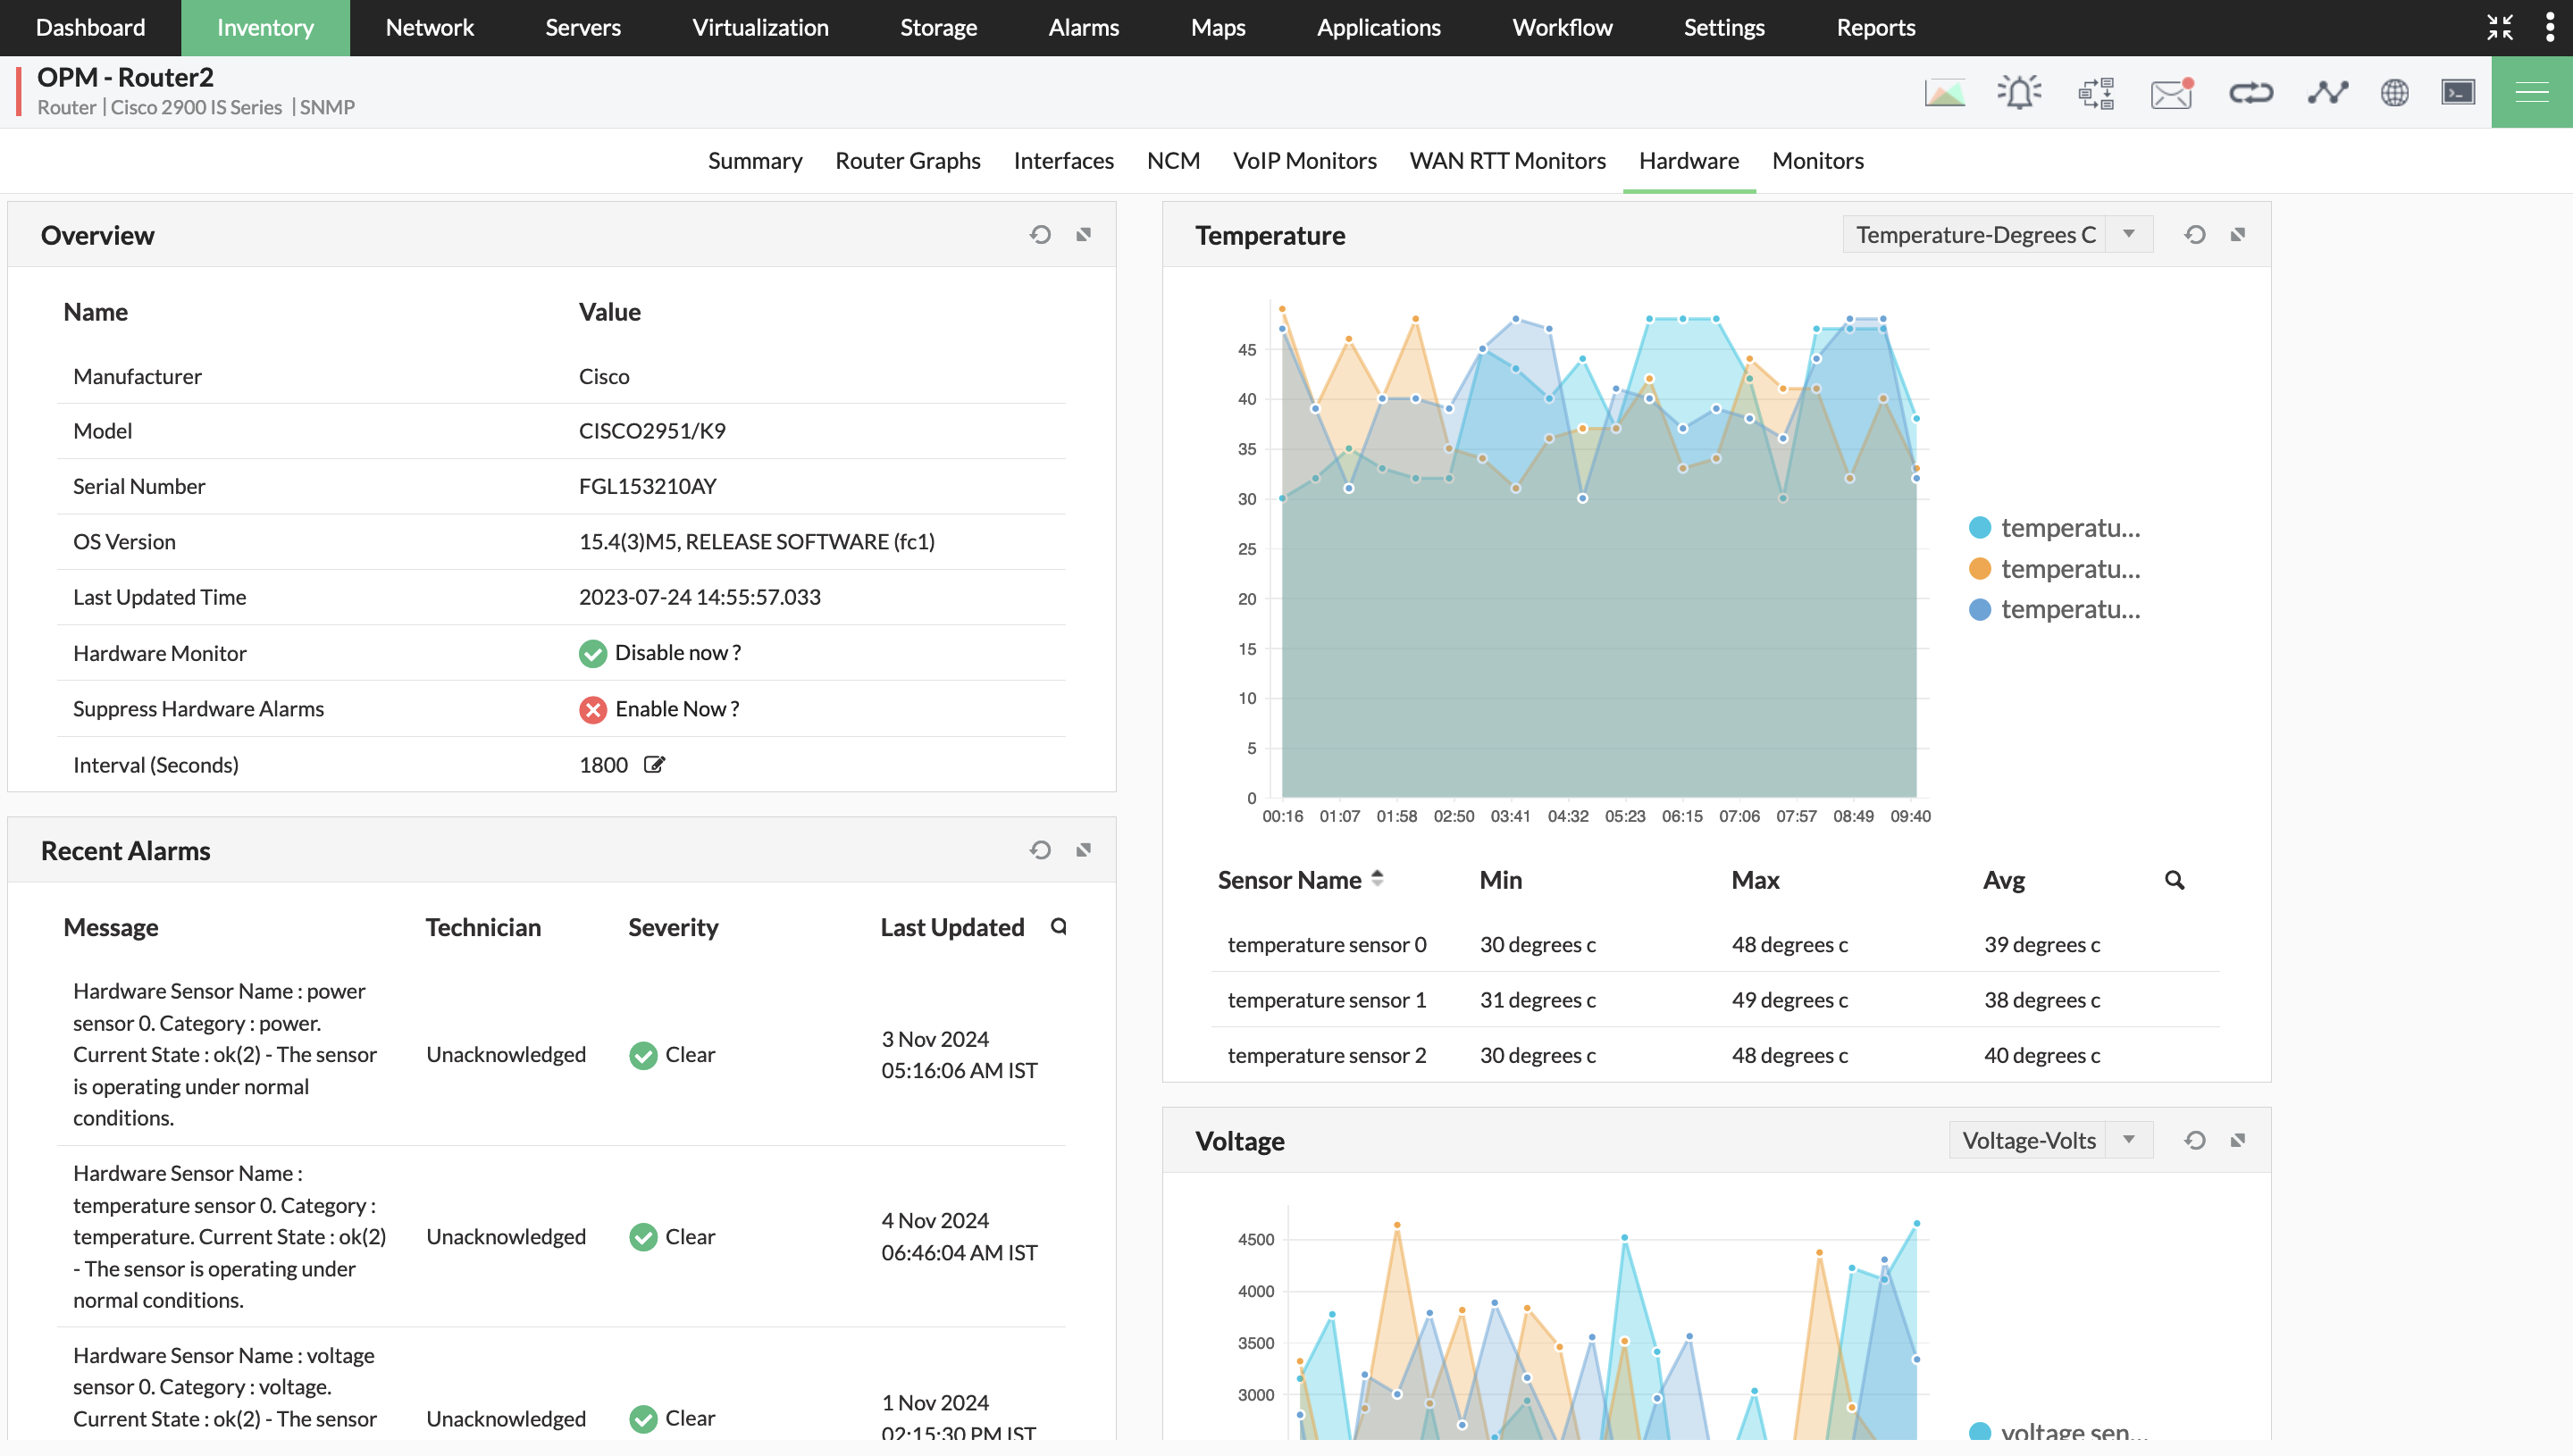
Ensure optimal router health with regular hardware checks
Monitor the health status of your router's hardware components to prevent unplanned network outages.
- Track the temperature of CPUs, cooling systems, and power supply units to identify hardware performance degradation.
- Review the hardware health of your router devices with dedicated reports and graphs.
Gain in-depth visibility into network interfaces
OpManager automatically discovers all interfaces associated with your router when it discovers your router.
- Track interface traffic, packet errors/discards, speed collisions, buffer misses and throughput data.
- Leverage specialized reports to keep tabs on interface traffic and utilization.
- Set up interface discovery rules to fine tune the interfaces that are automatically added for monitoring.

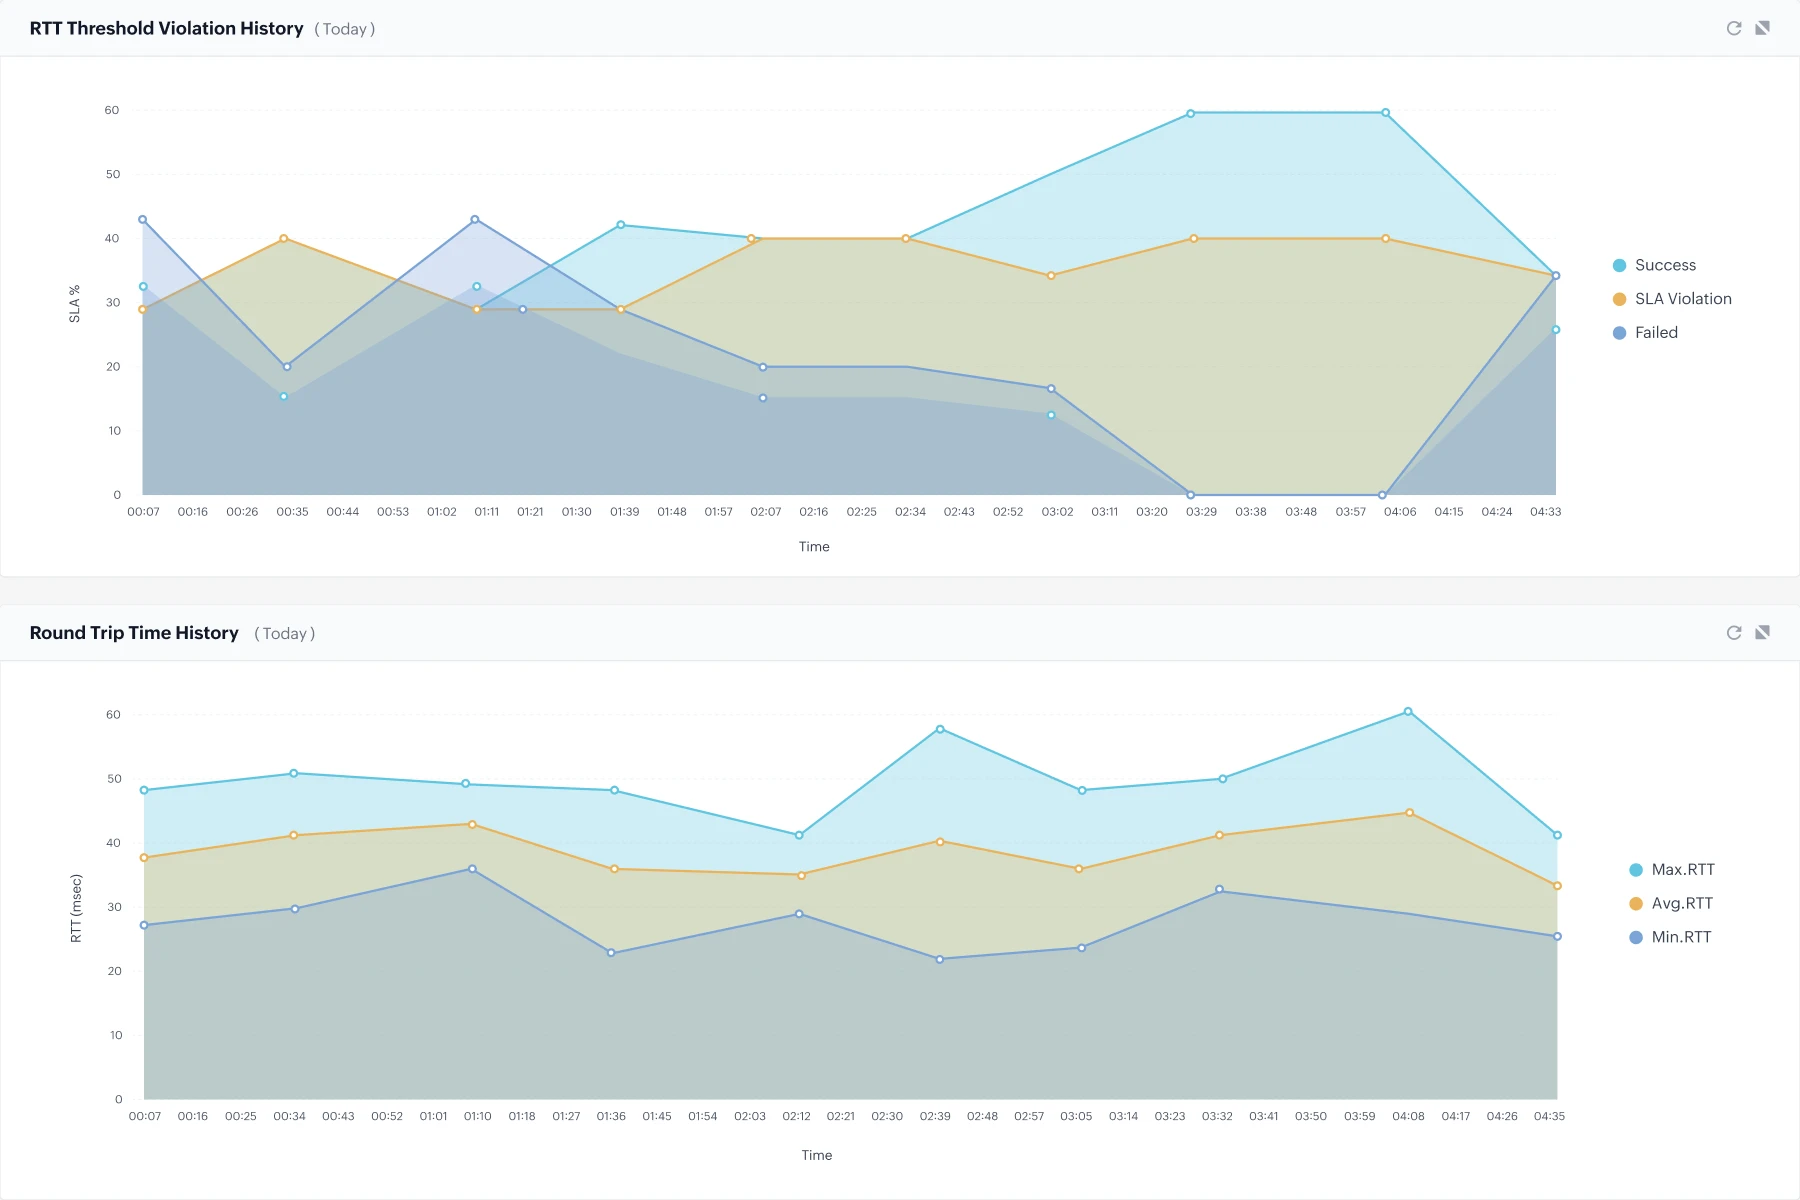
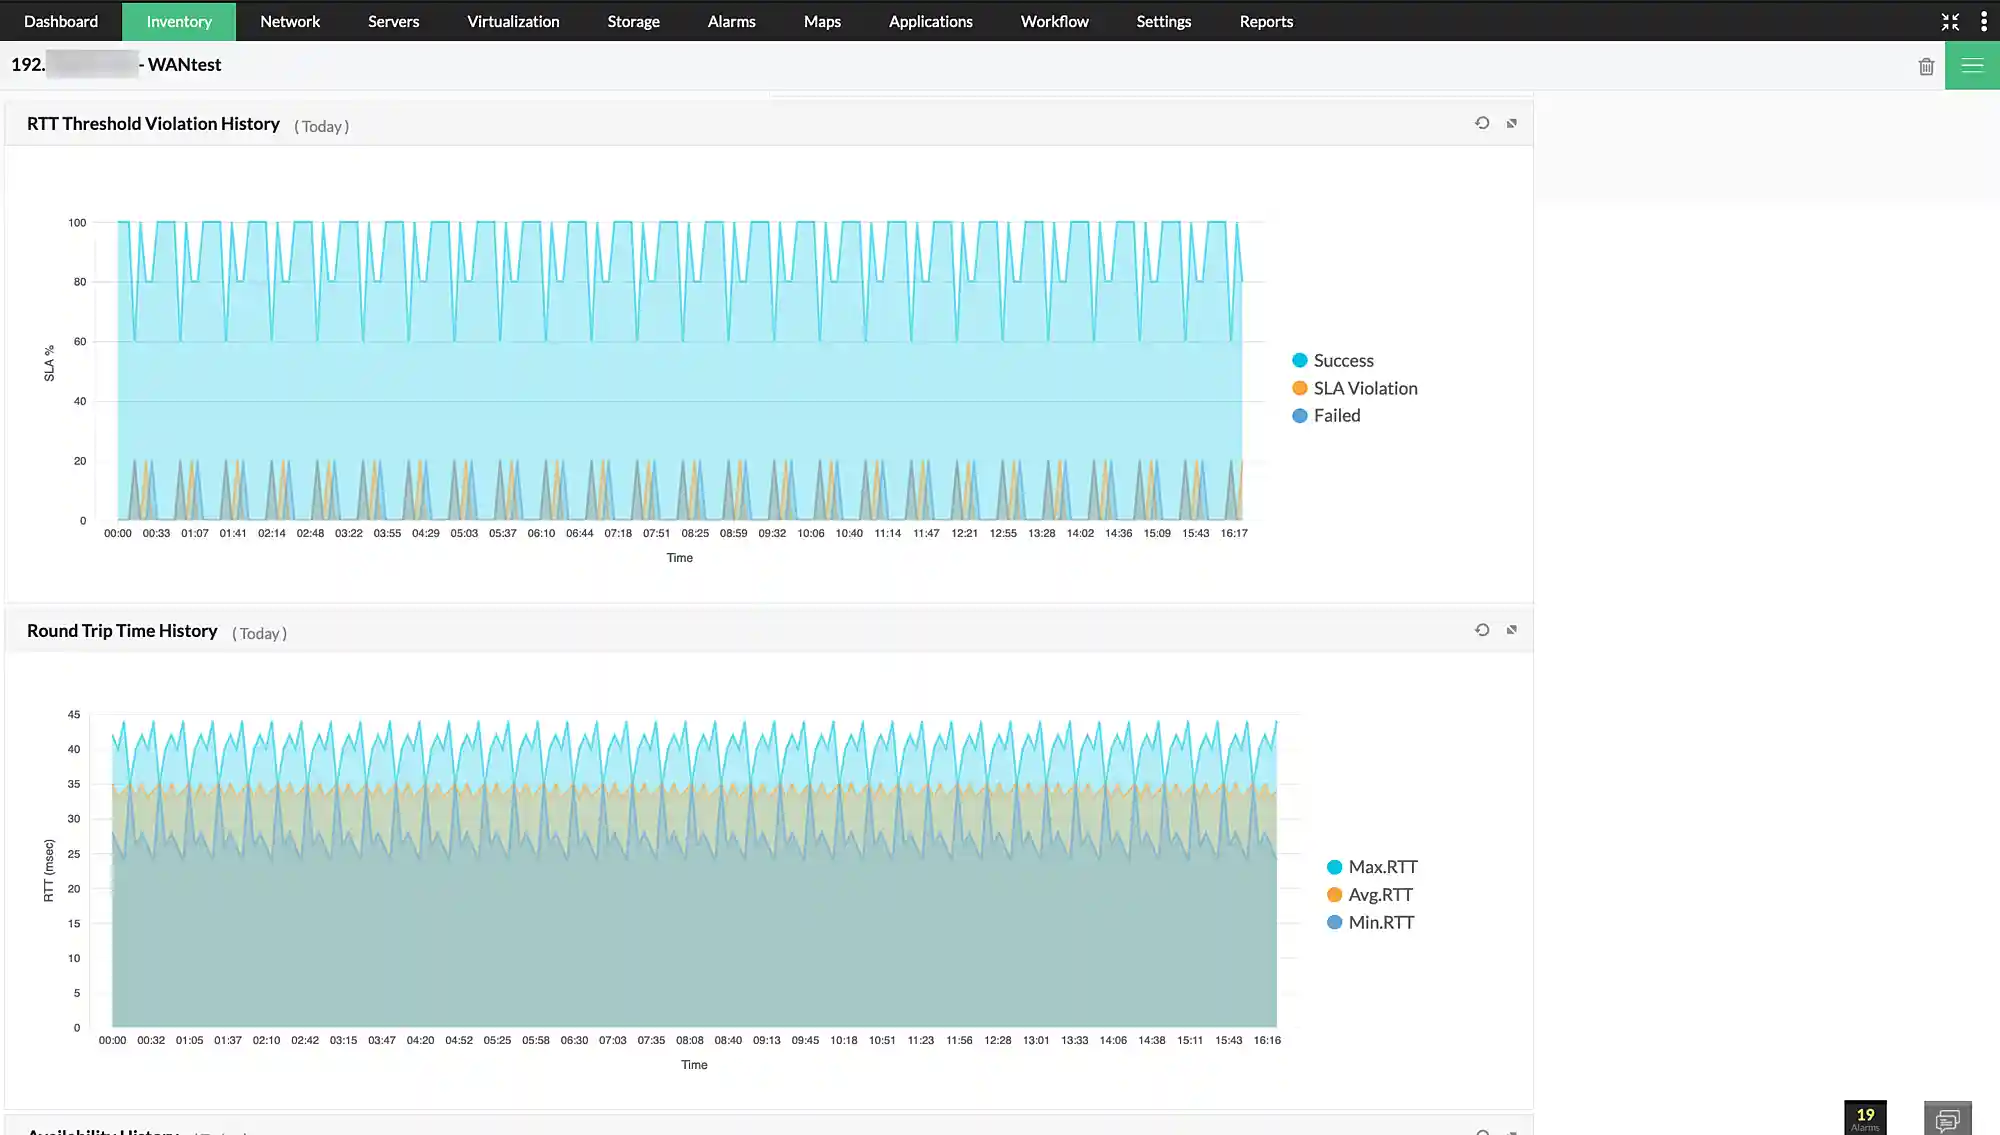
Monitoring WAN links
Discover and add WAN up links connected to your edge routers, classify them based on their sites and ISP providers, and track their uptime status.
- Configure ISP SLA parameters to monitor WAN round trip time (WAN RTT) and availability to get instant alerts for SLA violations.
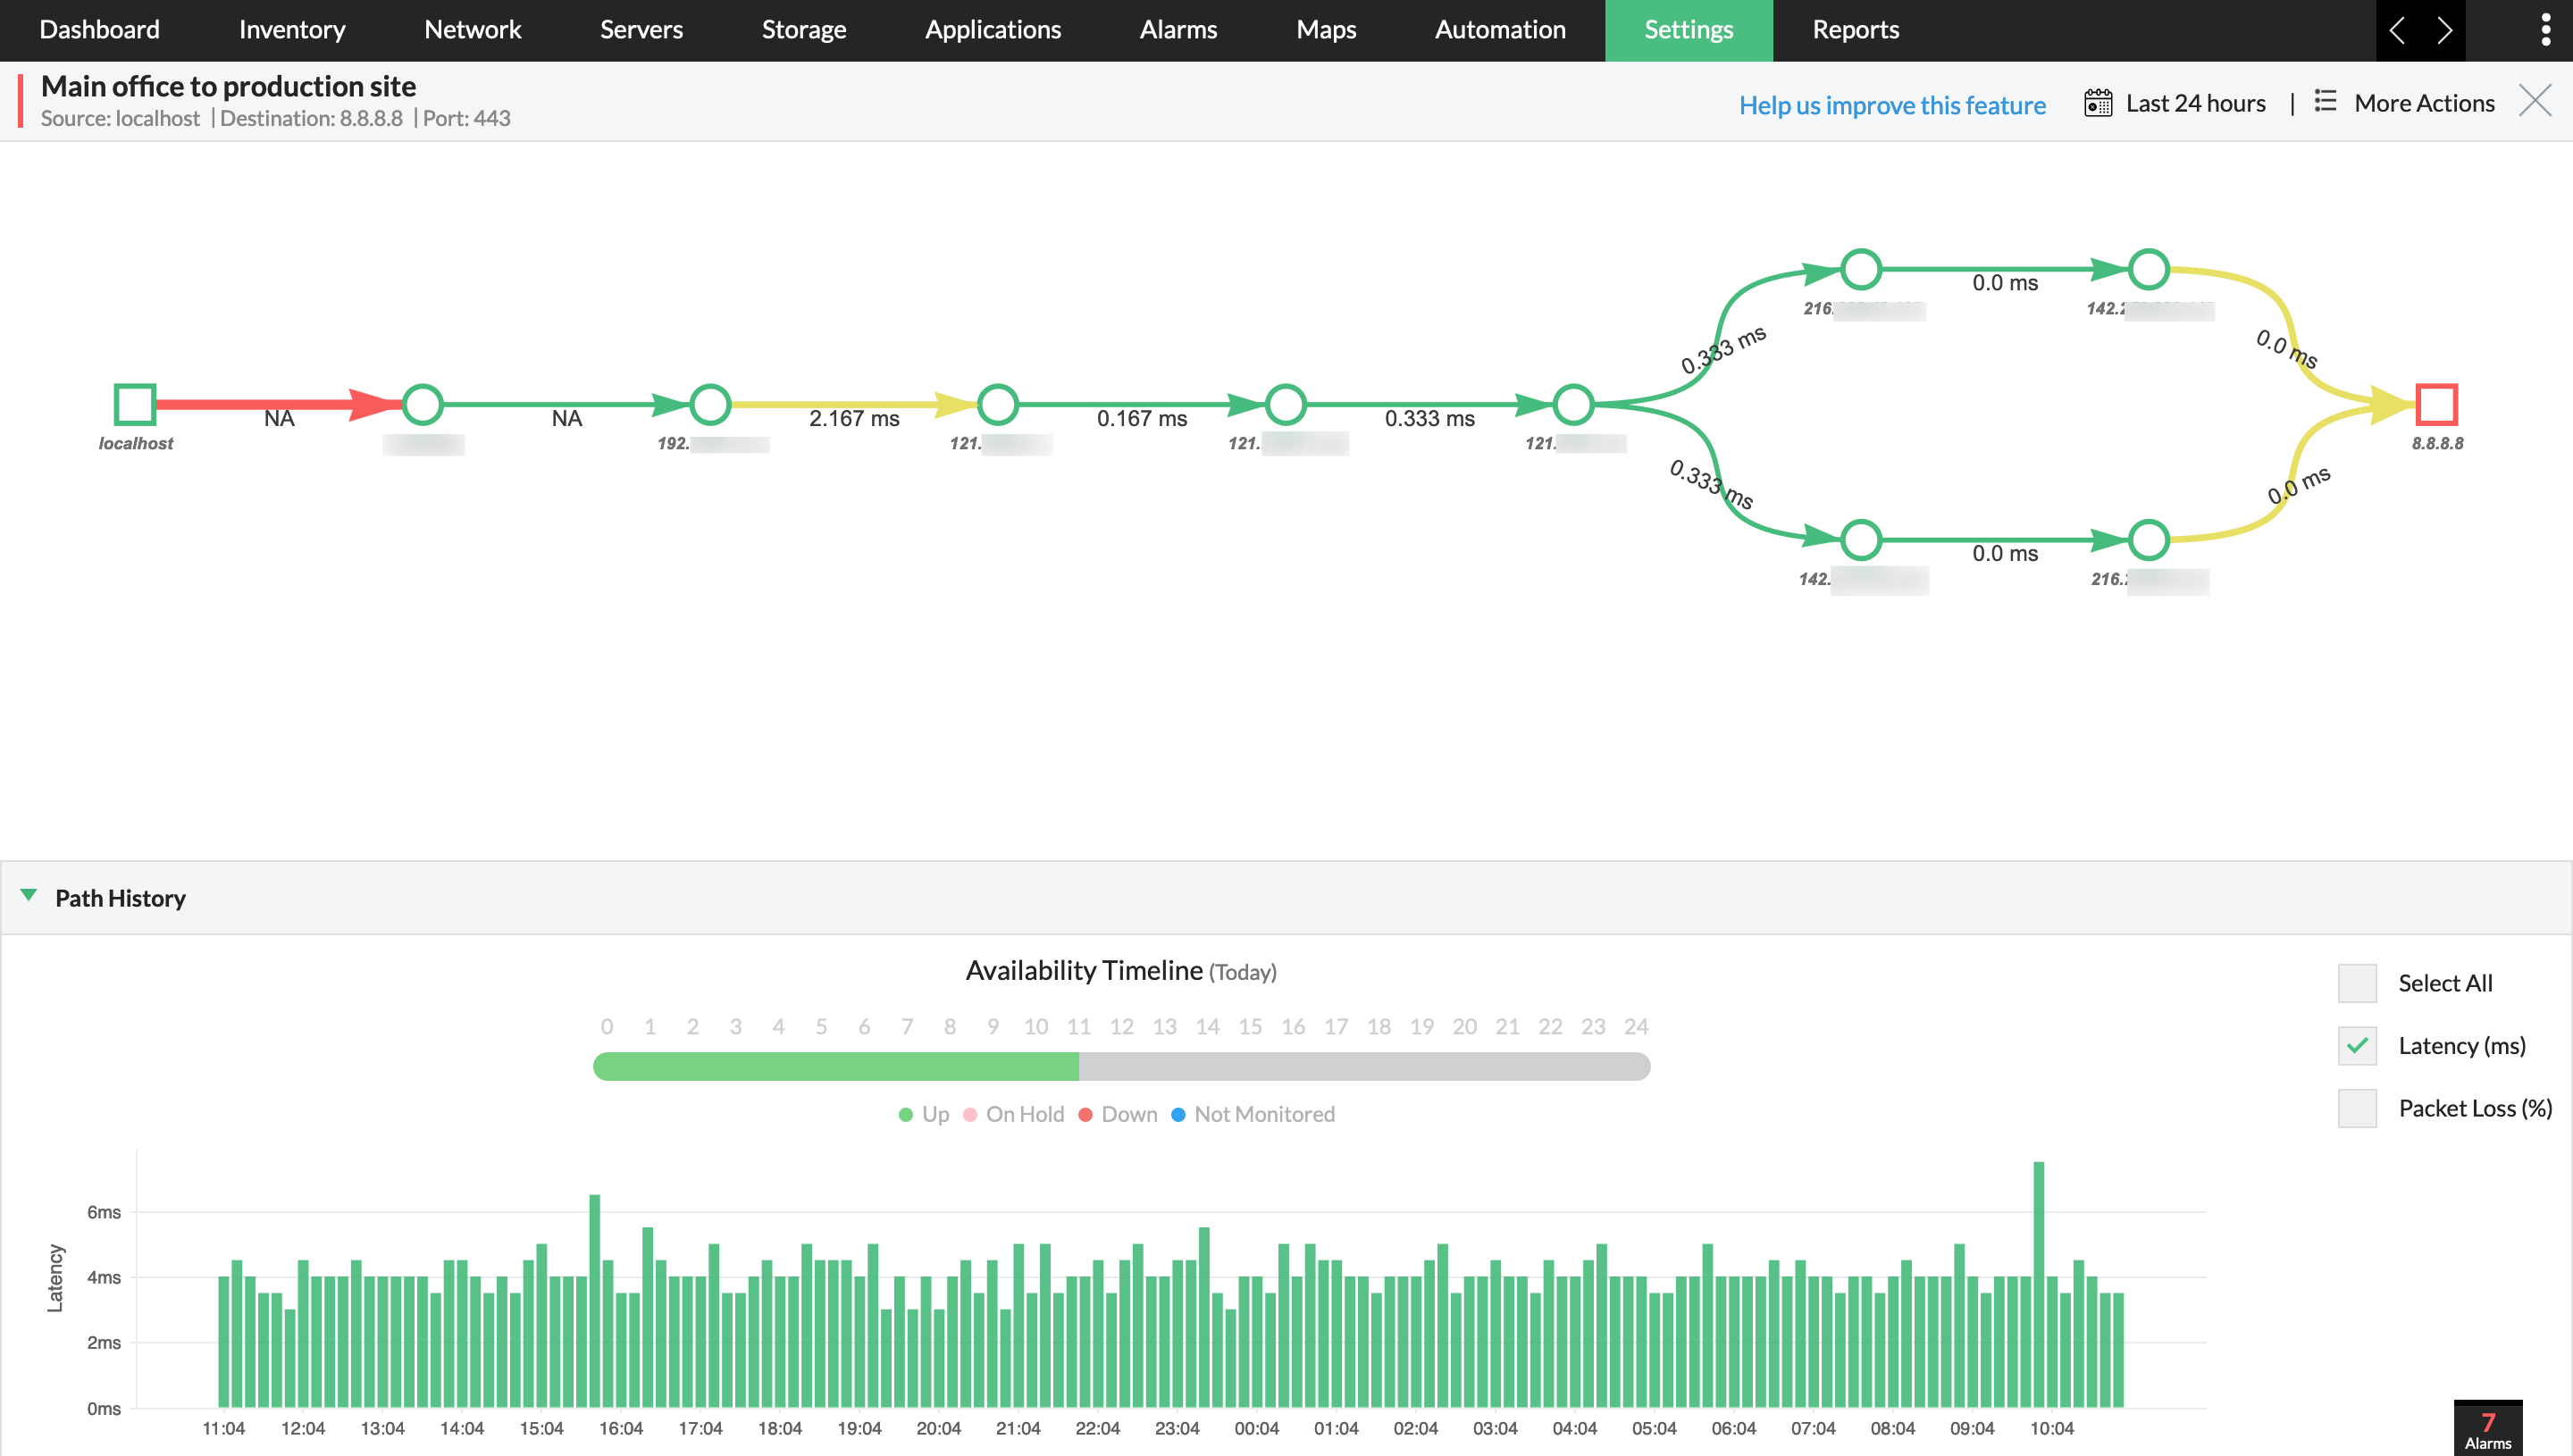
- Track the latency and response time for each hop in a WAN link using network path analysis profiles.
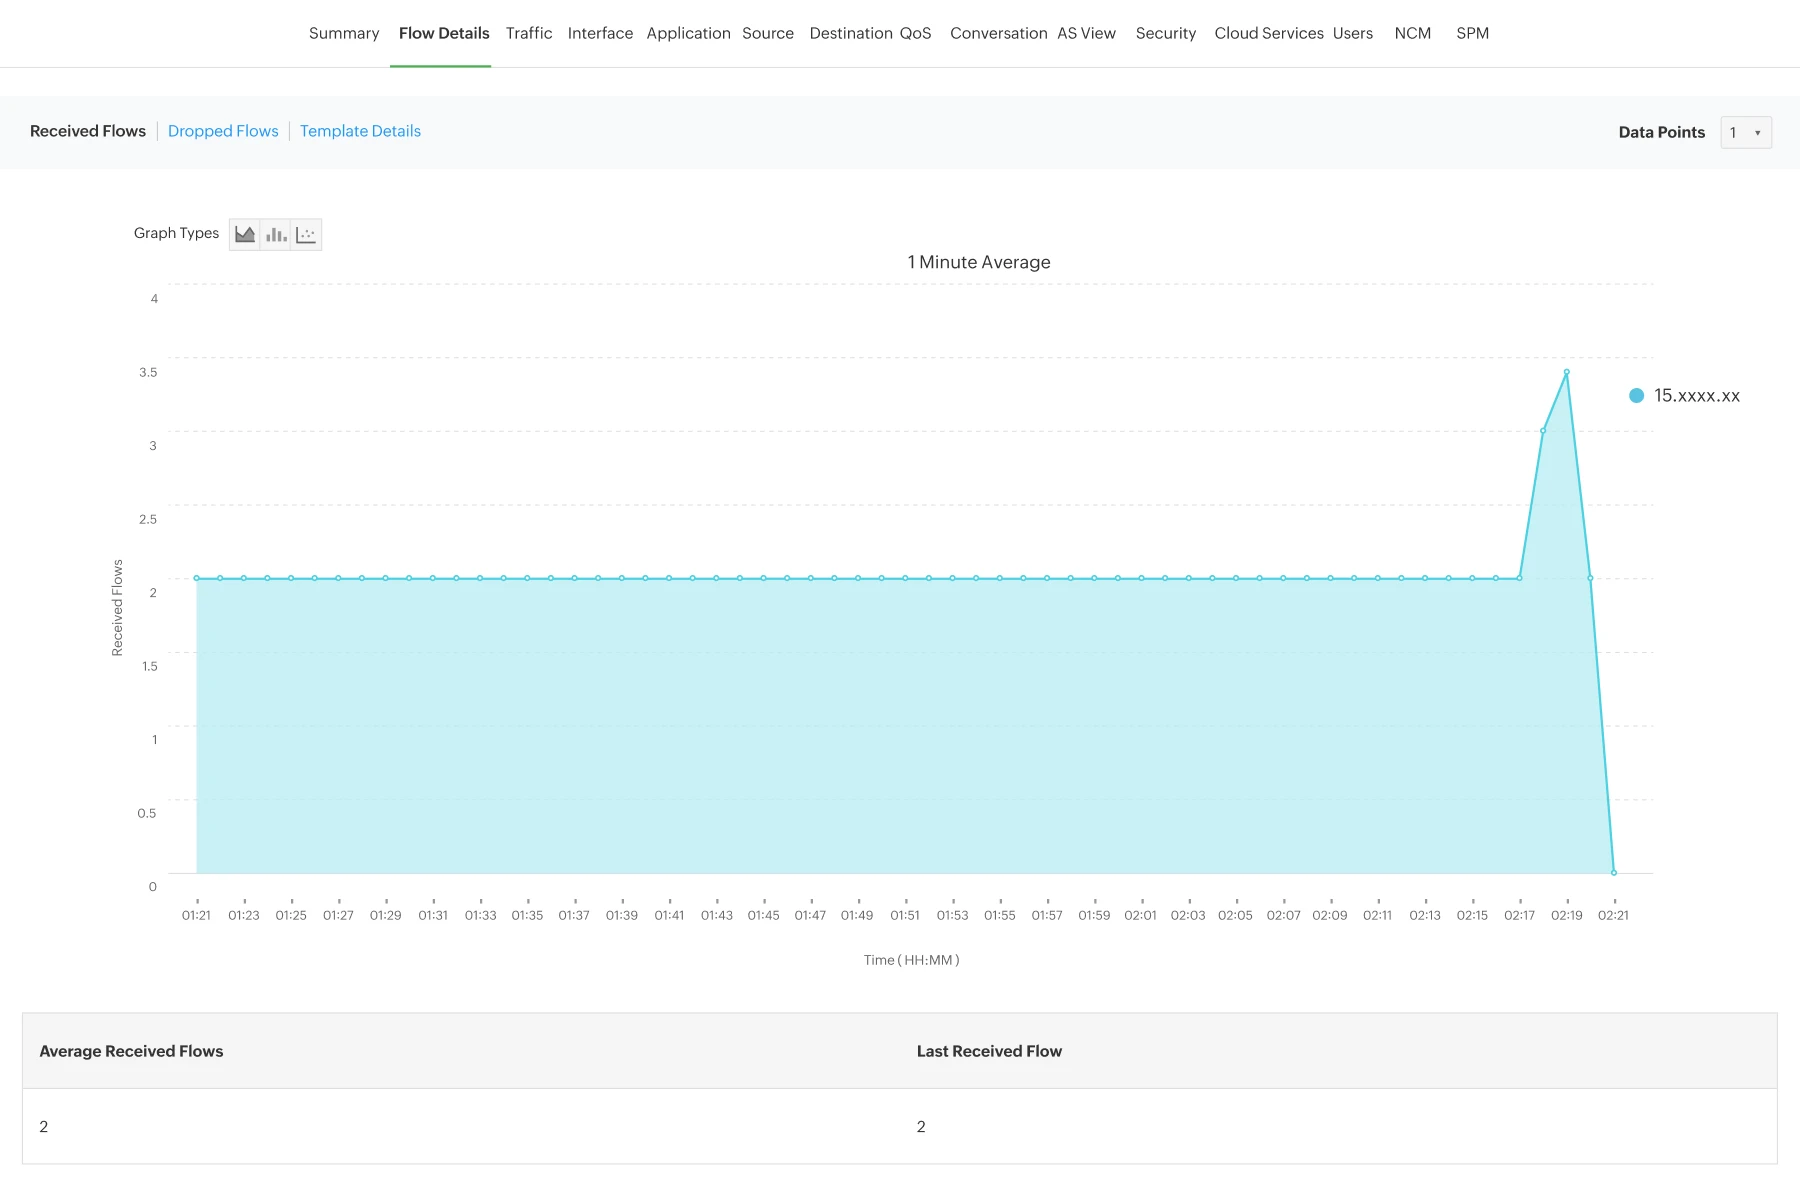
Traffic and config management
- OpManager's NeFlow analyzer add-on helps you get in-depth visibility into traffic usage from your routers at the interface, user, and app level with flow technologies like: NetFlow, sFlow, IPFIX, Netstream, J-Flow, and AppFlow.
- OpManager's Network Configuration Manager add-ons gives you complete control over your network configurations and changes at the router level to ensure business continuity and compliance.
How OpManager's router monitoring helps IT teams
Network stability with zero IT overhead
Monitor router health and availability automatically, delivering the proactive alerts and simple management your lean team needs to prevent costly business disruptions.
- Auto-discovery for multi-vendor IT: Automatically scan, identify, and onboard remote or small-office routers via SNMP and ICMP in minutes.
- SMS and email alerts for downtime detection: Configure real-time, contextual notifications that instantly alert off-site administrators or business owners the moment an internet connection drops or a core edge router goes offline.
- Hardware temperature and CPU health tracking: Monitor critical physical metrics like internal temperature and CPU load to catch hardware degradation early, allowing you to schedule maintenance before a sudden device failure halts daily operations.
WAN efficiency and SLA enforcement
Track branch-to-branch latency and bandwidth consumption across multiple ISPs, providing the granular traffic visibility your growing business demands to maintain peak application performance.
- IP SLA and WAN RTT monitoring: Group your edge routers by site and service provider to track WAN Round Trip Time (RTT), ensuring your ISPs meet their contractual obligations while instantly flagging SLA violations.
- Traffic visibility down to the interface, user, and application level: Leverage built-in NetFlow and sFlow technologies to pinpoint exactly who or what is causing unexpected bandwidth spikes, allowing you to optimize capacity and eliminate network congestion.
- Multi-vendor performance monitoring: Seamlessly manage a mixed network environment of Cisco, Aruba, and Fortinet devices with automated, ML-driven thresholds that dynamically adjust to your traffic patterns.
Network resilience and predictive AIOps
Isolate complex distributed faults instantly and optimize global infrastructure scaling, leveraging the intelligent automation your enterprise requires to maintain 24/7 business continuity.
- AI-driven event correlation: Sift through thousands of concurrent network events across distributed data centers, automatically filtering out background noise to get actionable alerts that pinpoints the real root cause.
- Network path analysis for the entire WAN: Map out the exact path your data takes through the network, visually isolating the specific node, internal device, or external provider where traffic drops or high latency occurs.
- Predictive resource capacity planning: Analyze months of historical CPU, memory, and bandwidth utilization data to accurately forecast exactly when your core enterprise routers will reach their physical limits, simplifying long-term budgeting.
FAQs on router monitoring
r goes here.
Resources to dig deeper
The technical playbook for deploying agentic AI in production ITOps
From alerts to action: How agentic AI will change your ITOps
Download Whitepaper→