Web Services Monitoring
- Overview
- Creating a new Web Services monitor
- Adding Operations
- Adding Custom Attributes with XSLT input
- Edit Operations
- Monitored Parameters
- Sequential execution of SOAP Operations
Overview
Web Services is an XML-based technology that allow applications to communicate with each other, regardless of the environment, by exchanging messages in a standardized format (XML) via web interfaces (SOAP and WSDL APIs).
ManageEngine Applications Manager provides a flexible approach to manage a Service-Oriented Architecture (SOA) that uses SOAP Web Services. It helps business managers configure SLAs and track high level availablity of the Web Service. Application admins can monitor the performance of these Web Services by configuring Applications Manager to execute 'Operations' published by the Web Service. By specifying the WSDL, a simple wizard helps you configure operations that need to be invoked and gives the ability to specify arguments to the operation. In addition to this, there is out-of-the-box support for configuring thresholds on individual operation execution times and user-defined XSLT parameters.
Creating a new Web Services monitor
Prerequisites for monitoring Web Services metrics: Click here
Using the REST API to add a new Web Services monitor: Click here
To create a Web Services monitor, follow the steps given below:
- Click on New Monitor link. Choose Web Services.
- Enter the WSDL URL of the document that describes the web services operations, input and output messages, and protocols.
- Specify the Endpoint Address of the Web Service operation, which is the URL that defines the location of the web service and the associated parameters required to invoke a specific operation.
- Enter the polling interval time in minutes.
- Enter the Timeout.
- Give the User Name and Password, if it is required to invoke thewebservice operation.
- Add a Header. You can use our pre-defined headers or create your own custom headers to invoke operations. Use '#' to seperate multiple headers. Use ':' to separate individual keys and values. For Example, Content-Type:text/application+xop;charset=UTF-9#Pragma:no-cache
- Specify the Authentication Token for extracting a specific value from the SOAP Response for sequential execution. The token is of the format <OperationName>_SEP_<TagToBeExtracted>.
- Enable the Is RESTful checkbox if the web service supports RESTful API.
- If you are adding a new monitor from an Central Server, select a Probe Server.
- Choose the Monitor Group from the combo box with which you want to associate Web Services Monitor (optional). You can choose multiple groups to associate your monitor.
- Click Add Monitor(s).
If you have added Monitors and not associated them with a Monitor Group, you can do this manually anytime. For information on associating a Monitor with a Monitor Group, refer to Associating Monitor with Monitor Groups topic.
Note: If you want to access Web Services through Proxy, go to Settings → Configure Proxy Settings → Check if Proxy is configured, else configure the same. For hosts that don't require Proxy, add them to the No Proxy list.
Adding Operations
You can add Operations to the Web Service for monitoring. Operations are abstract descriptions of actions supported by the service.
Follow the steps given below to add operations:
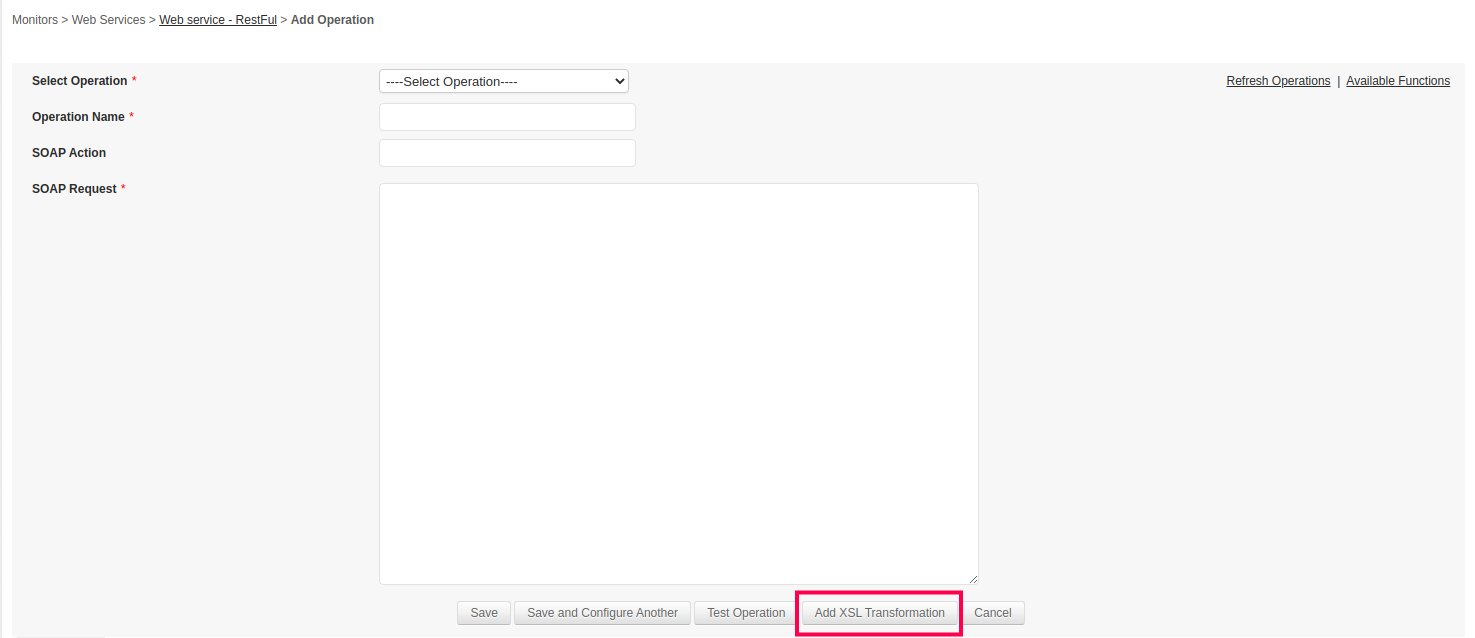
- Click the Add Operation link present on the right-hand side of the web services monitor screen. This displays the Add Operation screen.
- The operations configured in the web service will be listed in the Select Operation drop-down list box. You can either choose any of these operations or choose custom operation.
- If you select a pre-configured operation, the SOAP Action and SOAP Request values for the operation will be automatically displayed. Replace the '?' in the SOAP request with your input value. The Operation Name has to be specified for pre-defined operations too.
- If you choose the custom operation, you have to specify the Operation Name, SOAP Action and SOAP Request values.
- Click Add XSL Transformation to transform the SOAP Response and collect specific metrics from the SOAP Response. Learn how to add XSLT segment
- You can use the Test Operation option to check the output before adding the operation for monitoring.
- Click Save button to add the operation. Click Save and Configure Another button to add the operation and configure another operation.
The Operations thus added, will be listed in the details page under the Operation Statistics section. In this section, you can view the details of the operation such as Operation Name, SOAP Request, SOAP Response, status and execution time. Applications Manager provides a link in the Alert Email for SOAP Action, to view the SOAP response for the specific operation. You can also configure thresholds and alarms for all the operations.
The Web Service Functions are used to give dynamic input for each SOAP Request. You have to replace the input value with the function specified in the above format.
| Function | Description | Usage |
|---|---|---|
| ${random(MinValue,MaxValue)} | This function will generate Random numbers as input. | ${random(100,1000)} This will generate a random number between 100 and 1000 E.g. 446. |
| ${time(TimeFormat)} | This method will generate current date and time as input. You can specify your own Date and Time Format. | ${time(yyyy-MM-dd(HH:mm:SSS))} This will generate the date and time in this format2015-09-21(16:49:717). |
| ${time(TimeFormat)#(1d,-1y)} | This method will generate custom year,date and time as input. You can specify your own Date and Time Format. | ${time(yyyy-MM-dd(HH:mm:SSS))#(5d,2m,-1y)} This will generate the date and time in this format2014-11-26(16:49:717). |
| ${passAuthToken(authtoken)} | This method will replace token/access key which is already derived from SOAP Response mentioned in ''Authentication Token''. | ${passAuthToken(authtoken)} This will generate token node in this format<LogOnToken>${passAuthToken(authtoken)}</LogOnToken>. Tag name <LogOnToken> is just an example, it could be anything actually. |
| ${nonce()} | This method will generate a random base64 encoded,16-byte nonce value. | ${nonce()} This will generate a random base64 encoded,16-byte nonce value to prevent request duplication. Ex : NGMzb05BeHF6V1dHNTNuNQ== |
Adding Custom Attributes with XSLT input
Applications Manager allows you to use XSLT input to extract specific values from SOAP responses and create custom monitoring attributes. This helps you track additional data returned by web service operations that may not be available as default metrics. By applying XSLT to a SOAP operation, you can parse the response, generate new attributes, and monitor them along with other metrics. These attributes can also be viewed in the monitor and enabled for reporting to analyze their performance over time.
The following sections explain how to apply XSLT to SOAP operations, add XSLT input to existing operations, view the created attributes, and enable reports for them.
How to use XSLT for a particular SOAP Operation?
After clicking Add Operation link, the user can define specific values to be monitored for a particular SOAP operation using the XSL transformation in the SOAP Request tab. When adding a particular operation, click Add XSL Transformation button and define the attributes to be monitored in the following format:
Syntax
<?xml version="1.0" encoding="UTF-8"?> <xsl:stylesheet version="1.0" xmlns:xsl="http://www.w3.org/1999/XSL/Transform"> xmlns:soap="http://schemas.xmlsoap.org/soap/envelope/" xmlns:m="<Endpoint_Method_URL>" <xsl:output method="text"/> <xsl:template match="/"> attributename:<Path to fetch the attribute> </xsl:template> </xsl:stylesheet>
To define specific attributes to be monitored, ensure that the following criterias are met:
The output method should be of type 'text'.
<xsl:output method="text"/>
The final output of the path to fetch the attribute should be in key-value pairs of the format attributeName:attributeValue.
Example: To add an attribute for checking the days, make sure that the XSLT output is of the format Days:<xsl:value-of select="days"/> would create an attribute 'Days' whose value will be the value of the <days> tag present in the SOAP response.
- In case of multiple attributes, the entries should be separated by using new line as the delimiter.
Upon clicking the Update button, the defined attributes will be fetched and monitored along with their corresponsing values in the table under the SOAP Response tab, which can then be used to configure alarms, thresholds, actions, and generate reports as well. However, reports cannot be generated if the attributes monitored is of String format.
The keys should be unique within a particular SOAP Operation. They can be duplicated across operations.
Example
Let us consider the following SOAP Request of XML format which will be shown in the SOAP Request tab:
<?xml version="1.0" encoding="UTF-8"?> <soapenv:Envelope xmlns:soapenv="http://schemas.xmlsoap.org/soap/envelope/" xmlns:xs="http://webservice.domainname.com/temperature"> <soapenv:Body> <xs:CelsiusToFahrenheit> <xs:nCelsius>?</xs:nCelsius> </xs:CelsiusToFahrenheit> </soapenv:Body> </soapenv:Envelope>
Following is the SOAP Response of XML format which will be shown in the SOAP Response tab for the above SOAP Request:
<?xml version="1.0" encoding="utf-8" standalone="no"?><soap:Envelope xmlns:soap="http://schemas.xmlsoap.org/soap/envelope/"> <soap:Body> <m:CelsiusToFahrenheitResponse xmlns:m="http://webservices.daehosting.com/temperature"> <m:CelsiusToFahrenheitResult>32</m:CelsiusToFahrenheitResult> </m:CelsiusToFahrenheitResponse> </soap:Body></soap:Envelope>
Let's say you want to monitor the result of the CelsiusToFahrenheit operation from the SOAP Request. To do so, click on Add XSL Transformation and define the attributes in the following format:
<?xml version="1.0" encoding="ISO-8859-1"?> <xsl:stylesheet version="1.0" xmlns:soap="http://schemas.xmlsoap.org/soap/envelope/" xmlns:m="http://webservice.domainname.com/temperature" xmlns:xsl="http://www.w3.org/1999/XSL/Transform"> <xsl:output method="text"/> <xsl:template match="/"> Result:<xsl:value-of select="soap:Envelope/soap:Body/m:CelsiusToFahrenheitResponse/m:CelsiusToFahrenheitResult"/> </xsl:template> </xsl:stylesheet>
where,
- <xsl:output method="text"/> refers to the output method of XSLT.
- <xsl:template match="/"> refers to select complete XML
- Result:<xsl:value-of select="soap:Envelope/soap:Body/m:CelsiusToFahrenheitResponse/m:CelsiusToFahrenheitResult"/>refers to the path to fetch the attribute, in which,
- Result is the name we are giving for the attribute.
- soap:Envelope/soap:Body is used to traverse throught the nodes. Here we are selecting body node which is inside of Envelope node.
- m:CelsiusToFahrenheitResponse/m:CelsiusToFahrenheitResult is used to select the attribute from the node. Here we are selecting CelsiusToFahrenheitResult attribute from CelsiusToFahrenheitResponse node.
Similarly, to fetch CelsiusToFahrenheitResponse node value, we can define as soap:Envelope/soap:Body/m:CelsiusToFahrenheitResponse in the path which will fetch the response node value.
Upon clicking Update, the attribute Result will be monitored along with the value of the CelsiusToFahrenheit operation in the table under the SOAP Response tab, which can then be used to configure alarms, thresholds, actions, and generate reports as well.
How to add XSLT input to existing operations?
- Click Manage operations present in the Operation Statistics table, then select edit and add the necessary changes. Click Update.
- Click on the operation details. Select the SOAP Request tab and add the changes and click Update.
Where to view the attributes created using XSLT ?
Under the Operation Statistics table, select the operation for which you wish to view the XSLT data. This opens the SOAP Response tab under which the attributes are listed in a tabular format with functionality to add thresholds and view reports. For numeric data, the graphic data is displayed after the table.
How do I enable reports for the attributes?
- Go to the Reports tab and select Enable reports.
- Select Web Services type
- Check the attributes for which you wish to generate reports.
- Click Update. Wait for data archival to occur to view the reports.
Edit Operations
Click the Manage Operation link under the Operation Statistics section to go to the 'Manage Operation' page. In this page, click the edit icon to edit the Operation Display name as well as the Arguments including SOAP Action and SOAP Request values.
Learn how to add custom attributes with XSLT input
Monitored Parameters
- Availability tab gives the availability history for the past 24 hours or 30 days.
- Performance tab gives the Health Status and events for the past 24 hours or 30 days.
- List view enables you to perform bulk admin configurations.
Following are the metrics monitored in Web server monitor:
| Parameter | Description |
|---|---|
| WSDL Response Time | |
| Response Time | Time taken obtain a response from the web service (in milliseconds). |
| Operation Statistics | |
| Operation Name | Name of the operation performed. |
| Execution Time | Time taken for the operation to be executed (in milliseconds). |
Sequential execution of SOAP Operations:
Create a sequence of SOAP Operations wherein the output obtained from one SOAP Response is used as the input for the next SOAP Request. To do so, follow the steps given below:
- During monitor creation, provide the Authentication token for extracting a specific value from the SOAP Response. The token is of the format <OperationName>_SEP_<TagToBeExtracted>
- For example, the SOAP Operation GetCitiesByCountry returns the list of cities present in a particular country. Each city is specified within <City> tag in the SOAP Response. To extract the first city from the SOAP Response, the Authentication token would be GetCitiesByCountry_SEP_City.
After monitor creation, add the operations. For the operations where the input is taken from the response of another operation, call the function passAuthToken.
Syntax: ${passAuthToken(authtoken)}
Example: ${passAuthToken(GetCitiesByCountry_SEP_City)}