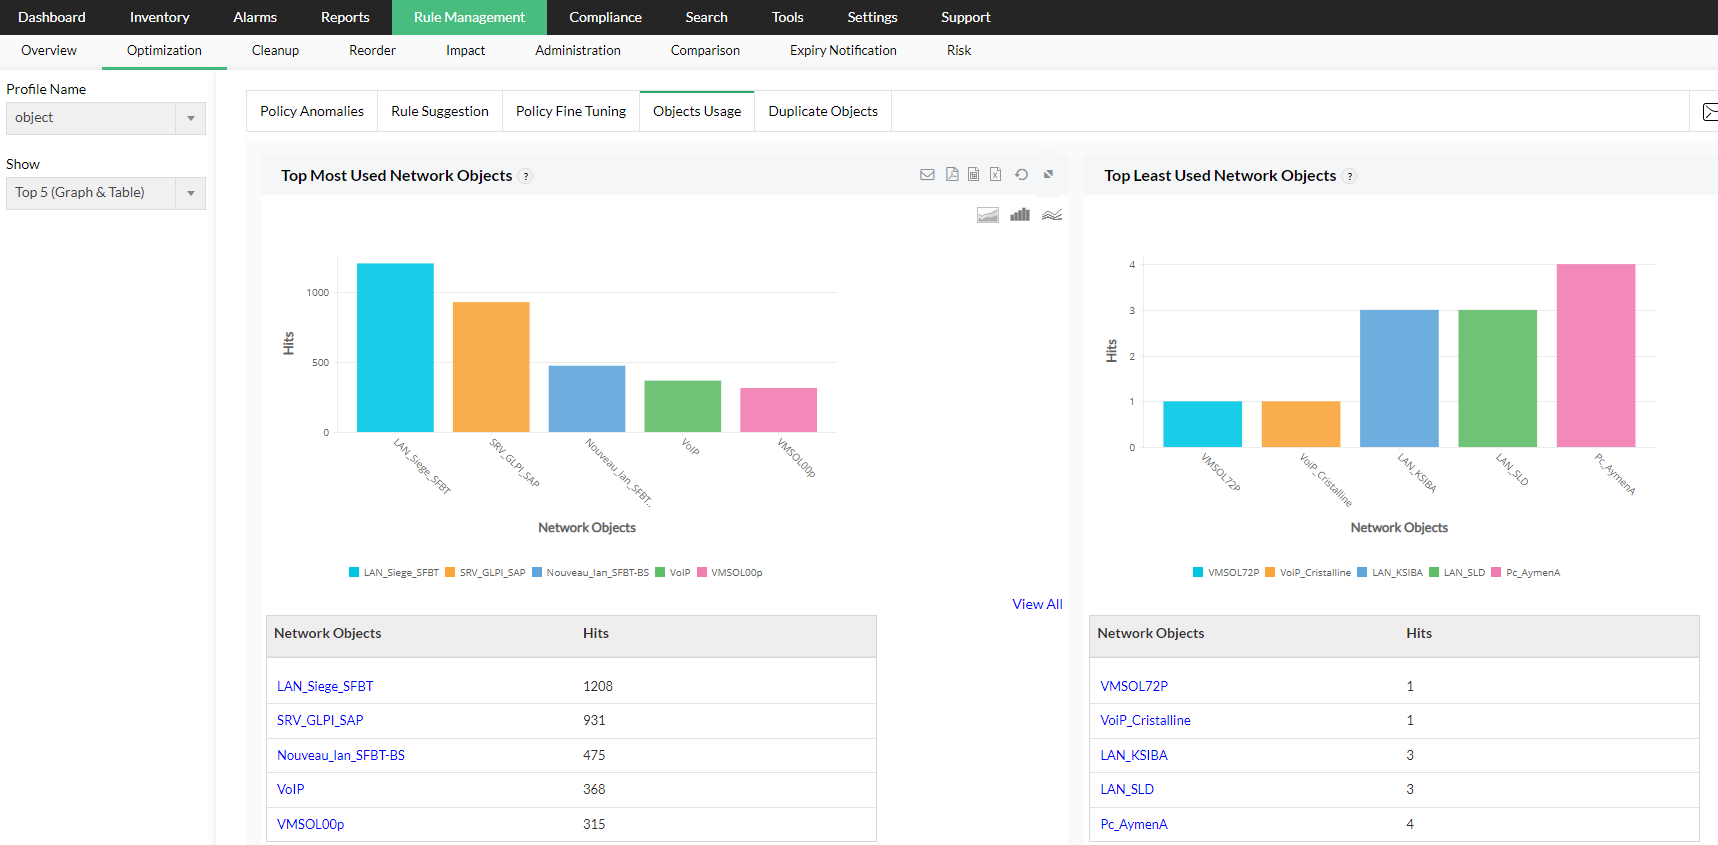
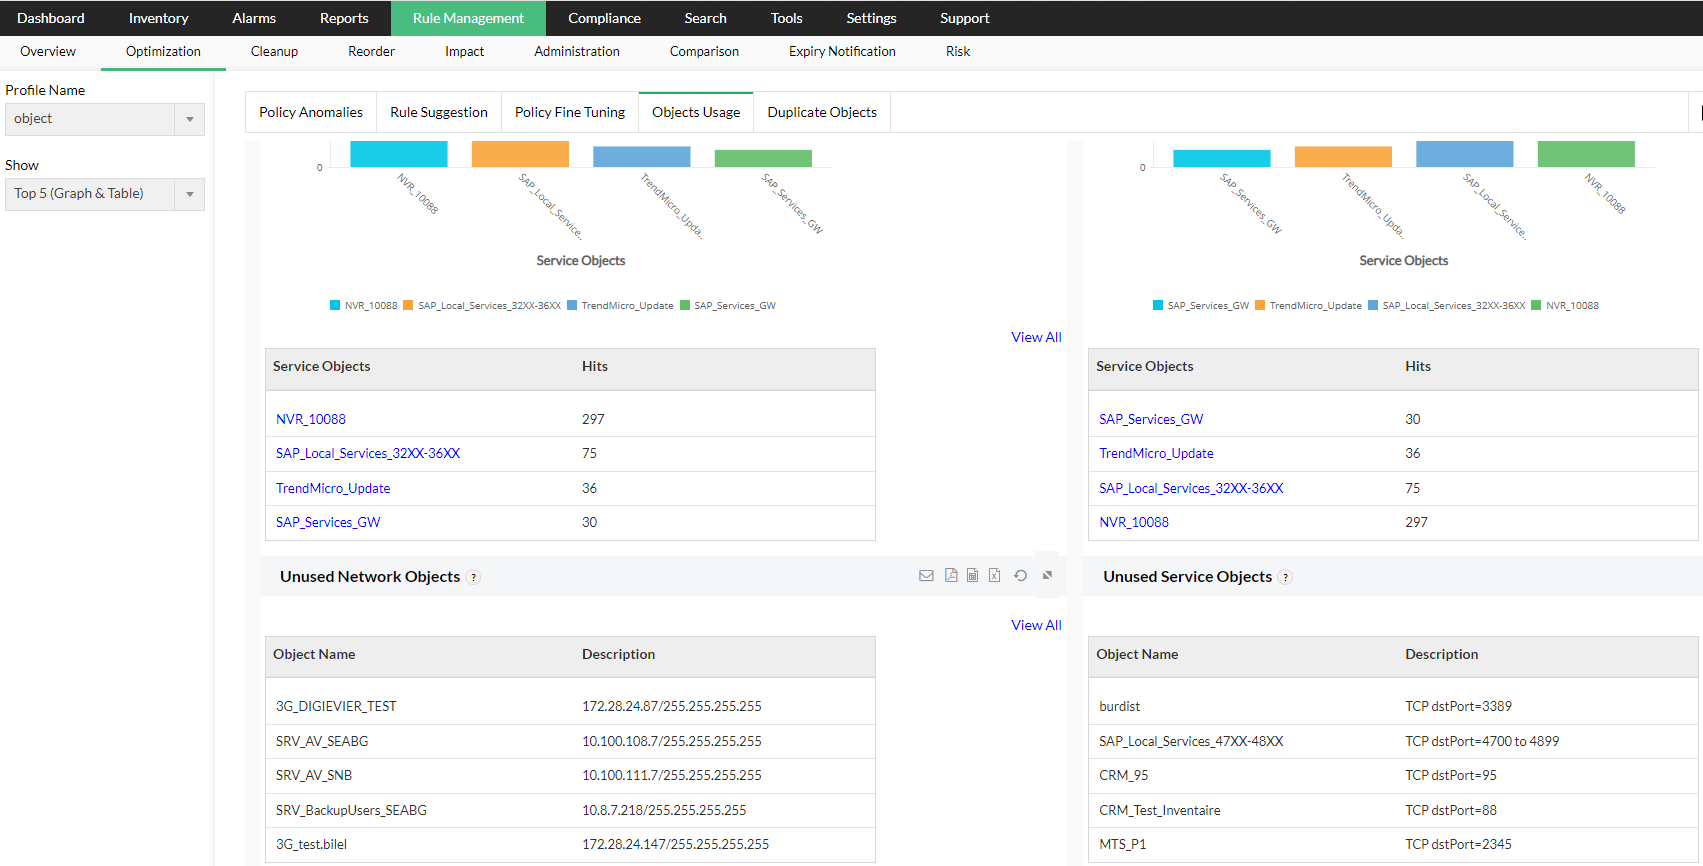
The Objects Usage sub-section in Firewall Analyzer Rule Management > Optimization sub-tab lists all the used and unsed network and service objects.
This feature helps to find out the usage of network and service objects of firewall. The result is derived by monitoring syslog data.
In this section, the most, least used network and service objects with hit counts are listed. The unused network and service objects are listed. Select the Device on the left side and click the Report profile in the table. On the left side there is a drop down list to select the number of objects to be displayed. For 5 and 10 objects the report displays graph and table is displayed and for 15, 20, 50, 100 only table is displayed. The following details are displayed.
The Top Most Used Network Objects and Top Most Used Network Objects tables and graphs are displayed in this section. The details are Network Objects and Hits.
Network Objects

Service Objects
The details in this report are Service Objects and Hits.

Click on the objects to view the details of the objects.
Refer the Rule Management Report Support page, for the list of firewall devices.
Thank you for your feedback!