Creating Geo Maps
Once your location data is ready, you can turn it into a Geo Map in Analytics Plus. Analytics Plus provides eight map types that help IT teams locate infrastructure, compare operational metrics across regions, understand the composition of incidents or assets by location, and identify geographical concentrations of outages or service demand.
This page explains how to build each supported map type and how to plot coordinates, airport codes, custom images, spatial data, and multiple layers. If your location column does not have a geo data type, start with Preparing Geo Data.
The examples use IT operations data covering sites, assets, incidents, outages, and service availability.
- Shelves used in Geo Maps
- Map - Scatter
- Cluster Map
- Map - Hexbin
- Map - Bubble
- Map - Pie
- Map - Bubble Pie
- Map - Filled
- Geo Heat Map
- Map layers
- Maps using latitude and longitude
- Maps using airport codes
- Map projections and country-specific maps
- Maps with an image background
- Maps from spatial data
- Interact with Geo Maps
- Frequently asked questions
Shelves used in Geo Maps
| Shelf | What to add |
|---|---|
| X-Axis | The geo column, such as Country, State, City, or Site. For coordinate maps, add Latitude or Longitude. |
| Y-Axis | The other coordinate column when creating a map using latitude and longitude. |
| Color | A measure or dimension that determines the color of points, regions, or pie slices. Cluster Map requires a measure. |
| Size | A measure that determines the size of bubbles or pies. This shelf is used by Map - Bubble and Map - Bubble Pie. |
| Text | A column whose values should appear as text on the map. |
| Include Columns for Tooltip | Additional columns to display when users hover over a location. |
To build a map, open the chart designer and drag the required columns to the shelves. Select the Map Chart icon in the chart-type toolbar, or select Other Charts to view the available map types.
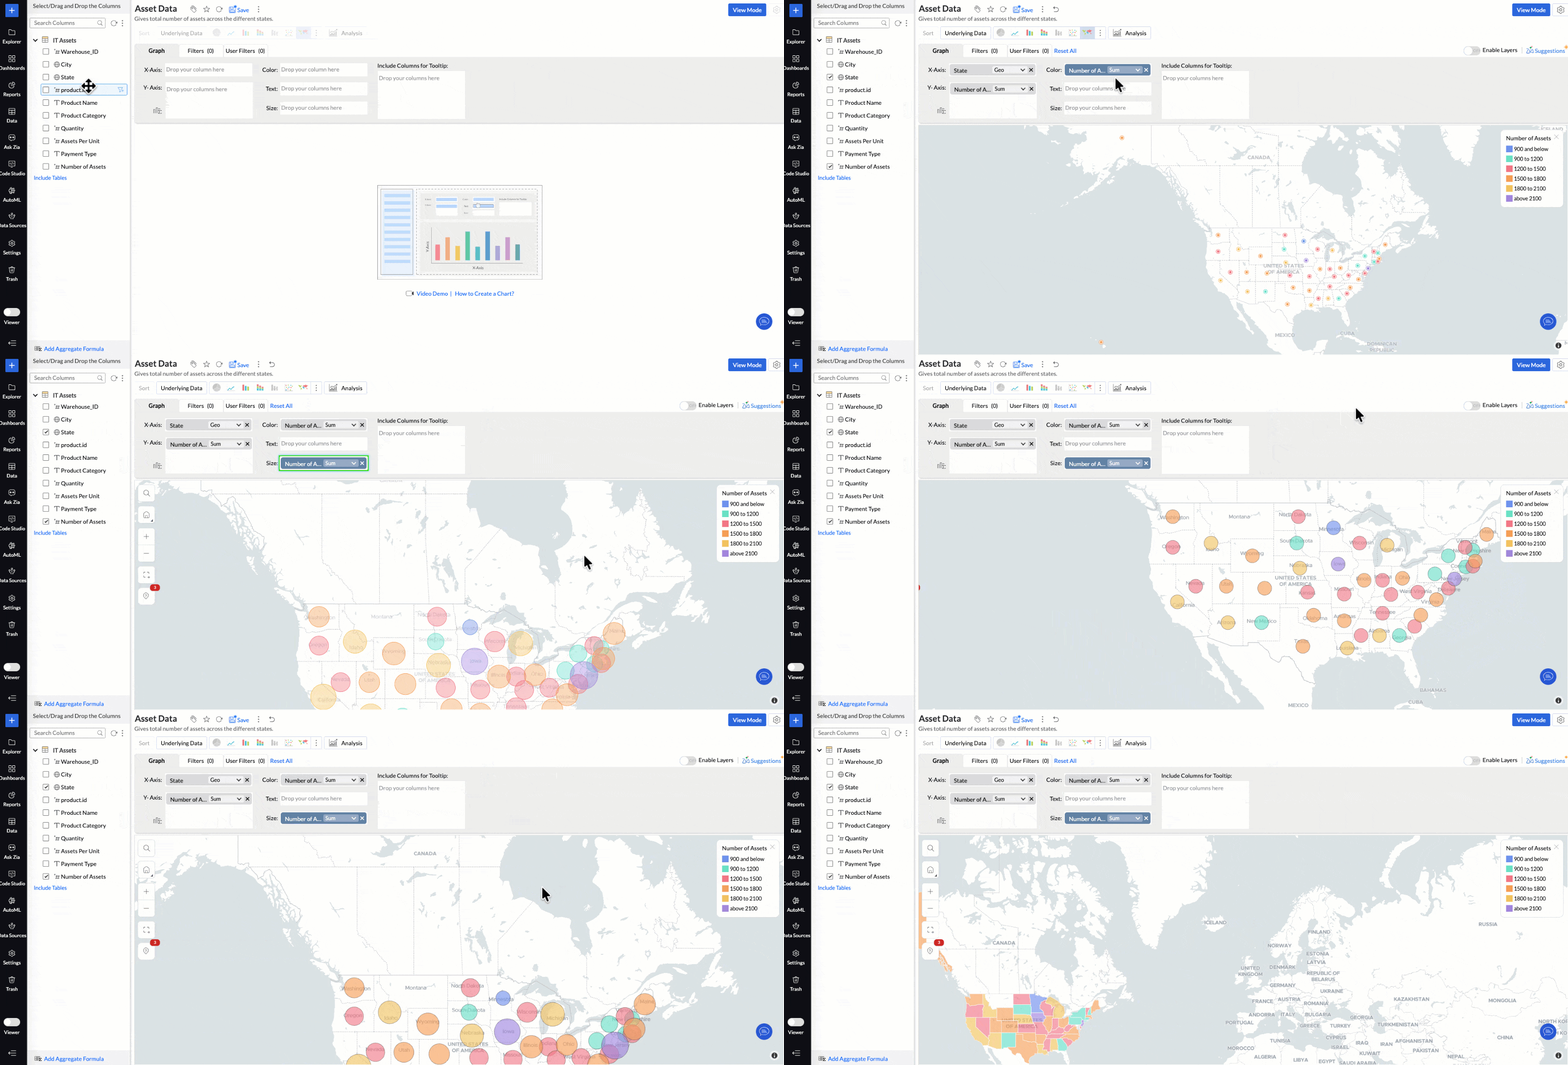
Map - Scatter
Map - Scatter plots each location as an equal-size point at its exact position. Use it when position matters more than magnitude, such as showing offices, data centers, monitored sites, endpoints, or other distributed IT assets.
To build a scatter map showing sites by infrastructure type:
- Drag Longitude to the X-Axis shelf and Latitude to the Y-Axis shelf.
- Drag a dimension such as Infrastructure Type or Site Status to the Color shelf.
- Drag fields such as Site Name, Asset Count, and Availability to Include Columns for Tooltip.
- Select Map - Scatter.
Each site appears as a point colored by its category. To change the point shape, open Settings > Map > Markers. For the complete list of appearance settings, see Customizing Geo Maps.
Cluster Map
Cluster Map groups nearby points into clusters. Each cluster displays the number of points it contains and uses a Low-to-High color gradient. Click a cluster or zoom in to divide it into smaller clusters until individual points appear. Use it when points overlap at a wide zoom level, such as incidents across a region or monitored assets within a city.
To build a clustered map showing the distribution of monitored sites:
- Drag Latitude and Longitude to the X-Axis and Y-Axis shelves. Coordinates provide the most detailed clusters.
- Drag a measure to the Color shelf. For example, use Site ID with the Count function to count sites.
- Select Cluster Map. Bubble clusters are used by default.
- To display Hex clusters, open Settings > Map > Markers and set Cluster Type to Hex.
Note: If the Color shelf is empty when you select Cluster Map, Analytics Plus adds a measure automatically. You can replace it afterward.
How Cluster Map works
- Zoom into a cluster: Select a cluster to zoom in one level. The map centers on the cluster and groups its points again.
- Individual points: At maximum zoom, individual points appear. Their tooltip menu provides interactions such as View Underlying Data, Drill Down, and Drill Through.
- Identical coordinates: Points with exactly the same latitude and longitude remain in one cluster even at maximum zoom. Use View Underlying Data to review their rows.
- Drill Through: Drill Through is available from an individual point at maximum zoom, not from a cluster representing multiple rows.
Map - Hexbin
Map - Hexbin groups points into a fixed grid of equal-size hexagons and colors each cell by its point count or another measure. Unlike clusters, the grid remains fixed as users zoom. Use it to compare the density of large point data sets, such as incidents, security events, device failures, or service requests.
To create a Hexbin map:
- Drag Longitude to the X-Axis shelf and Latitude to the Y-Axis shelf. Hexbin requires a column on both axes.
- Open the function drop-down for either coordinate and select Geo Location > Hexbin. The other axis is configured automatically.
- In the Hexbin dialog, select how the count is determined:
- Auto: Analytics Plus determines the count from the geographical spread and number of points.
- Custom: Use the slider or enter a value. A higher count creates more, smaller cells; a lower count creates fewer, larger cells.
- Click OK. Analytics Plus adds a count to the Color shelf.
- Click Click Here to Generate Graph. The map opens as Map - Hexbin.
Adjust the Hexbin count
Reopen the Hexbin dialog from the function drop-down on either axis, or select Hexbin Count in the map toolbar. The toolbar control lets users adjust density while viewing the map.
- Edit mode: The new value is saved with the report and the setting changes to Custom.
- View mode: The change lasts for the current session and resets when the report reloads. Edit permission is not required.
- Map - Hexbin remains unavailable in the chart-type list until Hexbin is configured on both axes.
- While Hexbin is active, Cluster Map, Image as Markers, Drill Through, and using the report as a filter are unavailable.
- Map - Hexbin does not support the Albers USA or USA Hex Bin projections. USA Hex Bin Projection represents states as hexagons; Map - Hexbin groups the report's data points into hexagonal cells.
Map - Bubble
Map - Bubble places a bubble at each location and sizes it using the measure in the Size shelf. Use it to compare values such as incident volume, downtime, monitored-device count, or service cost across locations.
To build a bubble map comparing incidents by region:
- Drag a geo column such as State or Site to the X-Axis shelf.
- Drag Incident ID to the Color and Size shelves and set its function to Count.
- Add supporting fields such as Critical Incident Count or Average Resolution Time to Include Columns for Tooltip.
- Select Map - Bubble.
Map - Pie
Map - Pie displays a pie at each location, with one slice for every value of the dimension in the Color shelf. Because all pies have the same size, this map compares composition rather than total volume.
To compare the incident-category mix at each support site:
- Drag Site or City to the X-Axis shelf.
- Drag Incident Category to the Color shelf.
- Select Map - Pie.
Note: Keep the dimension in the Color shelf to a small number of values. Pies become difficult to read when they contain too many slices.
Map - Bubble Pie
Map - Bubble Pie combines composition and magnitude. Each location has a pie divided by the dimension in the Color shelf and sized by the measure in the Size shelf. Use it when both the breakdown and the total matter.
To compare incident composition and total incident volume by region:
- Drag State or Site to the X-Axis shelf.
- Drag Incident Category to the Color shelf.
- Drag Incident ID to the Size shelf and set its function to Count.
- Select Map - Bubble Pie.
Map - Filled
Map - Filled shades whole regions, such as countries, states, or counties, using the measure in the Color shelf. Use it to compare geographical areas, such as states with high incident volume, low service availability, or a large concentration of vulnerable assets.
To build a filled map comparing service availability by state:
- Drag State to the X-Axis shelf.
- Drag Service Availability to the Color shelf and select the appropriate aggregate function.
- Add fields such as Asset Count, Outage Duration, and Critical Incident Count to Include Columns for Tooltip.
- Select Map - Filled.
Note: Map - Filled requires region boundaries. Use a location such as Country, State, or County rather than latitude and longitude.
Geo Heat Map
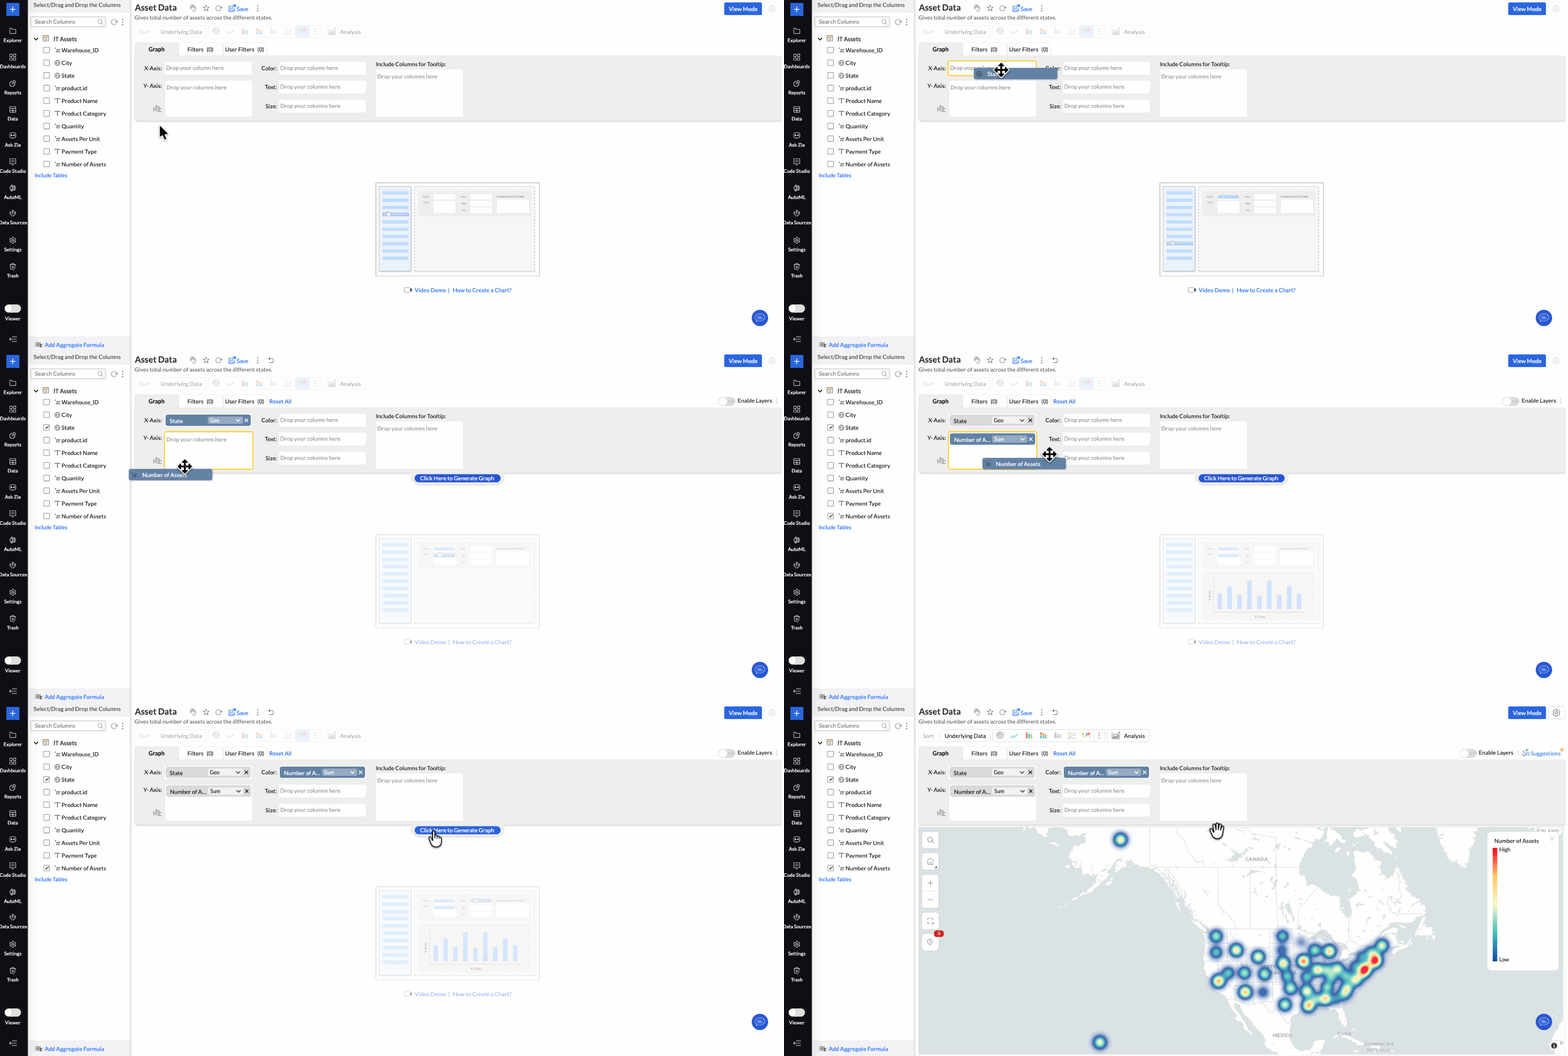
Geo Heat Map converts individual points into a continuous color surface based on their density or value. Use it to identify concentrations that individual markers can hide, such as clusters of incidents, outages, security events, or heavily used services.
To build a heat map showing the concentration of unplanned outages:
- Drag Latitude and Longitude to the X-Axis and Y-Axis shelves.
- Drag Outage Duration to the Color shelf and select the required aggregate function.
- Apply filters when the map should represent only a subset, such as unplanned or critical outages.
- Select Geo Heat Map.
Map layers
Map layers place multiple data sets on one Geo Map, with each layer representing a different KPI or type of geographical information. For example, an infrastructure team can compare regional outage volume with the locations of data centers, monitored devices, and support sites.
Turn on Enable Layers in the chart designer, add a geo column for each layer, and add the measures and dimensions required by those layers. Use the Layer Controls panel to change, show, hide, or lock individual layers.
For detailed procedures, limitations, drill-through configuration, and network charts, see Map Layering.
- While layers are enabled, the overall chart type cannot be changed. Disable Enable Layers before switching the report to another chart type.
- Cluster Map is not supported with Map Layering.
- Map - Hexbin is supported as an individual layer.
Maps using latitude and longitude
Use latitude and longitude when you need exact positions rather than named locations.
- Ensure the coordinate columns have the Latitude and Longitude data types.
- Drag the coordinate columns to the X-Axis and Y-Axis shelves.
- Add the columns you want to analyze to the remaining shelves and select a map type.
Note: The default tooltip does not display coordinate values. Add the Latitude and Longitude columns to Include Columns for Tooltip when users need to see them.
Maps using airport codes
Set the column's data type to Airport, drag it to the X-Axis shelf, and add the measure you want to analyze. Analytics Plus plots each three-letter IATA code at its geographical location. IT teams can use airport locations to analyze connectivity, equipment, support coverage, or service performance across travel hubs.
Map projections and country-specific maps
A projection determines how the earth is represented on a flat map. Analytics Plus provides the following projections:
- Mercator Projection: The default projection for world and country maps.
- Albers USA Projection: Intended for US-focused data and displays Alaska and Hawaii close to the other states. It is not available for Map - Hexbin.
- USA Hex Bin Projection: Displays US states as equal-size hexagons for clearer state-level comparison. It is not available for Map - Hexbin.
For detailed projection settings, see Projections in Customizing Geo Maps.
World maps using the Mercator projection
Use the Mercator projection for global infrastructure or service data. The projection preserves local shapes and directions but stretches areas farther from the equator. Points and bubbles retain their size, while filled regions follow the projected geographical area.
When comparing values across countries, bubble or scatter maps can reduce the visual size bias that large filled regions may introduce.
Country-specific maps
When your data covers only one or a few countries, use a country-specific map to hide unrelated regions and keep the focus on your operational area. A country-specific map is fixed to the selected countries and states. The live world map supports zooming to street level.
- Open Settings > Map > Map Controls.
- Select Display Specific Country Map.
- Select the required projection.
- Select the countries and states to display.
- Country-specific maps do not support Display local language for map labels or Repeat Background.
- When Hexbin is active, only points inside the selected countries are grouped into hexagonal cells.
Maps with an image background
An image map plots data over an uploaded image instead of a geographical map. IT teams can use image maps for a data-center floor plan, campus layout, rack diagram, network topology background, or another operational image where an ordinary map is too coarse.
You can plot two types of values over an image:
- Coordinate values (XY): Positions specific to the image.
- Geo locations: Place names or latitude and longitude values.
If image-specific coordinates are unavailable, they can be generated using a suitable image-annotation tool. Supported image formats are JPEG, JPG, and PNG.
- Drag the X and Y coordinate columns to the X-Axis and Y-Axis shelves.
- If required, use the function drop-down to treat the X column as Longitude and the Y column as Latitude.
- Add the required measures and dimensions to the remaining shelves.
- Open Settings > Map > Map Styles and set Style to Image.
- Upload the image, select the image scale, and enter Image Scale Values that match the coordinate range in the data.
- Configure the aspect ratio, position, and opacity, and save the report.
- Image Scale Values describe the coordinate range of the data, not the image size in pixels. Values outside the range are not plotted.
- Keep the image proportions consistent with the coordinate range and enable Lock Aspect Ratio to keep points aligned.
- If the coordinates and the data being analyzed are in separate tables, join them using a lookup relationship.
Maps from spatial data
After importing a spatial file, drag its Geometry or Custom Geometry column to the X-Axis shelf like any other geo column. Analytics Plus draws the points or shapes contained in the file. See Spatial data files for supported formats, geometry types, and limitations.
Interact with Geo Maps
The map toolbar appears on the map and provides the following options:
- Search: Find a location on the map.
- Home: Return the map to its default view.
- Grab Area: Select and zoom into an area.
- Zoom in and Zoom out: Change the zoom level. Live maps support street-level zoom.
- Hexbin Count: Change the number and size of hexagonal cells. This option appears only when Hexbin is active.
You can also hover over a location to view its tooltip, select a location to drill down or view underlying data, and use legend filters to show or hide a data series.
Frequently asked questions
1. Why can't I see the map chart types?
The location column may still have the Text data type. Change it to the appropriate geo data type, or use Treat as Geo in the chart designer. See Set the geo data type of a column.
2. Which map type should I choose?
- Use Map - Scatter to show exact locations.
- Use Map - Bubble to compare amounts.
- Use Map - Pie or Map - Bubble Pie to compare composition.
- Use Map - Filled to compare regions.
- Use Geo Heat Map to identify concentrations or hotspots.
- Use Cluster Map or Map - Hexbin when many points overlap.
3. Why did adding a measure to the Size shelf not change the map?
Only Map - Bubble and Map - Bubble Pie use the Size shelf. Other map types retain the column but do not use it until you switch to a supported type.
4. Can I use a dimension in the Color shelf for a Cluster Map?
No. Cluster Map requires a measure in the Color shelf. To count points, add a column and apply the Count function.
5. Why do some points remain in one cluster at maximum zoom?
The points have exactly the same latitude and longitude, so Analytics Plus cannot separate them by position. Use View Underlying Data to review every row in the cluster.
6. Why don't points align with the background image?
The Image Scale Values may not match the data's coordinate range, or the image proportions may differ from that range. Enter the correct range and enable Lock Aspect Ratio.
7. Can I plot data from two tables on one map?
Yes. Join the tables using a lookup relationship and use columns from both tables, or use Map Layering to display each data set as a separate layer.
8. How do I show coordinates in the tooltip?
Drag the Latitude and Longitude columns to the Include Columns for Tooltip shelf.
9. Why is Map - Hexbin unavailable in the chart-type list?
Map - Hexbin becomes available only after Hexbin is set as the function on both coordinate axes. Add Longitude to the X-Axis shelf and Latitude to the Y-Axis shelf, then select Geo Location > Hexbin from the function drop-down on either coordinate.
10. How are Map - Hexbin, Cluster Map, and USA Hex Bin Projection different?
Cluster Map groups nearby points into clusters that change as users zoom. Map - Hexbin uses a fixed grid of cells that remains stable while users zoom. USA Hex Bin Projection changes the shapes of US states into equal-size hexagons; it does not group the report's data points.