Integration with QuickBooks Desktop
Analytics Plus seamlessly integrates with QuickBooks Desktop, and enables you to easily analyze your accounting data and keep track of key metrics. This helps managers create intuitive reports on accounts, bill details, invoices, customers, and much more.
General
Setup
- How do I integrate Analytics Plus with QuickBooks Desktop?
- What are the supported QuickBooks Desktop versions for this integration?
- How long should I wait for my QuickBooks Desktop data to appear in Analytics Plus initially?
- What should I do when the data synchronization fails?
- How do I schedule data synchronization?
- How do I download the latest .QWC file?
- Can I edit the synchronization settings?
- How do I create custom reports over my QuickBooks Desktop data?
- Can I set up the QuickBooks Desktop integration in existing workspaces in Analytics Plus?
- Is it possible to create multiple QuickBooks Desktop integration setups in Analytics Plus?
- How do I remove the QuickBooks Desktop integration and all related data?
Reporting Features
- What are the report types supported by Analytics Plus?
- Can I modify the pre-built reports created on integrating with QuickBooks Desktop?
- How do I create reports using fields/columns across different QuickBooks Desktop modules?
- What are formulas in reports?
- Is it possible to create custom formulas in Analytics Plus?
- Can I modify the tables imported from QuickBooks Desktop?
- Can I add new columns to the tables imported from QuickBooks Desktop?
- Can I import new tables into the QuickBooks Desktop workspace?
- Can I combine data from other sources with the data from QuickBooks Desktop, and create reports and dashboards?
- What are Query Tables?
Sharing & Collaboration
- How do I share reports, dashboards, and tables in Analytics Plus?
- Why are my colleagues unable to access the reports I create?
- Can other users create reports using the tables in the QuickBooks Desktop workspace?
- Is it possible to share the same report to multiple users such that they each see different data?
- Can I export a report or a dashboard?
- How do I print the reports and dashboards created in Analytics Plus?
- Can I email reports and dashboards at scheduled times?
- Can I embed reports?
Help & Support
- How do I get technical support on Analytics Plus?
- Can I have get a personalized demo of this integration?
General
1. What is Analytics Plus?
ManageEngine Analytics Plus is an on-premises reporting and business intelligence application that helps you analyze your IT data and create insightful reports & dashboards for informed decision-making. It offers the following important capabilities:
- Import data from local files, web feeds, local and cloud databases, and cloud storage/drive.
- Displays data in an easy-to-view excel format.
- Build custom reports and dashboards easily, with the drag-and-drop report builder.
- Supports powerful visualizations in the form of charts, pivot tables , summary views, tabular views, and dashboards.
- Generate reports and KPIs in seconds with Zia, Analytics Plus' intelligent analytics assistant powered by Machine Learning and Artificial Intelligence.
- Create custom formulas using the built in formula engine that contains a wide range of mathematical, statistical and logical functions.
- Share reports and dashboards with your colleagues easily, through a wide range of collaboration features.
- Export and publish reports and dashboards in various formats, and configure permissions and filters for the views.
- Supports out-of-the-box integrations with a wide number of applications, to give you pre-built reports and dashboards on your application's data within minutes.
2. What are the highlights of this integration?
Analytics Plus seamlessly integrates with QuickBooks Desktop, allowing you to create intuitive reports and live dashboards for a high level view of your accounting data. The data from the following modules will be synchronized into Analytics Plus on setting up this integration.
- Accounts
- Billing and transactions
- Checks
- Credit memos
- Customers
- Estimates
- Invoices
- Payments
- Sales orders, and receipts
- Vendors
Setup
1. How do I integrate Analytics Plus with QuickBooks Desktop?
2. What are the supported QuickBooks Desktop versions for this integration?
You can easily integrate Analytics Plus with the following versions of the QuickBooks Desktop application.
- US Enterprise 2016
- US Premium 2016
- US Pro 2016
- US Enterprise 2017
- US Premium 2017
- US Pro 2017
- US Enterprise 2018
- US Premium 2018
- US Pro 2018
3. How long should I wait for my QuickBooks Desktop data to initially appear in Analytics Plus?
After setting up the integration, you might have to wait some time for the initial fetch to complete. Depending on the amount of data in your application, the reports and dashboards might take up to 5 minutes to display all the metrics. If you access the workspace before the initial fetch, it will not display any data.
4. What should I do when the data synchronization fails?
The import or synchronization process of your QuickBooks Desktop data can fail sometimes, due to a variety of reasons. If the issue persists, please e-mail analyticsplus-support@manageengine.com.
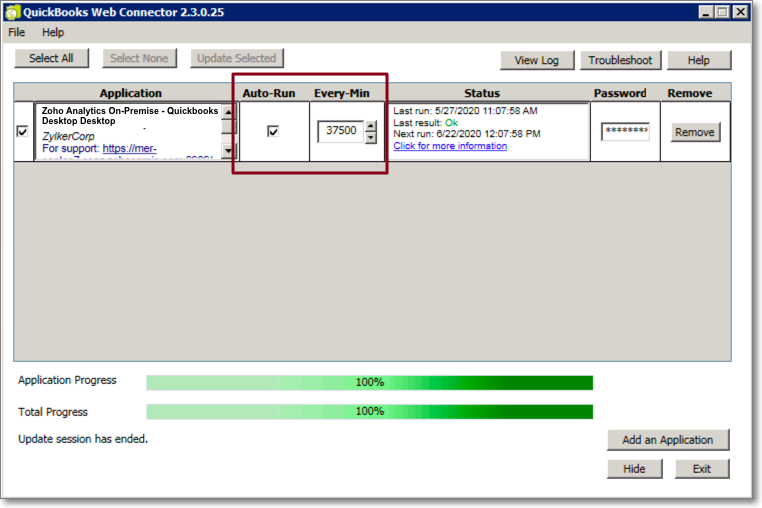
5. How do I schedule data synchronization?
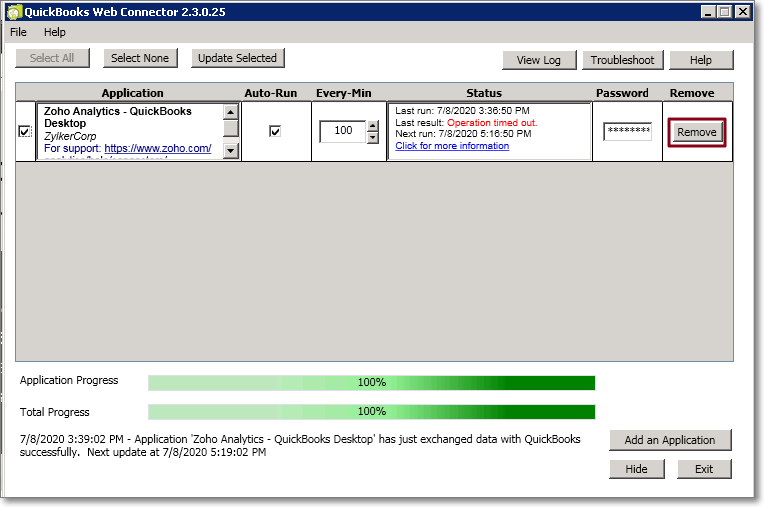
You can schedule data synchronization at regular intervals using your QuickBooks Web Connector. To do this, select the Auto-Run checkbox, and specify the required interval using the Every-Min drop-down.
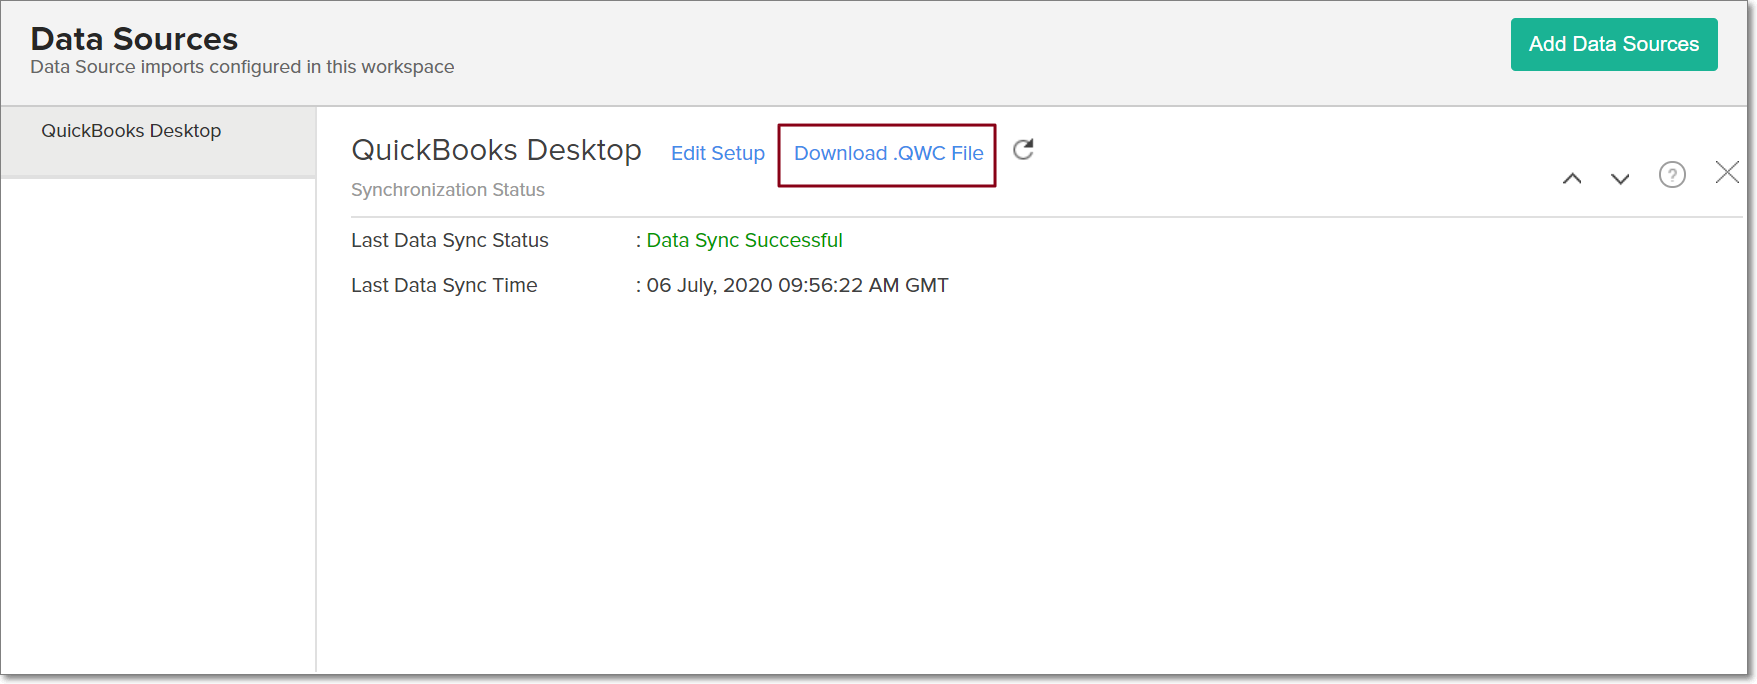
6. How do I download the latest .QWC file?
You can download the latest .QWC file even after the setup is completed. To do this, click the Data Sources button from the left-side panel. In the page that appears, click Download .QWC File.
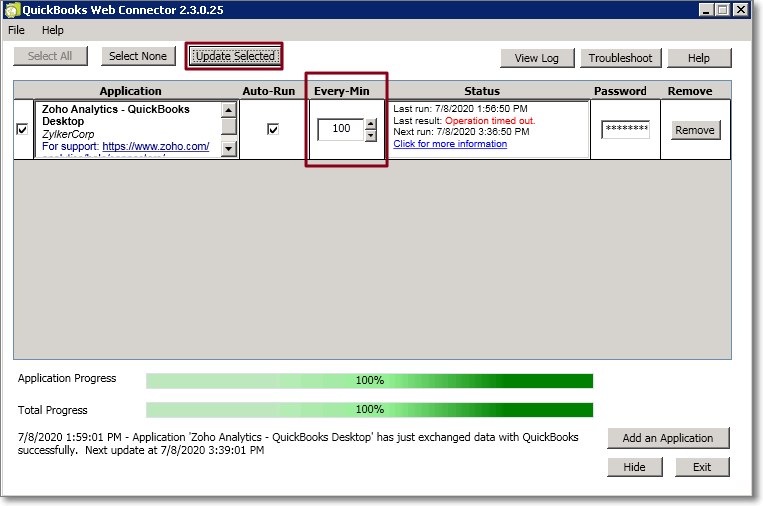
7. Can I edit the synchronization settings?
To edit the connection and synchronization settings, open your QuickBooks Web Connector. Modify the synchronization interval in the Every-Min section, and click the Update Selected button.
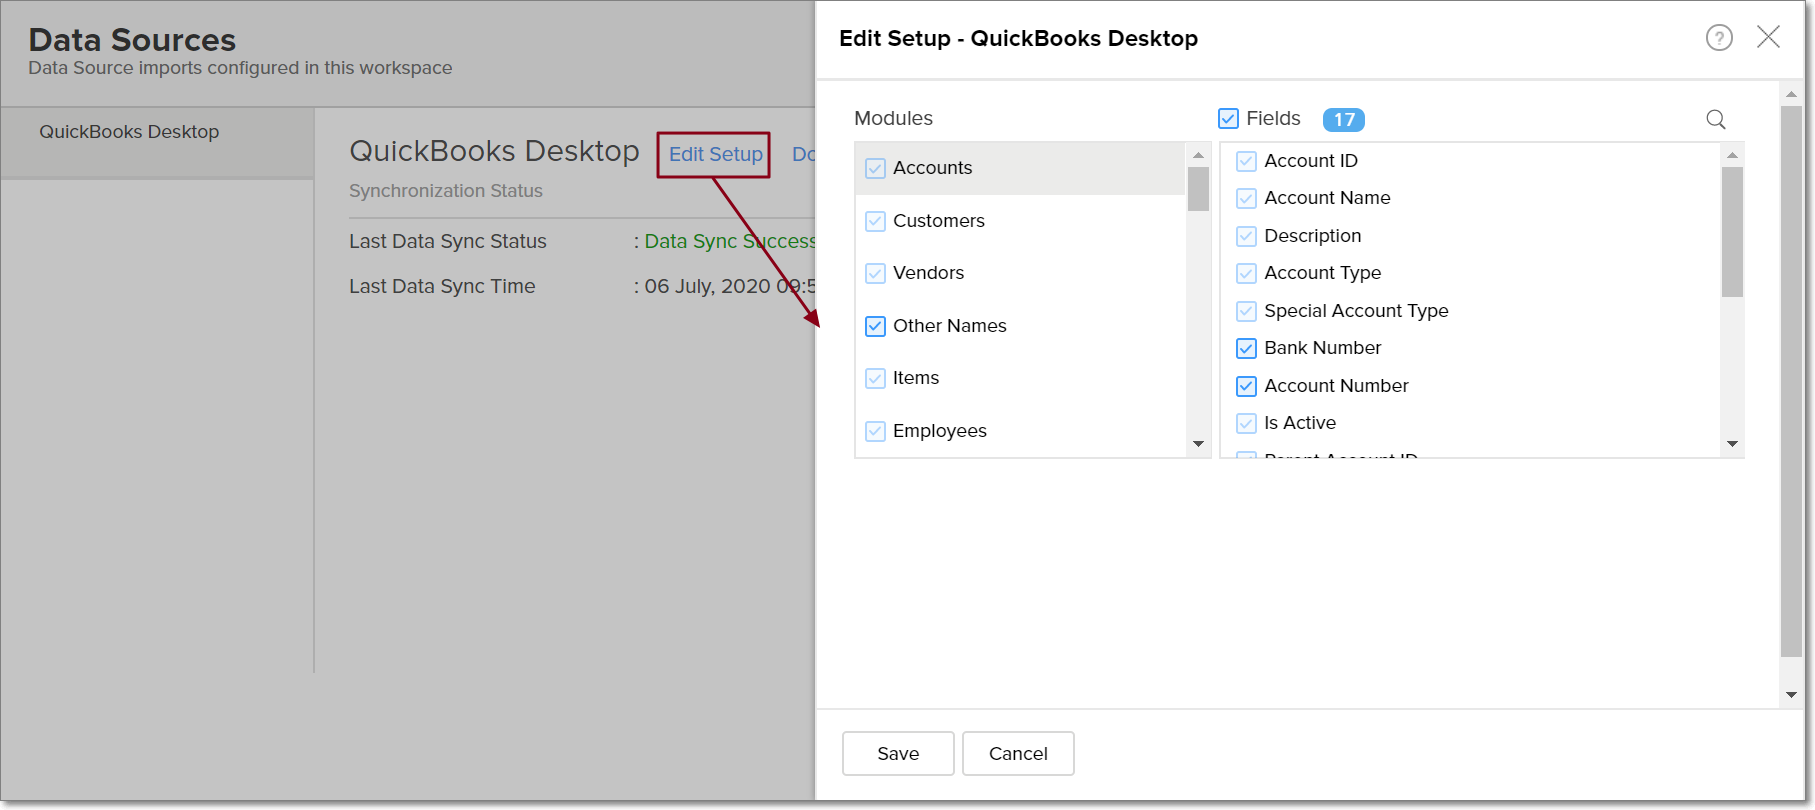
To edit the modules and fields imported from QuickBooks Desktop, open your Analytics Plus application, and select Data Sources -> QuickBooks Desktop from the side panel.
The synchronization summary is displayed with the following data:
- Last data sync status: Status of the most recent synchronization from QuickBooks Desktop.
- Last data sync time: Time at which the most recent synchronization was completed.
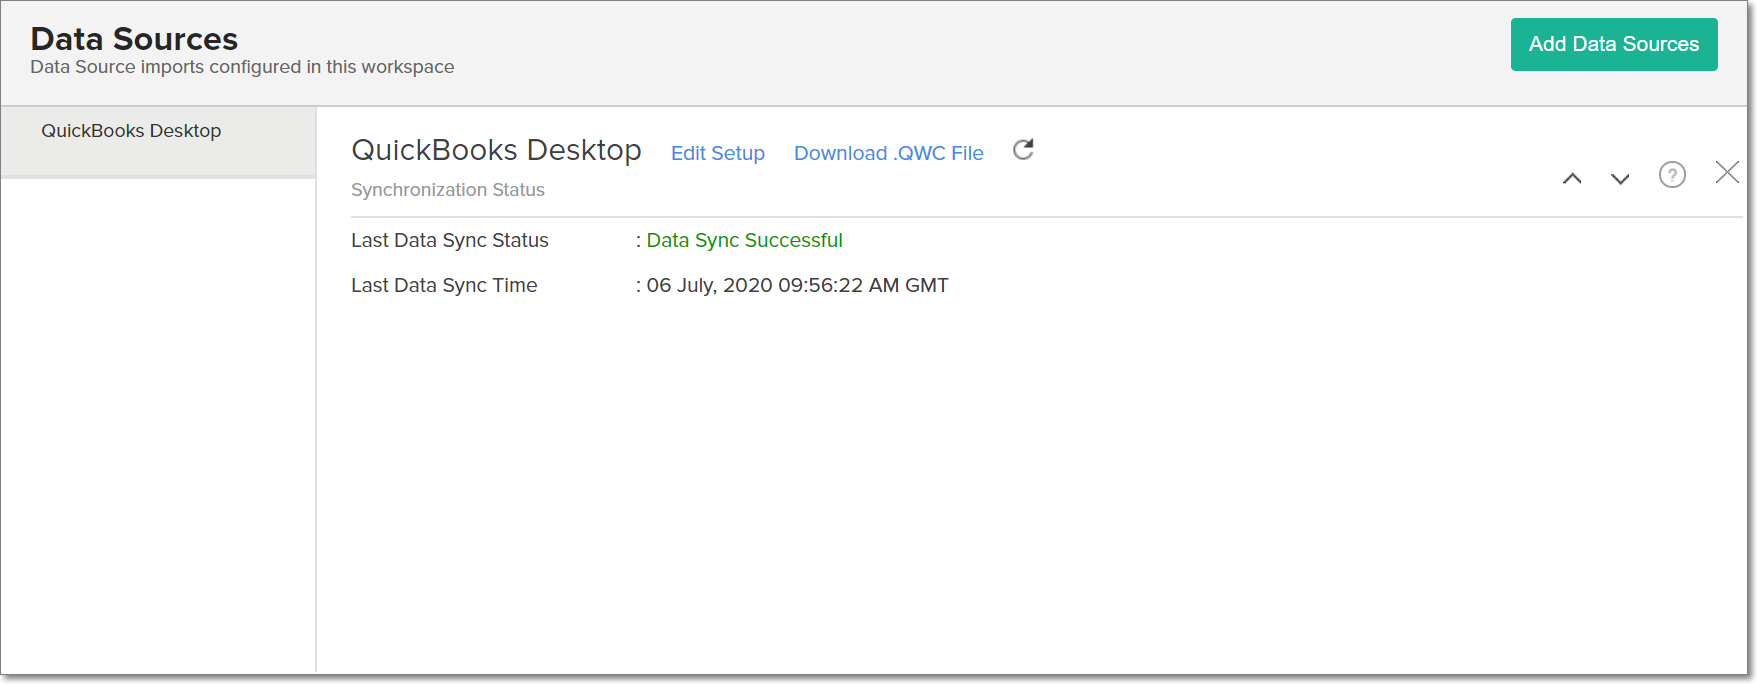
Click the Edit Setup link, modify the selected modules and fields as needed, and click Save.
8. How do I create custom reports over my QuickBooks Desktop data?
You can easily create custom reports in the form of charts, pivot tables, summary and tabular views in Analytics Plus. Click the corresponding links to learn more about creating reports. These reports can also be organized together to form intuitive dashboards. Refer this documentation to learn more about creating dashboards.
9. Can I set up the QuickBooks Desktop integration in existing workspaces in Analytics Plus?
Yes. Follow the steps below to do this.
- Open the required workspace, click the Create button from the side panel, and select the New Table / Import Data option.
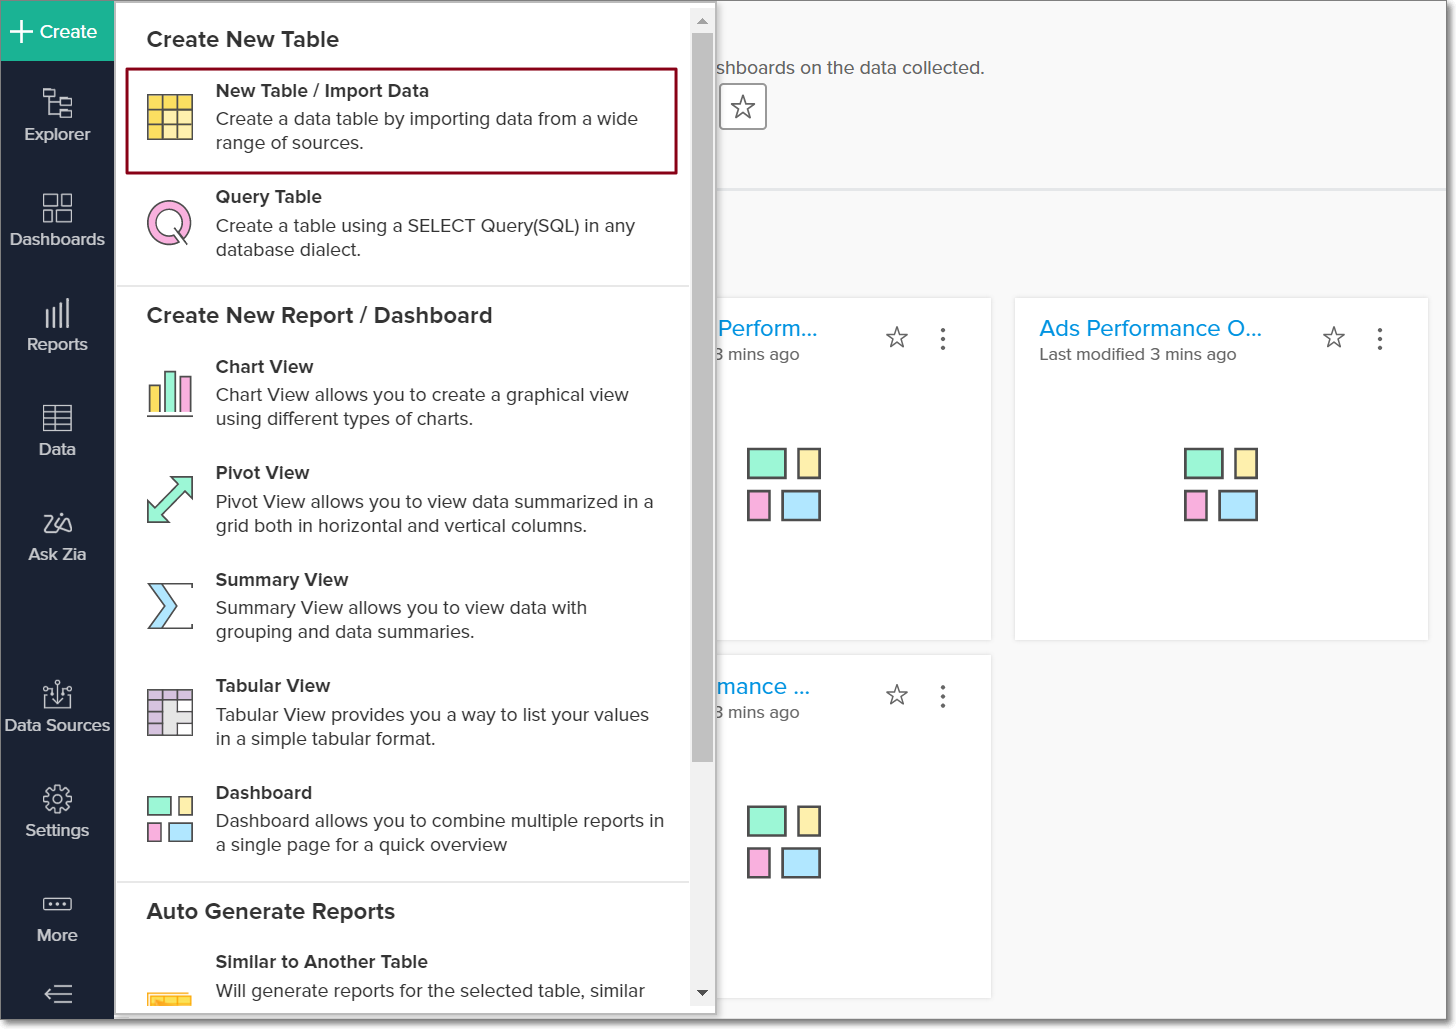
- Select the required QuickBooks Desktop tile in the Import Your Data screen that appears, and follow the setup procedure.
10. Is it possible to create multiple QuickBooks Desktop integration setups in Analytics Plus?
Yes. Follow the steps below to do this.
- Open the required workspace, click the Create button from the side panel, and select the New Table / Import Data option.
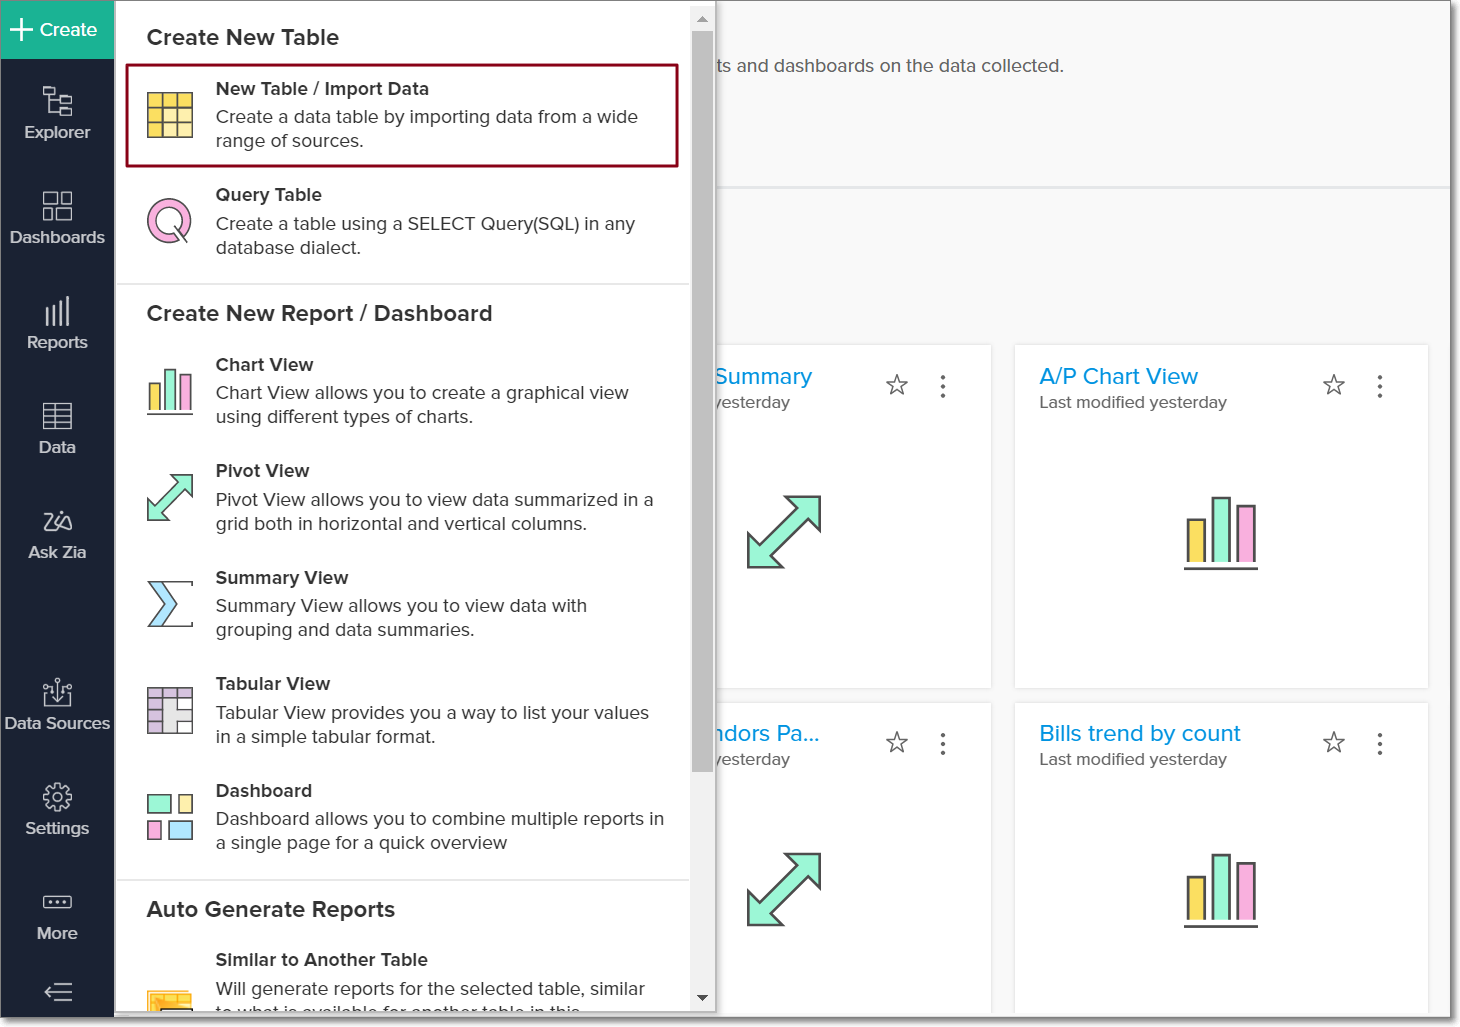
- Select the required QuickBooks Desktop tile in the Import Your Data screen that appears, and enter the details of the required QuickBooks Desktop account according to the usual setup procedure.
11. How do I remove the QuickBooks Desktop integration and all related data?
To do this, you need to remove the data source from Analytics Plus, and remove the app from your QuickBooks Desktop application.
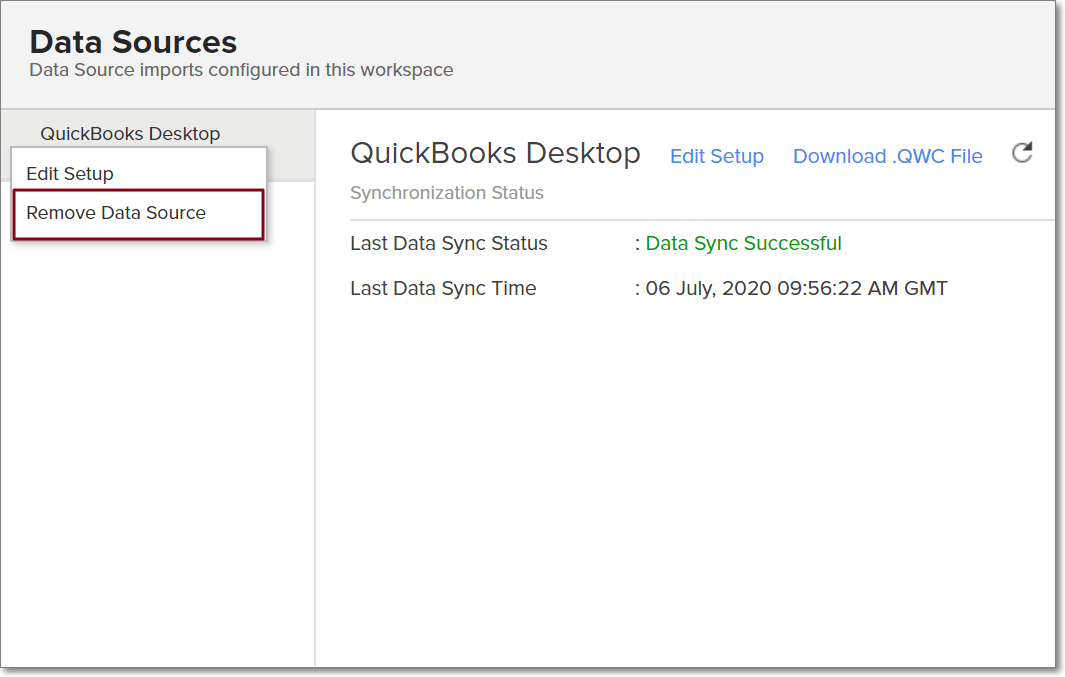
To remove the data source in Analytics Plus,
- Open the corresponding workspace, and click the Data Sources option from the side panel.
- Click the Settings icon that appears on mouse over the data source's name, and select Remove Data.
To remove the app from your QuickBooks Desktop application,
- Open the QuickBooks Web Connector, navigate to the Analytics Plus section and click the corresponding Remove button.
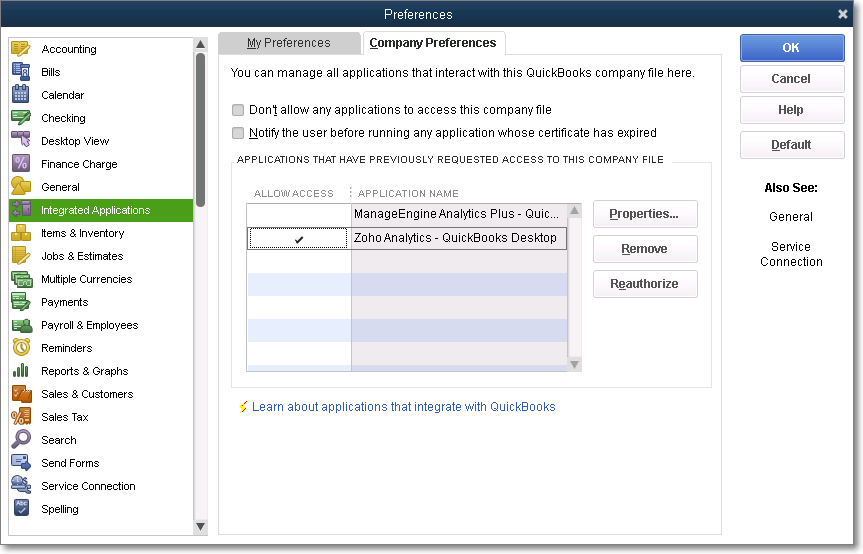
- In the QuickBooks Desktop application, click Edit -> Preferences. Navigate to the Integrated Applications section, select the Analytics Plus application, and click Remove.
Reporting Features
1. What are the report types supported by Analytics Plus?
Analytics Plus supports a wide variety of reports, in the form of charts, pivot tables, summary views and tabular views. To learn more about the various types of reports click here. To know more about dashboards and KPI widgets, click here.
2. Can I modify the pre-built reports created on integrating with QuickBooks Desktop?
Yes. If you are the administrator or a workspace administrator of the workspace in which the integration is set up, click the Edit Design button in a report's toolbar and make the required changes. If you are a user to whom a report is shared, save a copy of the report by clicking the More Options icon > Save As, and modify the copied version as needed.
3. How do I create reports using fields/columns across different QuickBooks Desktop modules?
Columns from different QuickBooks Desktop modules are joined by default. Therefore, reports can be created over this data by simply dragging and dropping the respective columns in the report builder. Click here to learn more about creating reports.
4. What are formulas in reports?
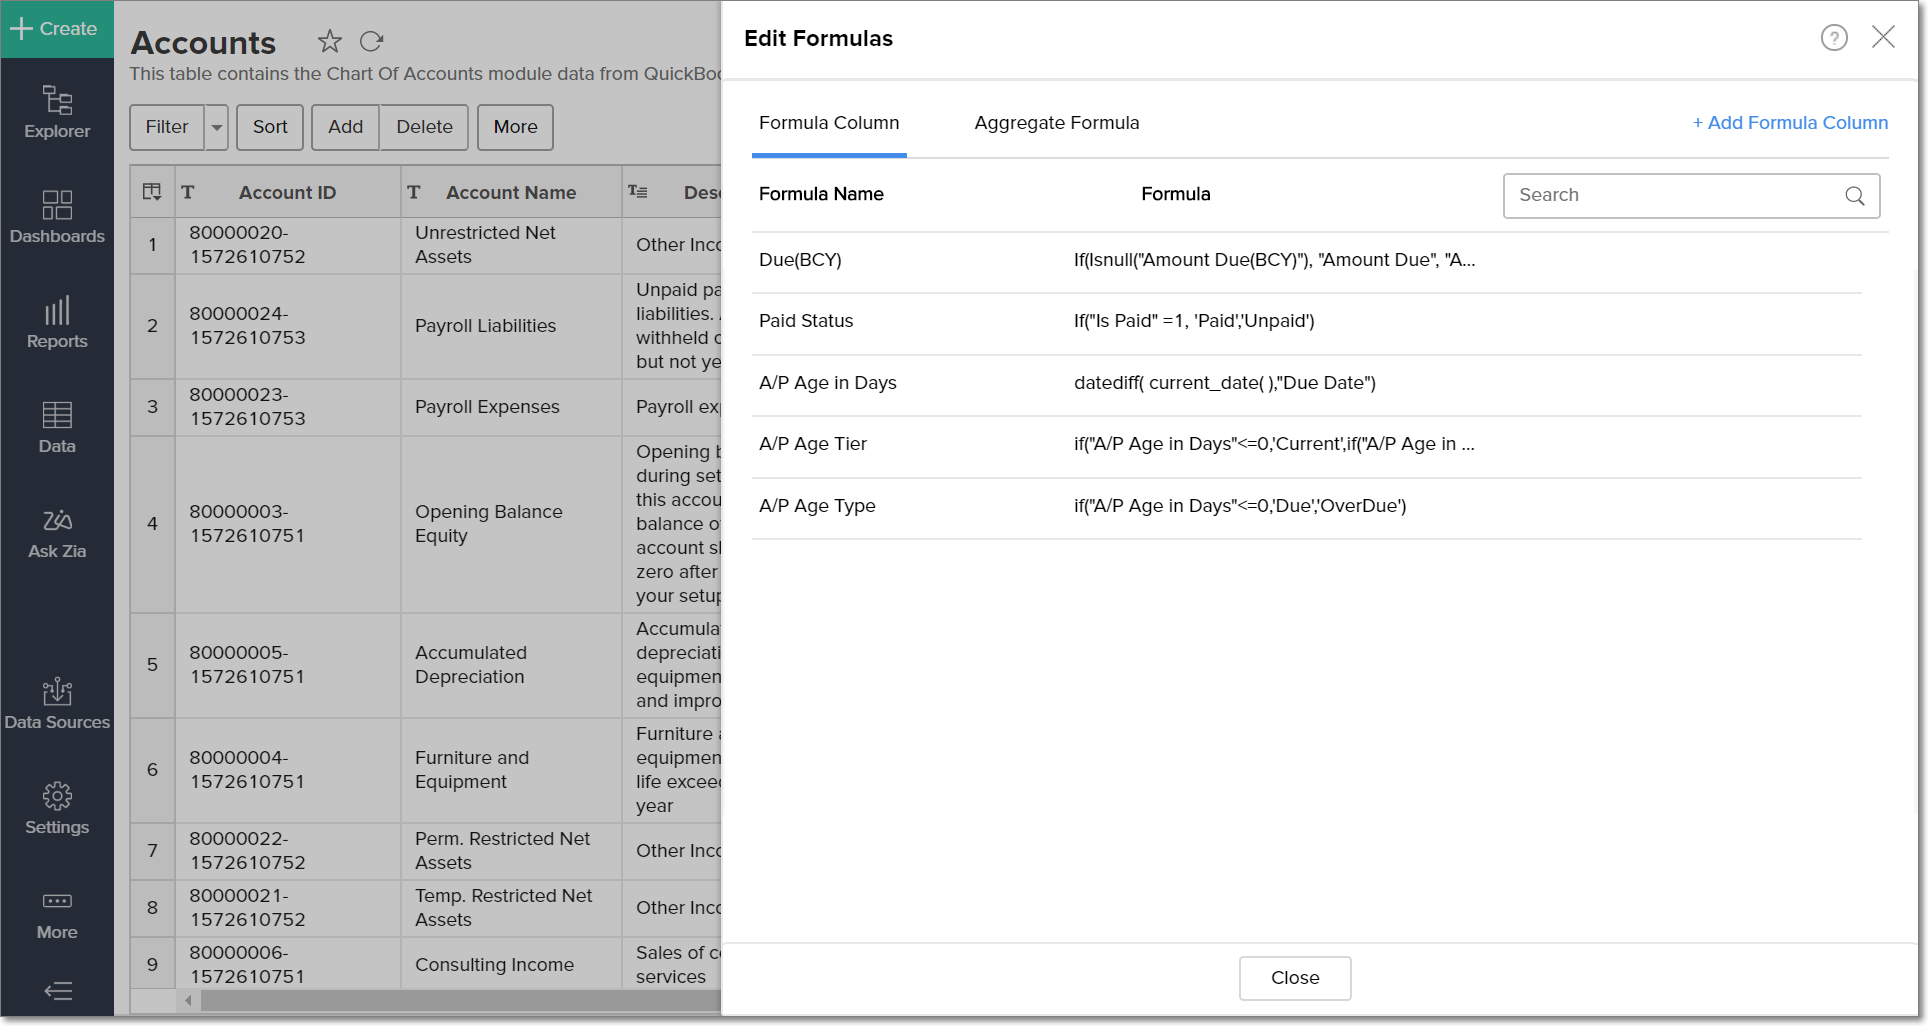
Formulas are calculations that can be defined using the powerful formula engine in Analytics Plus, to create required reports. Refer this documentation to know more. There are also several default formulas created based on the QuickBooks Desktop modules. To view the default formulas, open the required table, click Add and select the Edit Formulas option.
5. Is it possible to create custom formulas in Analytics Plus?
Yes. Refer this documentation to learn more.
6. Can I modify the tables imported from QuickBooks Desktop?
The data from QuickBooks Desktop is synchronized with Analytics Plus automatically, and stored in the form of various tables. Therefore, it is not possible to add data or modify the existing data present in these tables.
7. Can I add new columns to the tables imported from QuickBooks Desktop?
No. However, you can add Formula Columns and Aggregate Formulas to these tables, to help create custom reports. Refer this documentation to know more.
8. Can I import new tables into the QuickBooks Desktop workspace?
To do this, open the QuickBooks Desktop workspace, click Create from the side panel and select the New Table / Import Data option. You can integrate with other applications, or choose to import data stored in local files, web URLs, local databases, cloud databases and cloud drives. Click the corresponding links to know more.
9. Can I combine data from other sources with the data from QuickBooks Desktop, and create reports and dashboards?
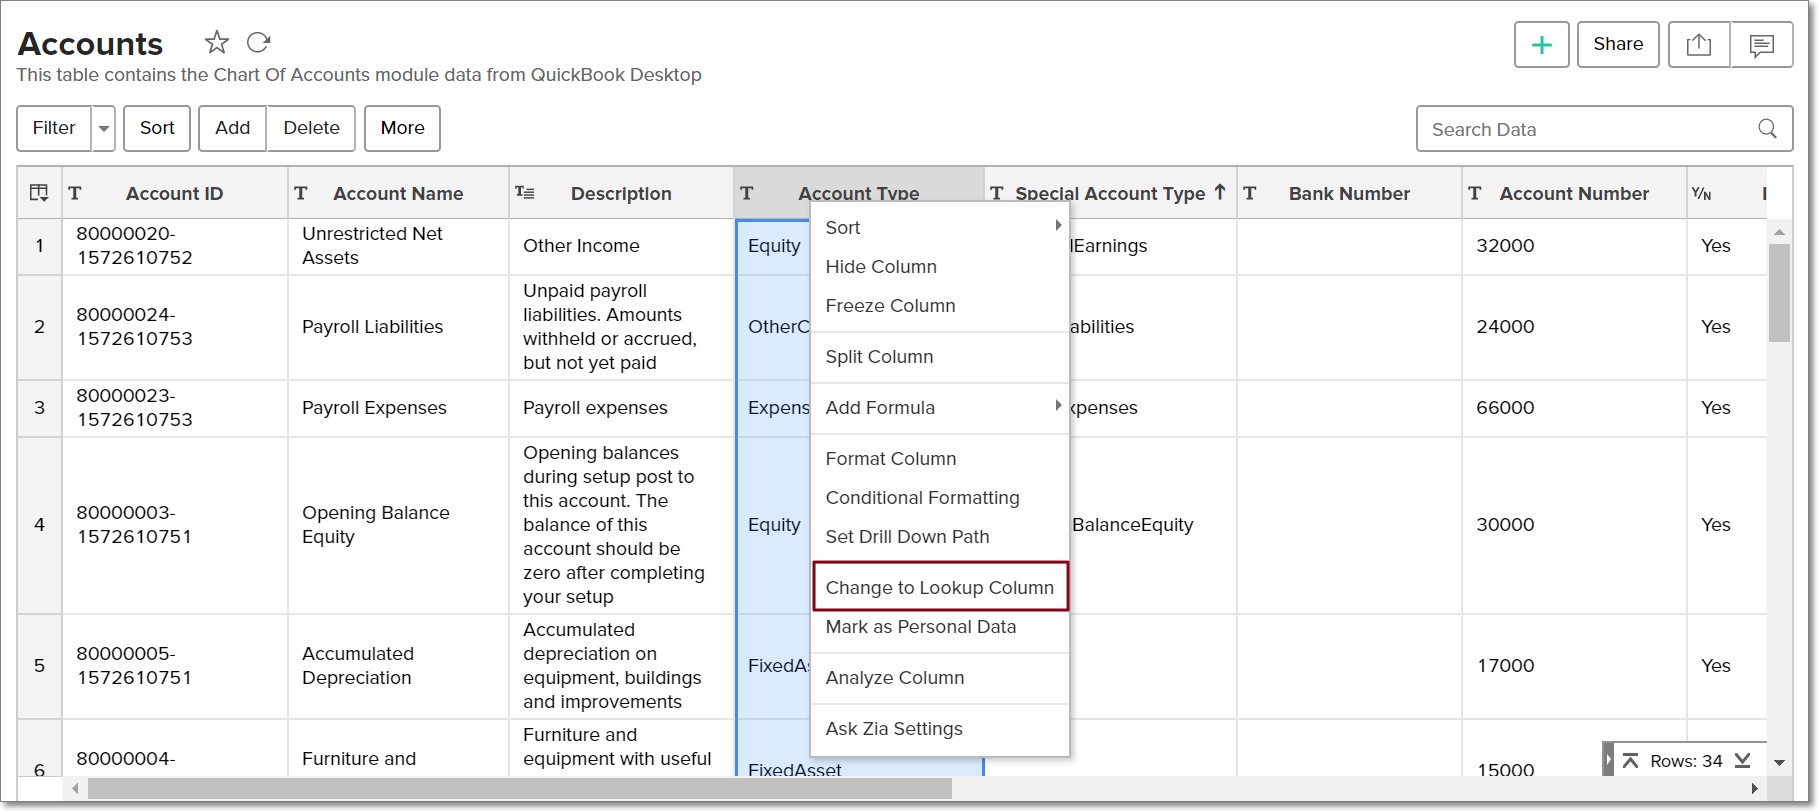
Yes. To do this, import or add a new table to the QuickBooks Desktop workspace and define a lookup relationship between the added data and the existing data in the workspace. To define a lookup relationship between two tables, it is essential that the tables have at least one column in common between them. Follow the below steps to establish a lookup relationship.
- Open the corresponding table, right click the column header and select the Change to Lookup Column option.
- In the dialog that opens, select the column from the second table to look up.
- Click OK.
Click here to learn more about lookup columns.
10. What are Query Tables?
Using query tables, Analytics Plus allows you to import the required data required by writing standard SQL queries. This feature also allows you to combine data from different tables, and create reports from the combined data. Refer this documentation to know more.
Sharing & Collaboration
1. How do I share reports, dashboards, and tables in Analytics Plus?
You can share the out-of-the-box reports, dashboards and tables, and the ones you create, with other users easily. Refer this documentation to know more.
2. Why are my colleagues unable to access the reports I create?
The QuickBooks Desktop workspace can be accessed only by the administrator who set up the integration. To allow other users to access the out-of-the-box reports and dashboards, you can share the reports and dashboards as needed. Refer this documentation to know more. You can also share the entire workspace with a user. Refer this documentation to know more.
3. Can other users create reports using the tables in the QuickBooks Desktop workspace?
Yes. To do this, share the required table with the users with the required permissions and filters.
4. Is it possible to share the same report to multiple users such that they each see different data?
Yes, you can do this by creating Variables. This allows you to share the report to several users, with associated filter criteria so that each user can access only the data specific to them. To learn more, refer this documentation.
5. Can I export a report or a dashboard?
Yes, you can export the report or dashboard in various formats such as CSV, EXCEL, PDF, HTML and image. To learn more, refer this documentation.
6. How do I print the reports and dashboards created in Analytics Plus?
To do this, export the report or dashboard in the required format and print the exported file. To learn more about exporting a view in Analytics Plus, refer this documentation.
Note: To export a shared report or dashboard, the Export permission has to be enabled.
7. Can I email reports and dashboards at scheduled times?
Yes, you can easily set up email schedules. Refer this documentation to learn more.
8. Can I embed reports?
Yes. You can easily embed reports and dashboards into websites, applications or blogs. Refer this documentation to know more.
Help & Support
1. How do I get technical support on Analytics Plus?
Technical support is free for all users, even during the trial period. You can contact technical support through:
- Email: analyticsplus-support@manageengine.com
- Phone: +1-888-720-9500
You can also get answers straight from our community.
2. Can I have get a personalized demo of this integration?
Yes, please register for a demo using the form on this page.

