Key Driver Analysis (Diagnostic Insights)
Key Driver Analysis is a machine learning technique that identifies the key factors that significantly influence a target metric and the degree to which these factors impact the outcome. It helps uncover the underlying drivers of observed trends in the target metric.
- Setting up Key Driver Analysis
- Configuring Key Driver Analysis
- Viewing and interpreting the results of Key Driver Analysis
- Evaluating the Key Driver Analysis
Setting up Key Driver Analysis
To enable Key Driver Analysis (KDA), follow the steps below:
Step 1: Open the Settings page and click Configure Add-ons under Configuration.
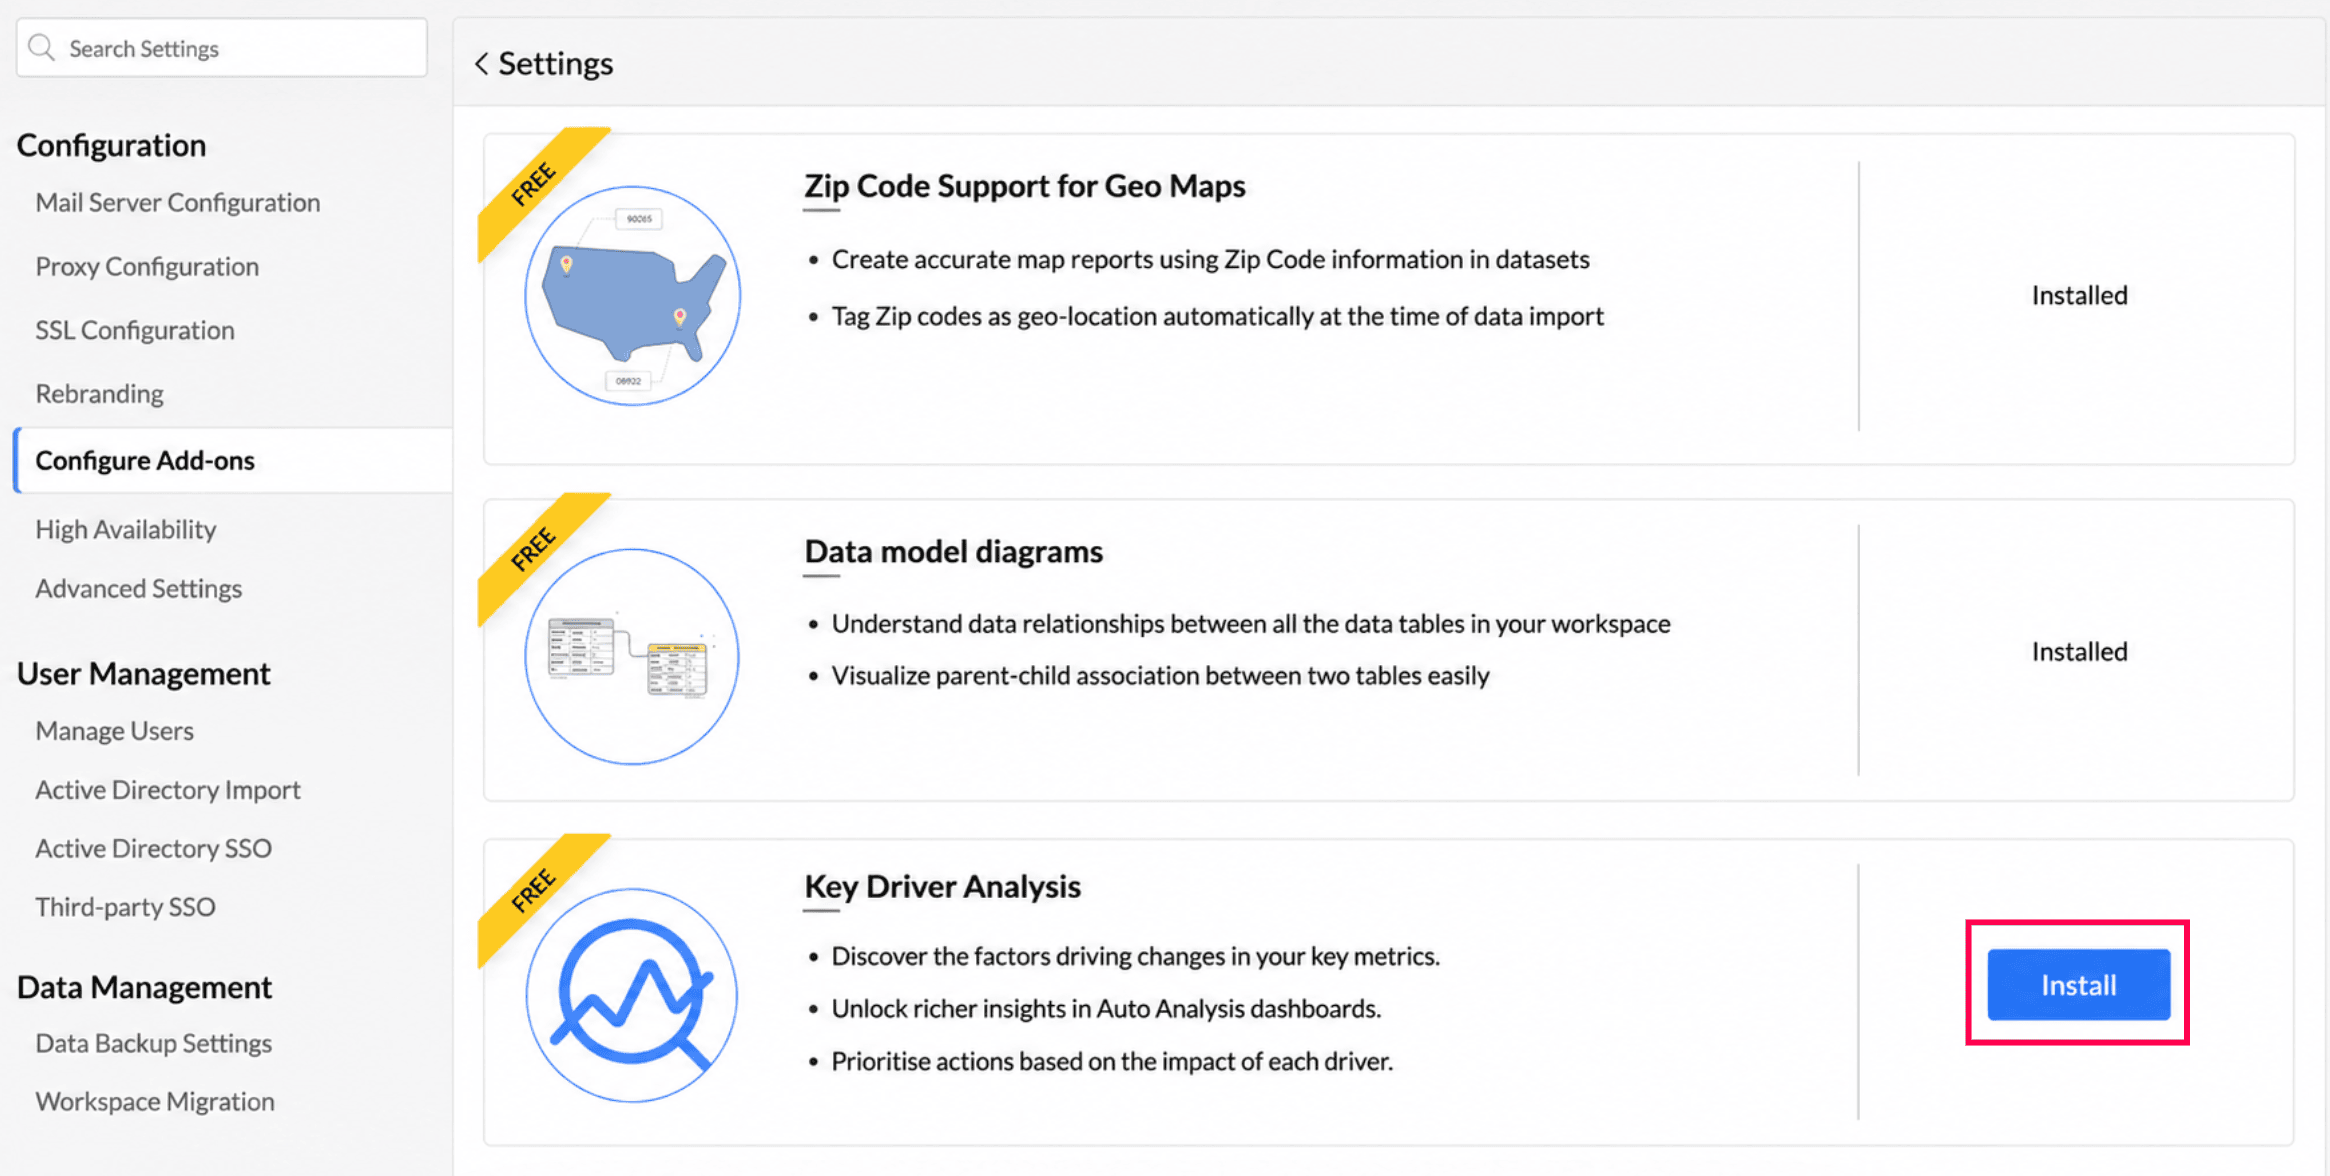
Step 2: In the screen that appears, head to the Key Driver Analysis listing and click Install.
Step 3: Once the installation is done, restart your Analytics Plus service.
Configuring Key Driver Analysis
Open the required chart and click the Settings icon at the top-right corner.
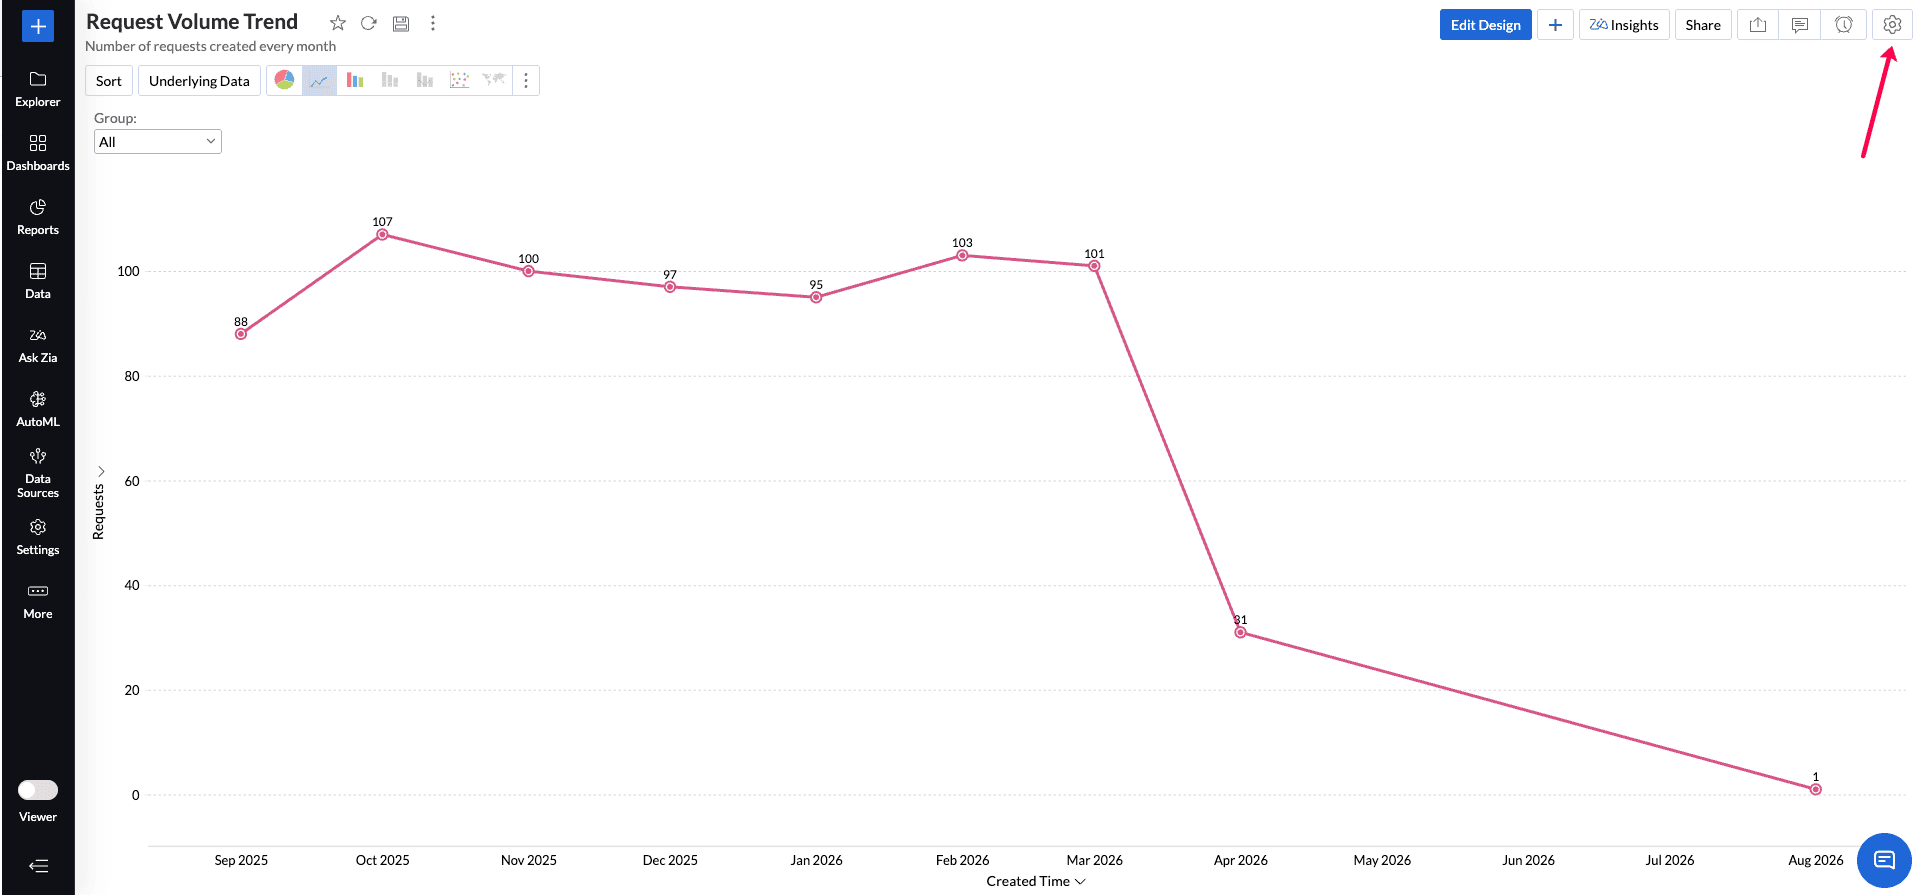
Navigate to the Zia Insights tab and expand the Key Driver Analysis section.
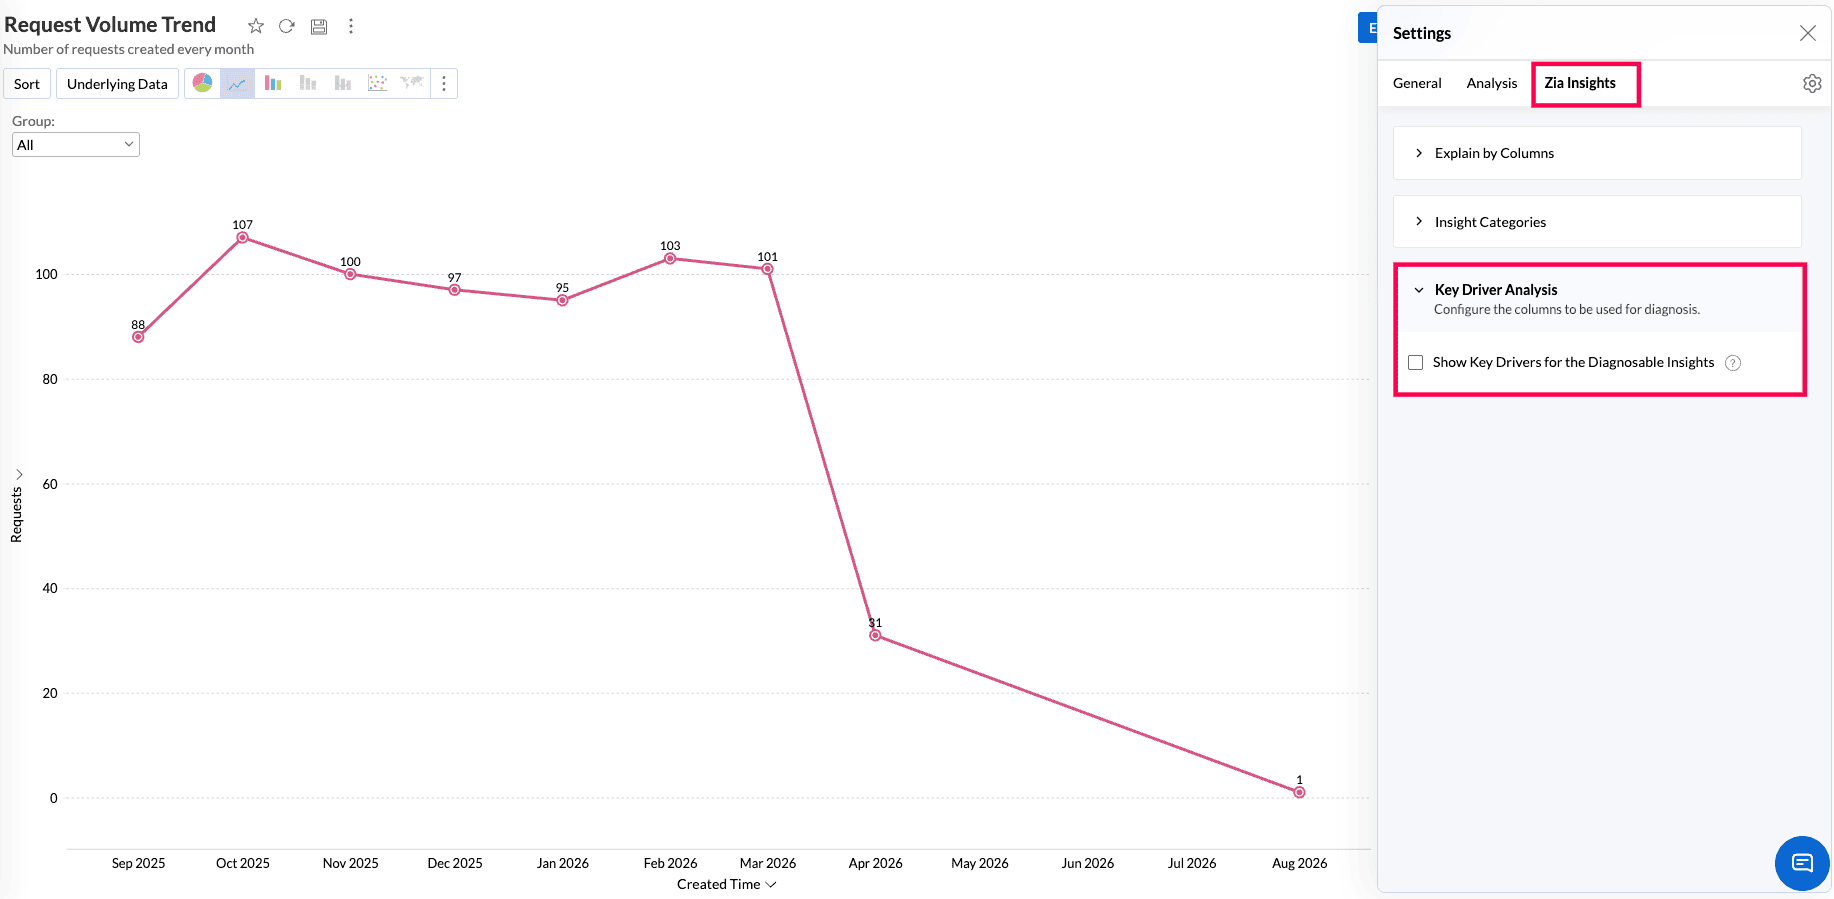
Select the Show Key Drivers for the Diagnosable Insights checkbox.
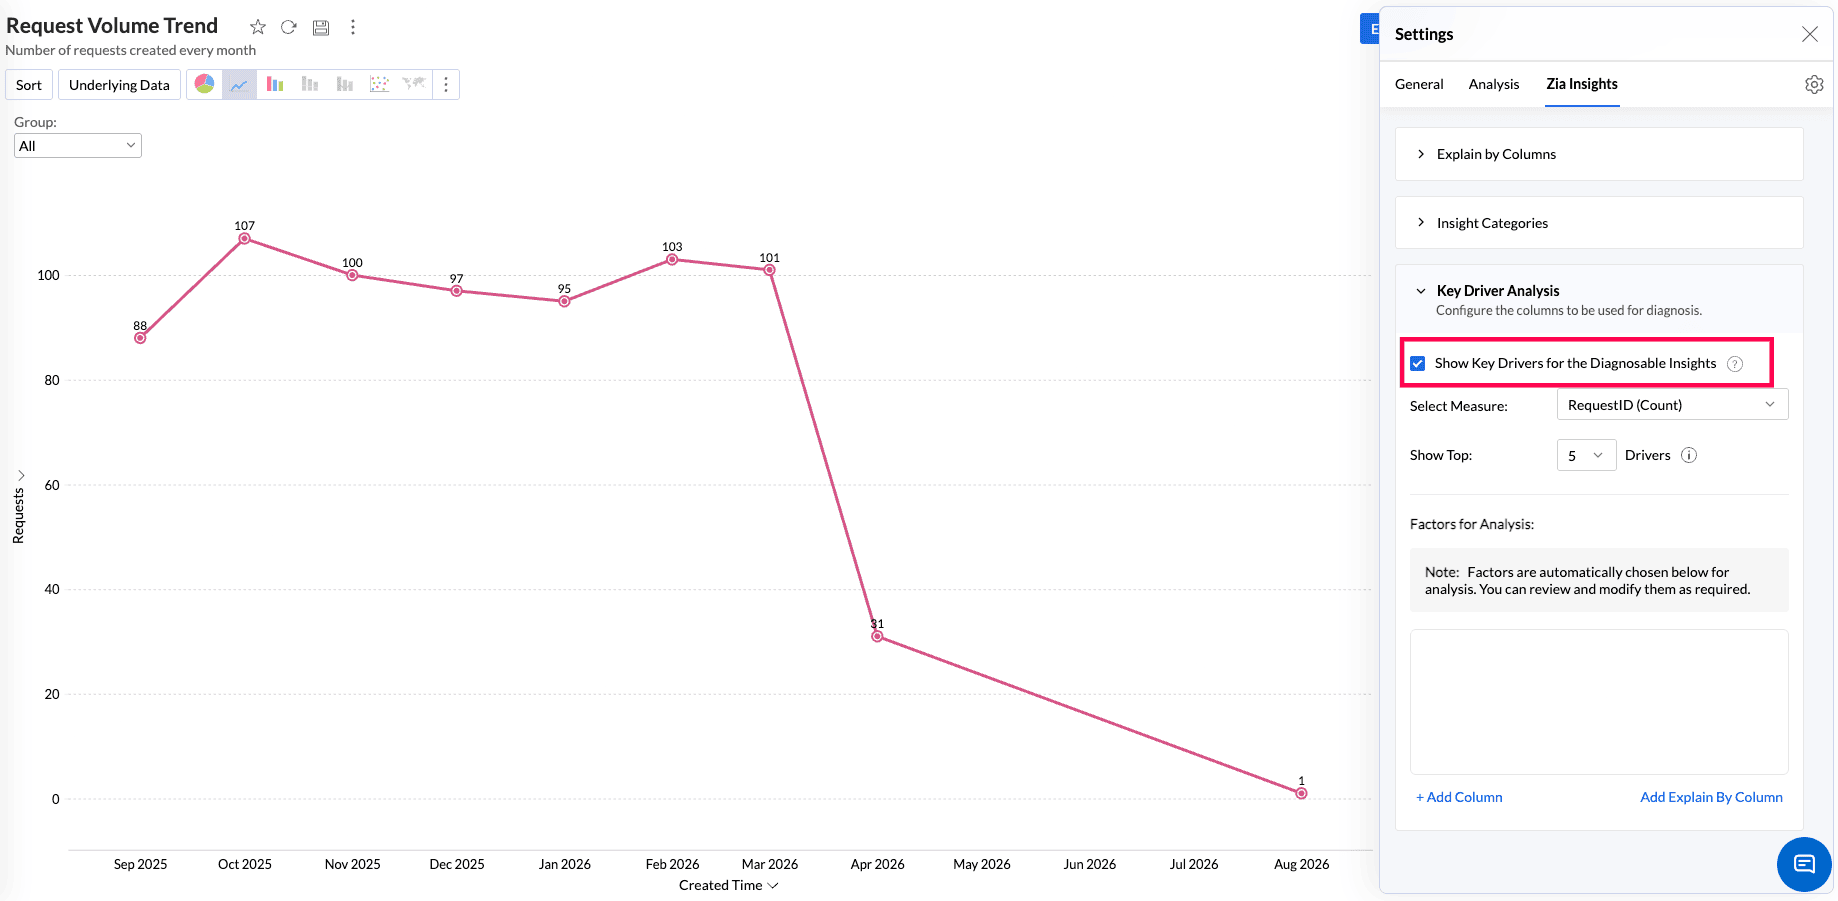
Select a Measure (target) column for which you want to evaluate the outcome from the Select Measure drop-down. Once you select a measure column, Analytics Plus automatically populates the relevant factors that may influence it.
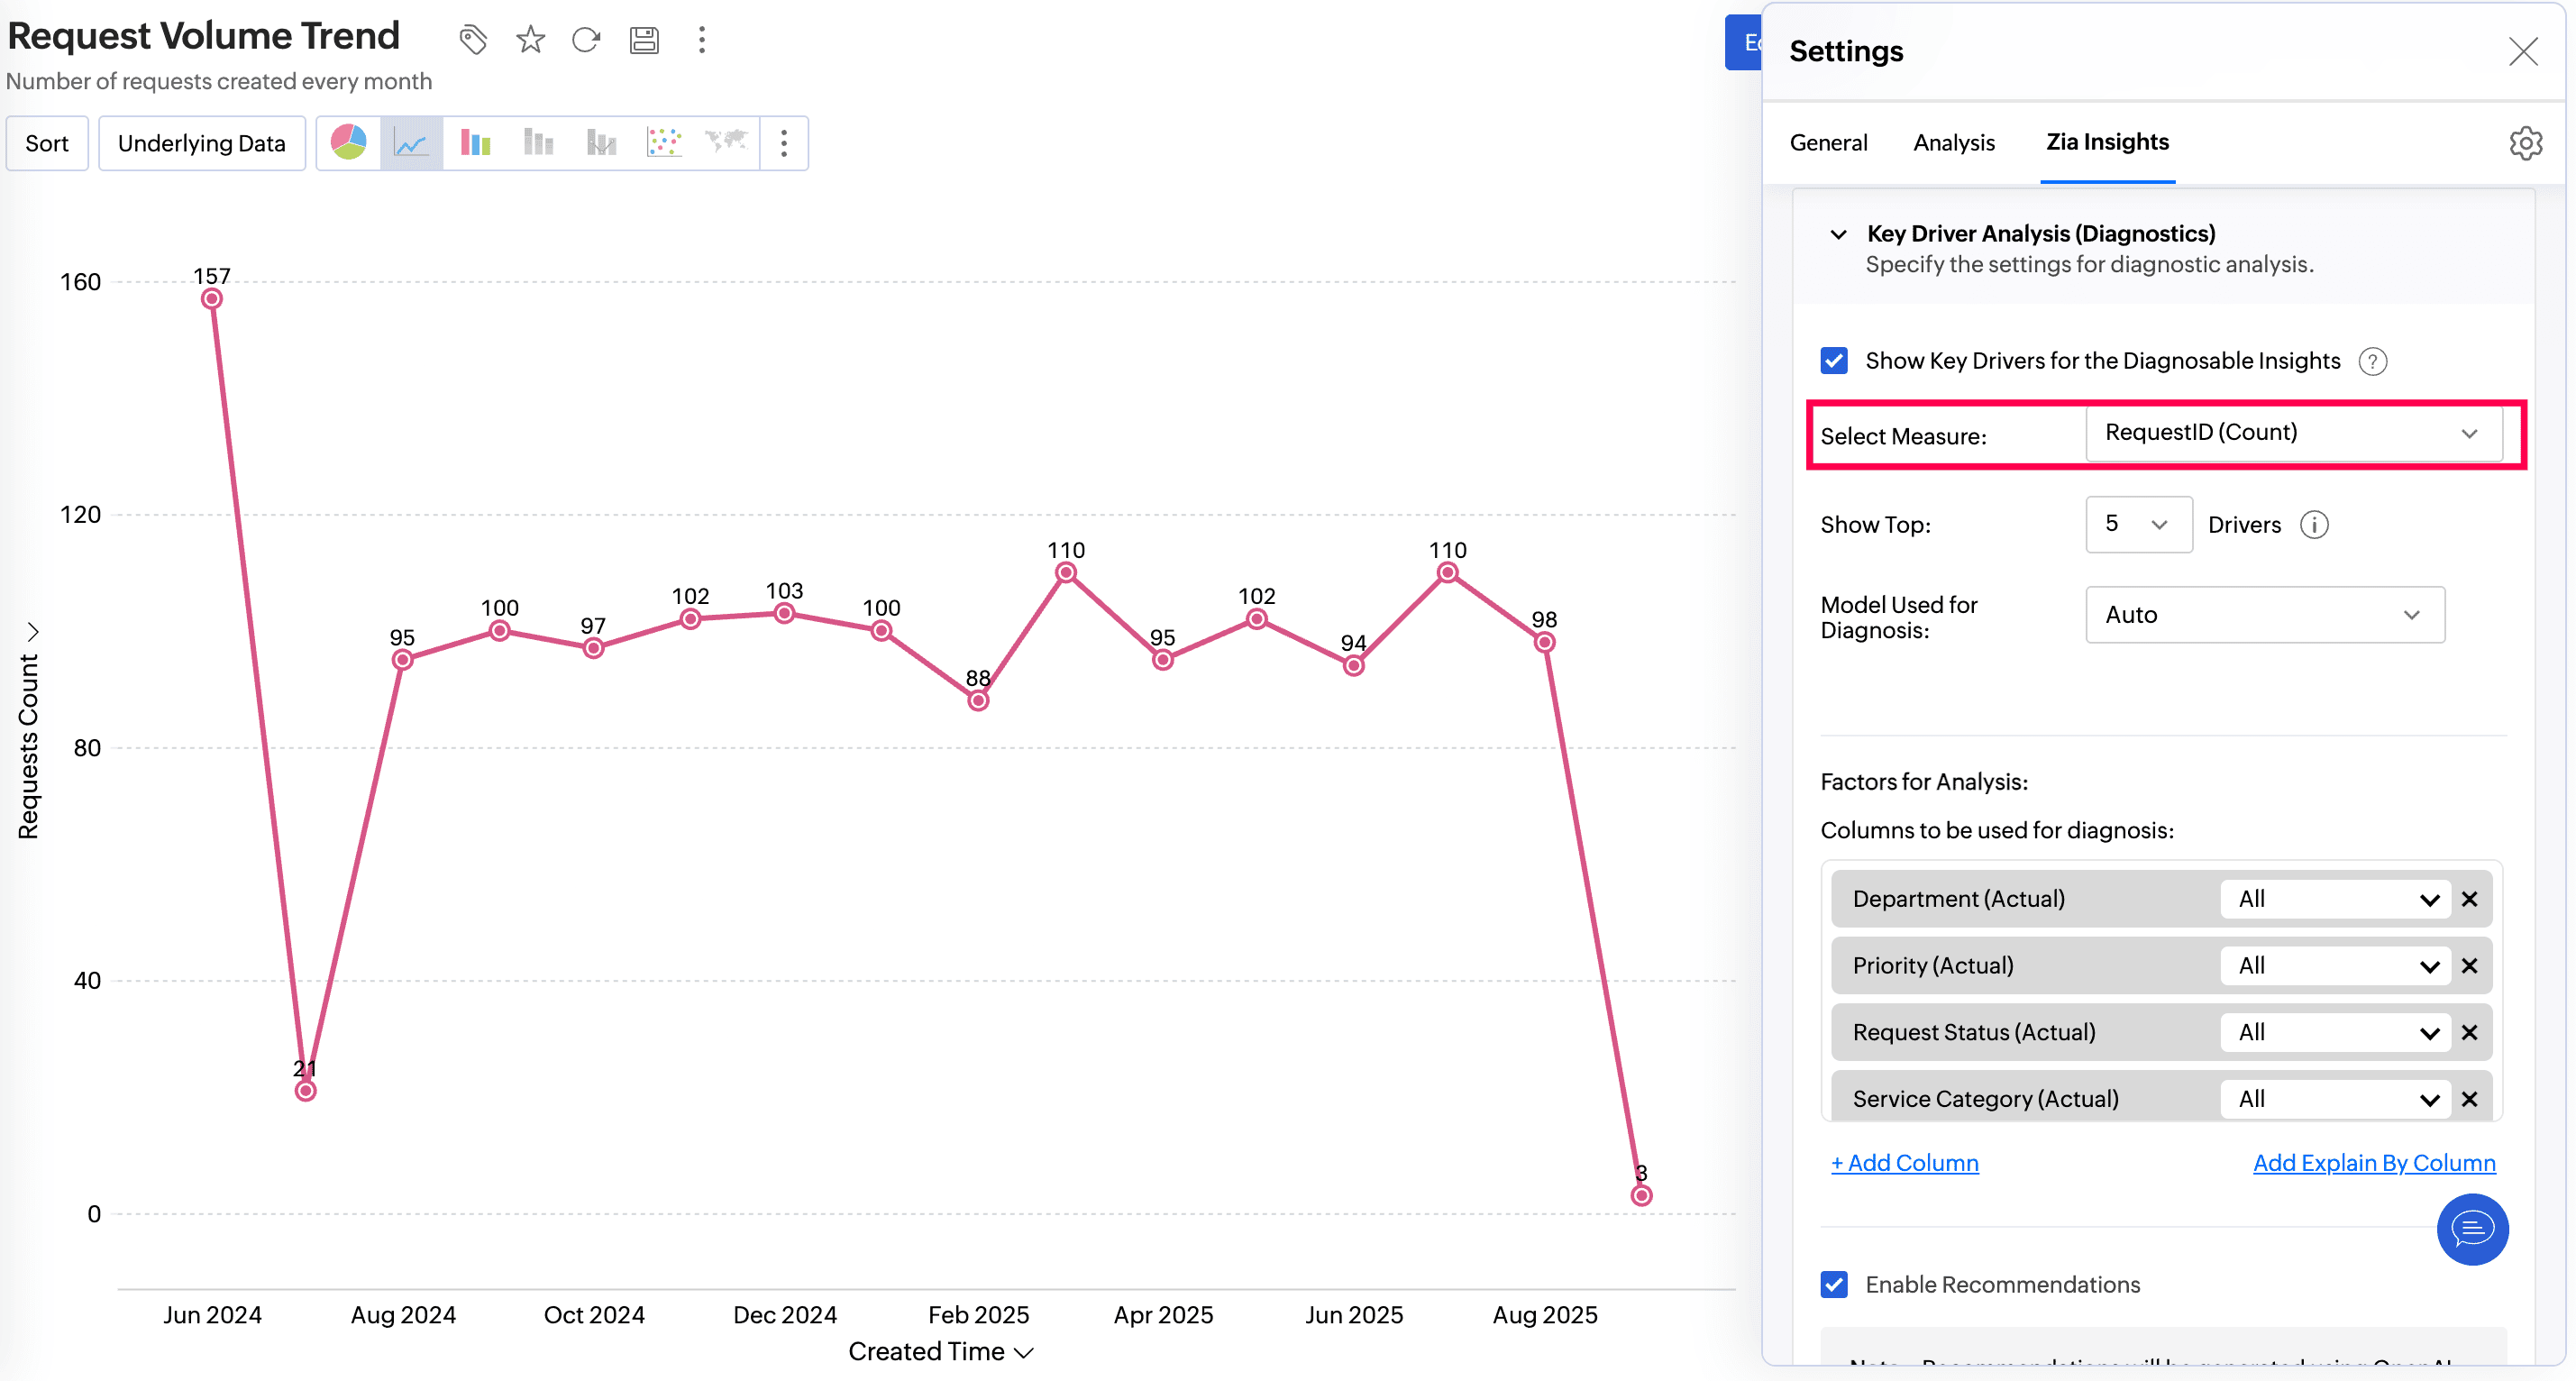
- From the Show Top N Drivers drop-down, select the number of influential factors that should be displayed in the key driver analysis. You can select between 1 and 5 drivers from the factors added above.
- The Factors for Analysis section displays the columns added automatically for diagnosis. To add more factors, click + Add Column. You can add five dimension columns and three measure columns.
- Close the Settings dialog and click Save to save the configuration.
Viewing and Interpreting the Results of Key Driver Analysis
Key Driver Insights provide a detailed analysis of time-series trends and help identify the factors responsible for increases or decreases in the target measure/KPI.
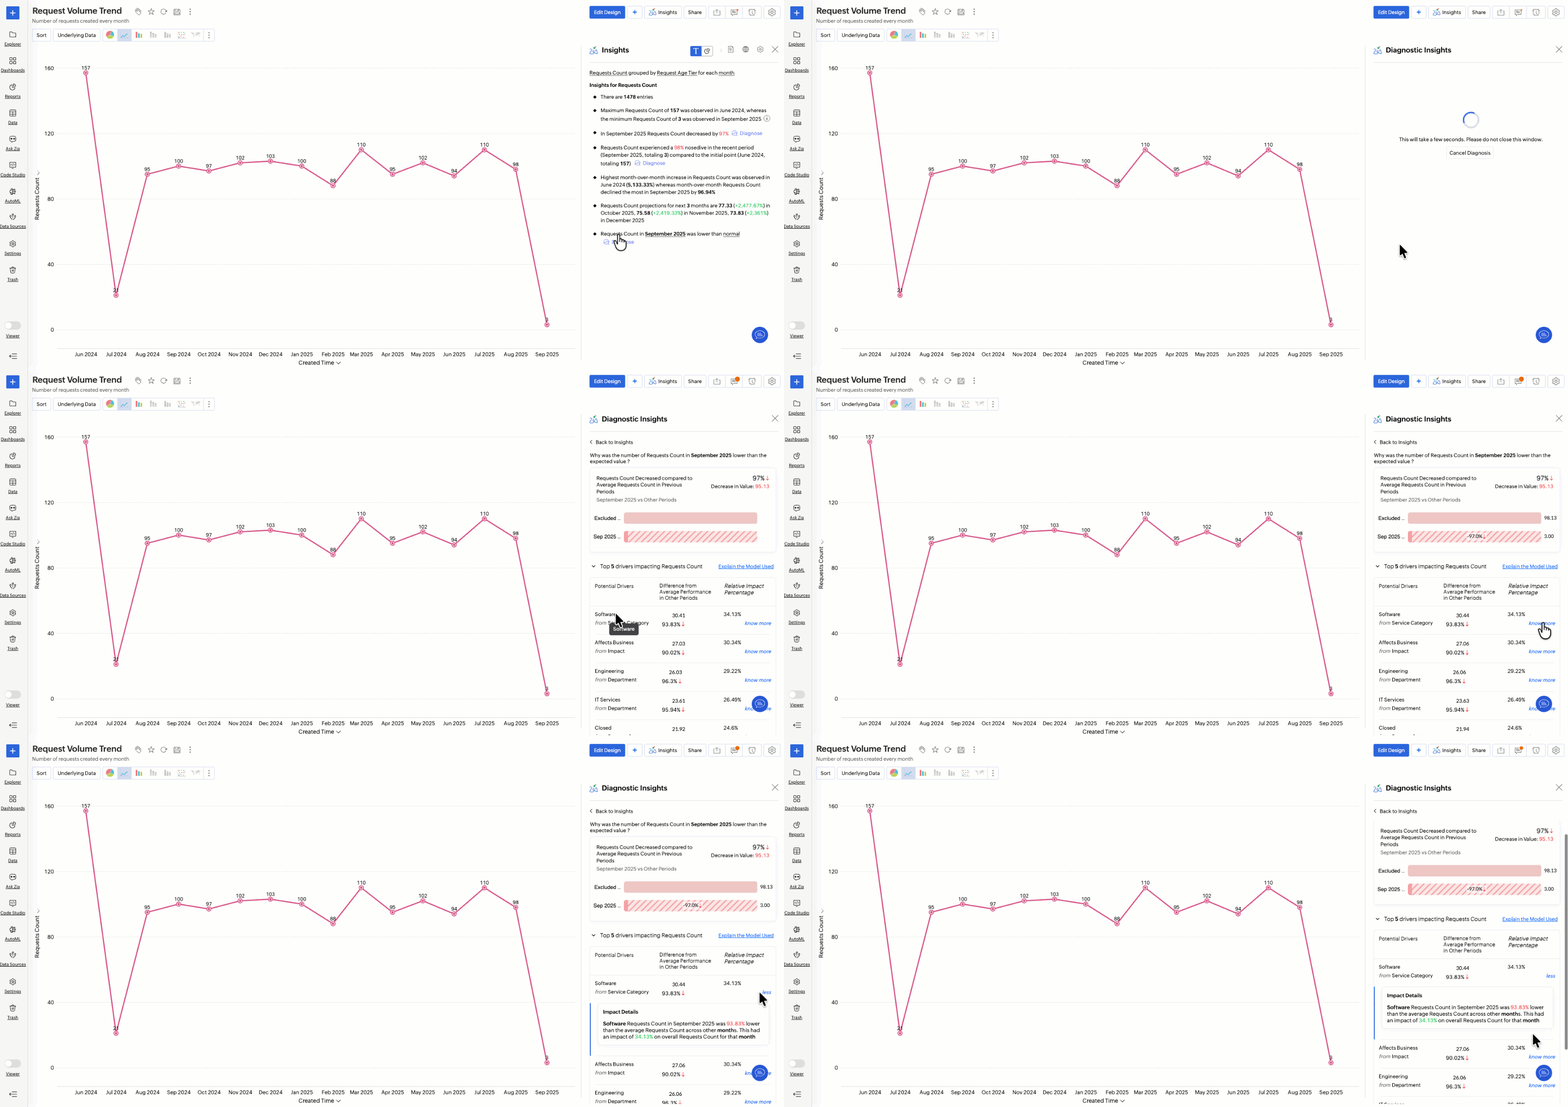
To view the diagnostic insights, click the Diagnose option that appears on Zia Insights dialog.
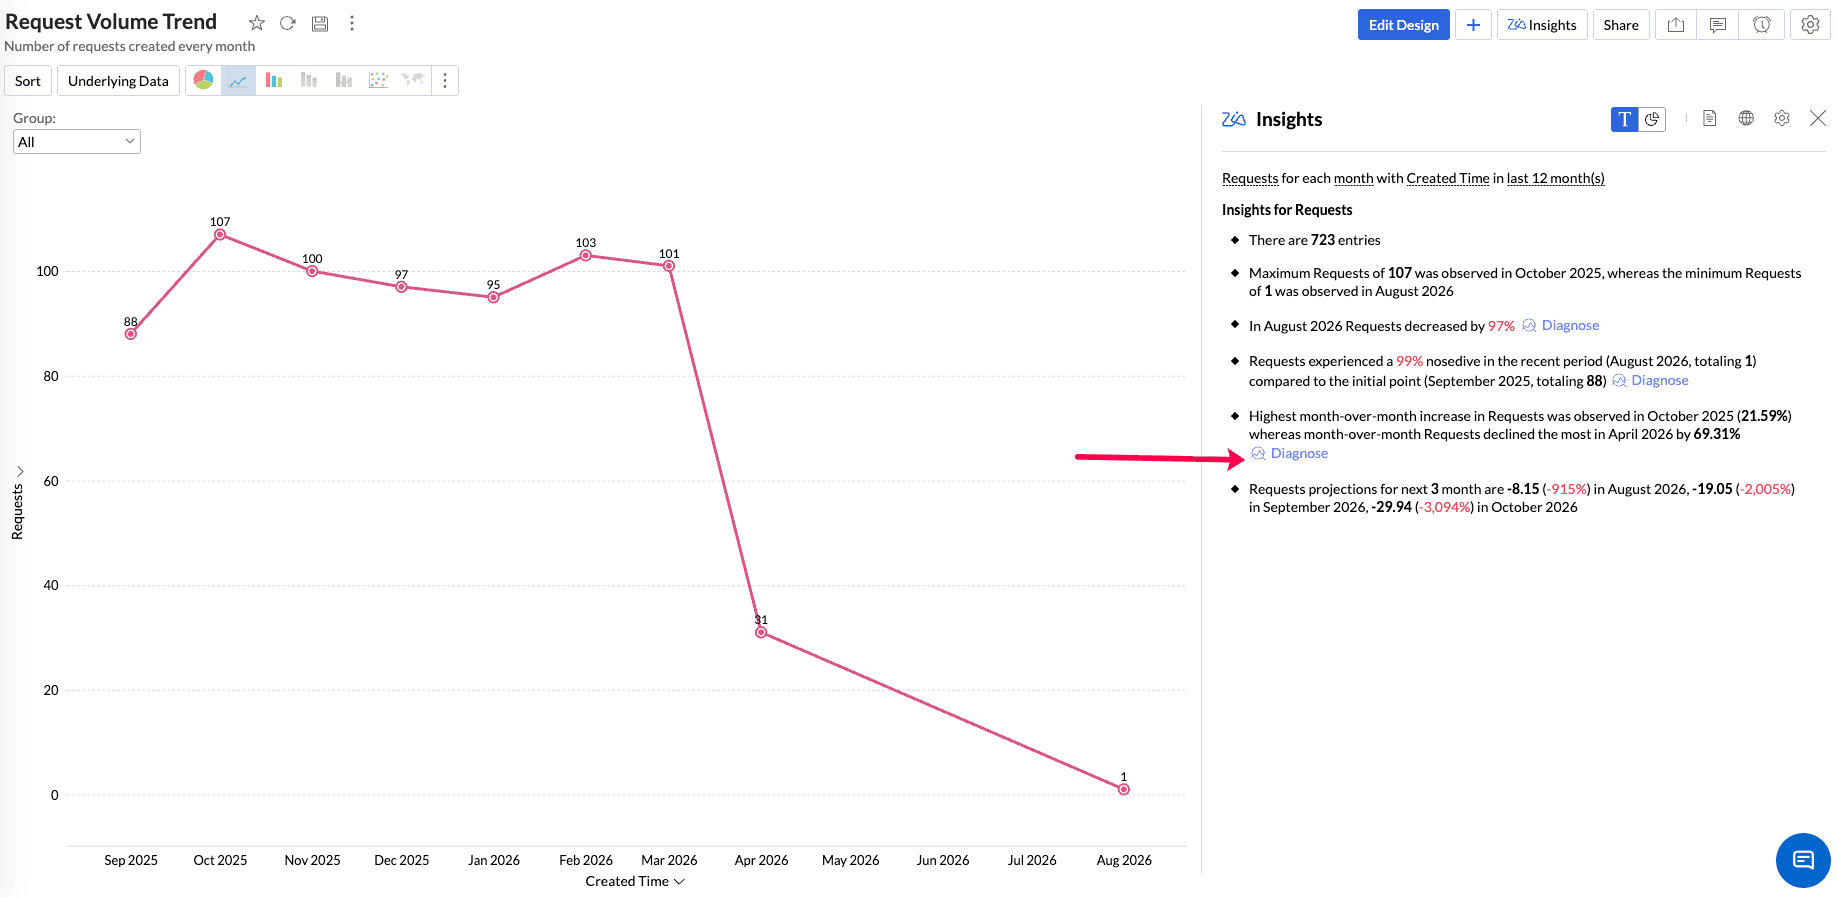
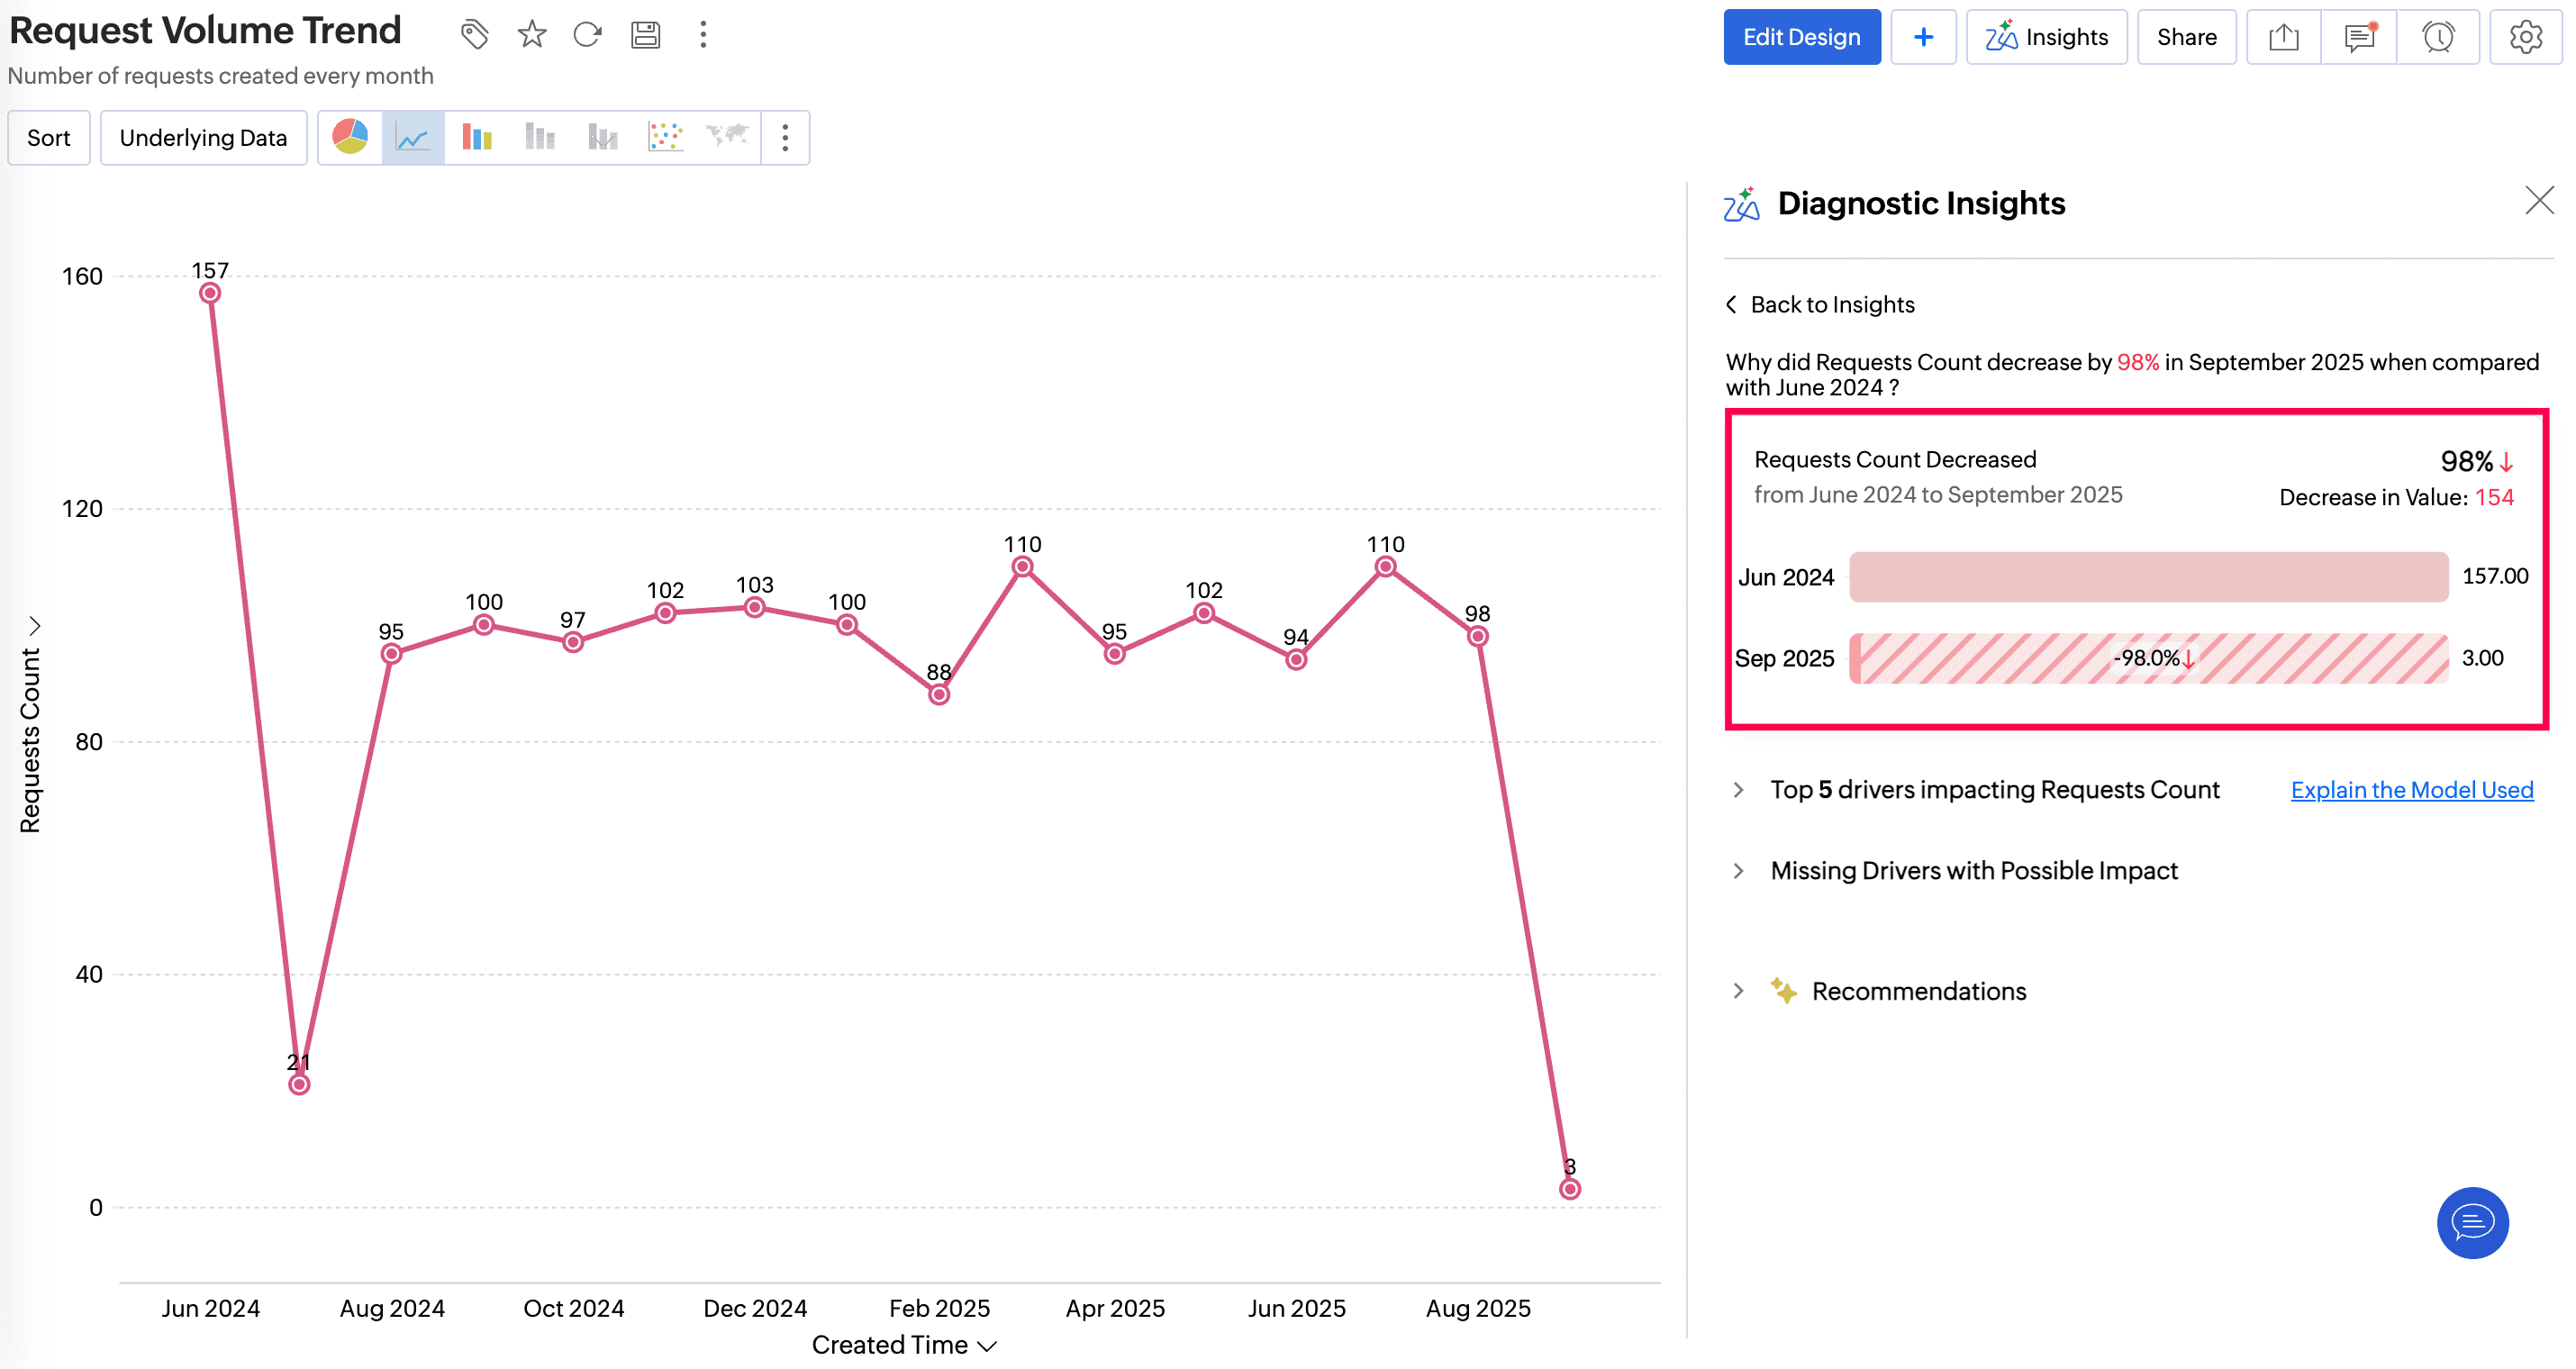
Diagnostic Insights
The Diagnostic Insights section provides an overview of the current state of the target measure, including:
- The observed trend of the measure, indicating whether it is increasing or decreasing.
- A breakdown of the factors influencing changes in the measure, along with the percentage impact of each factor on its overall rise or fall.
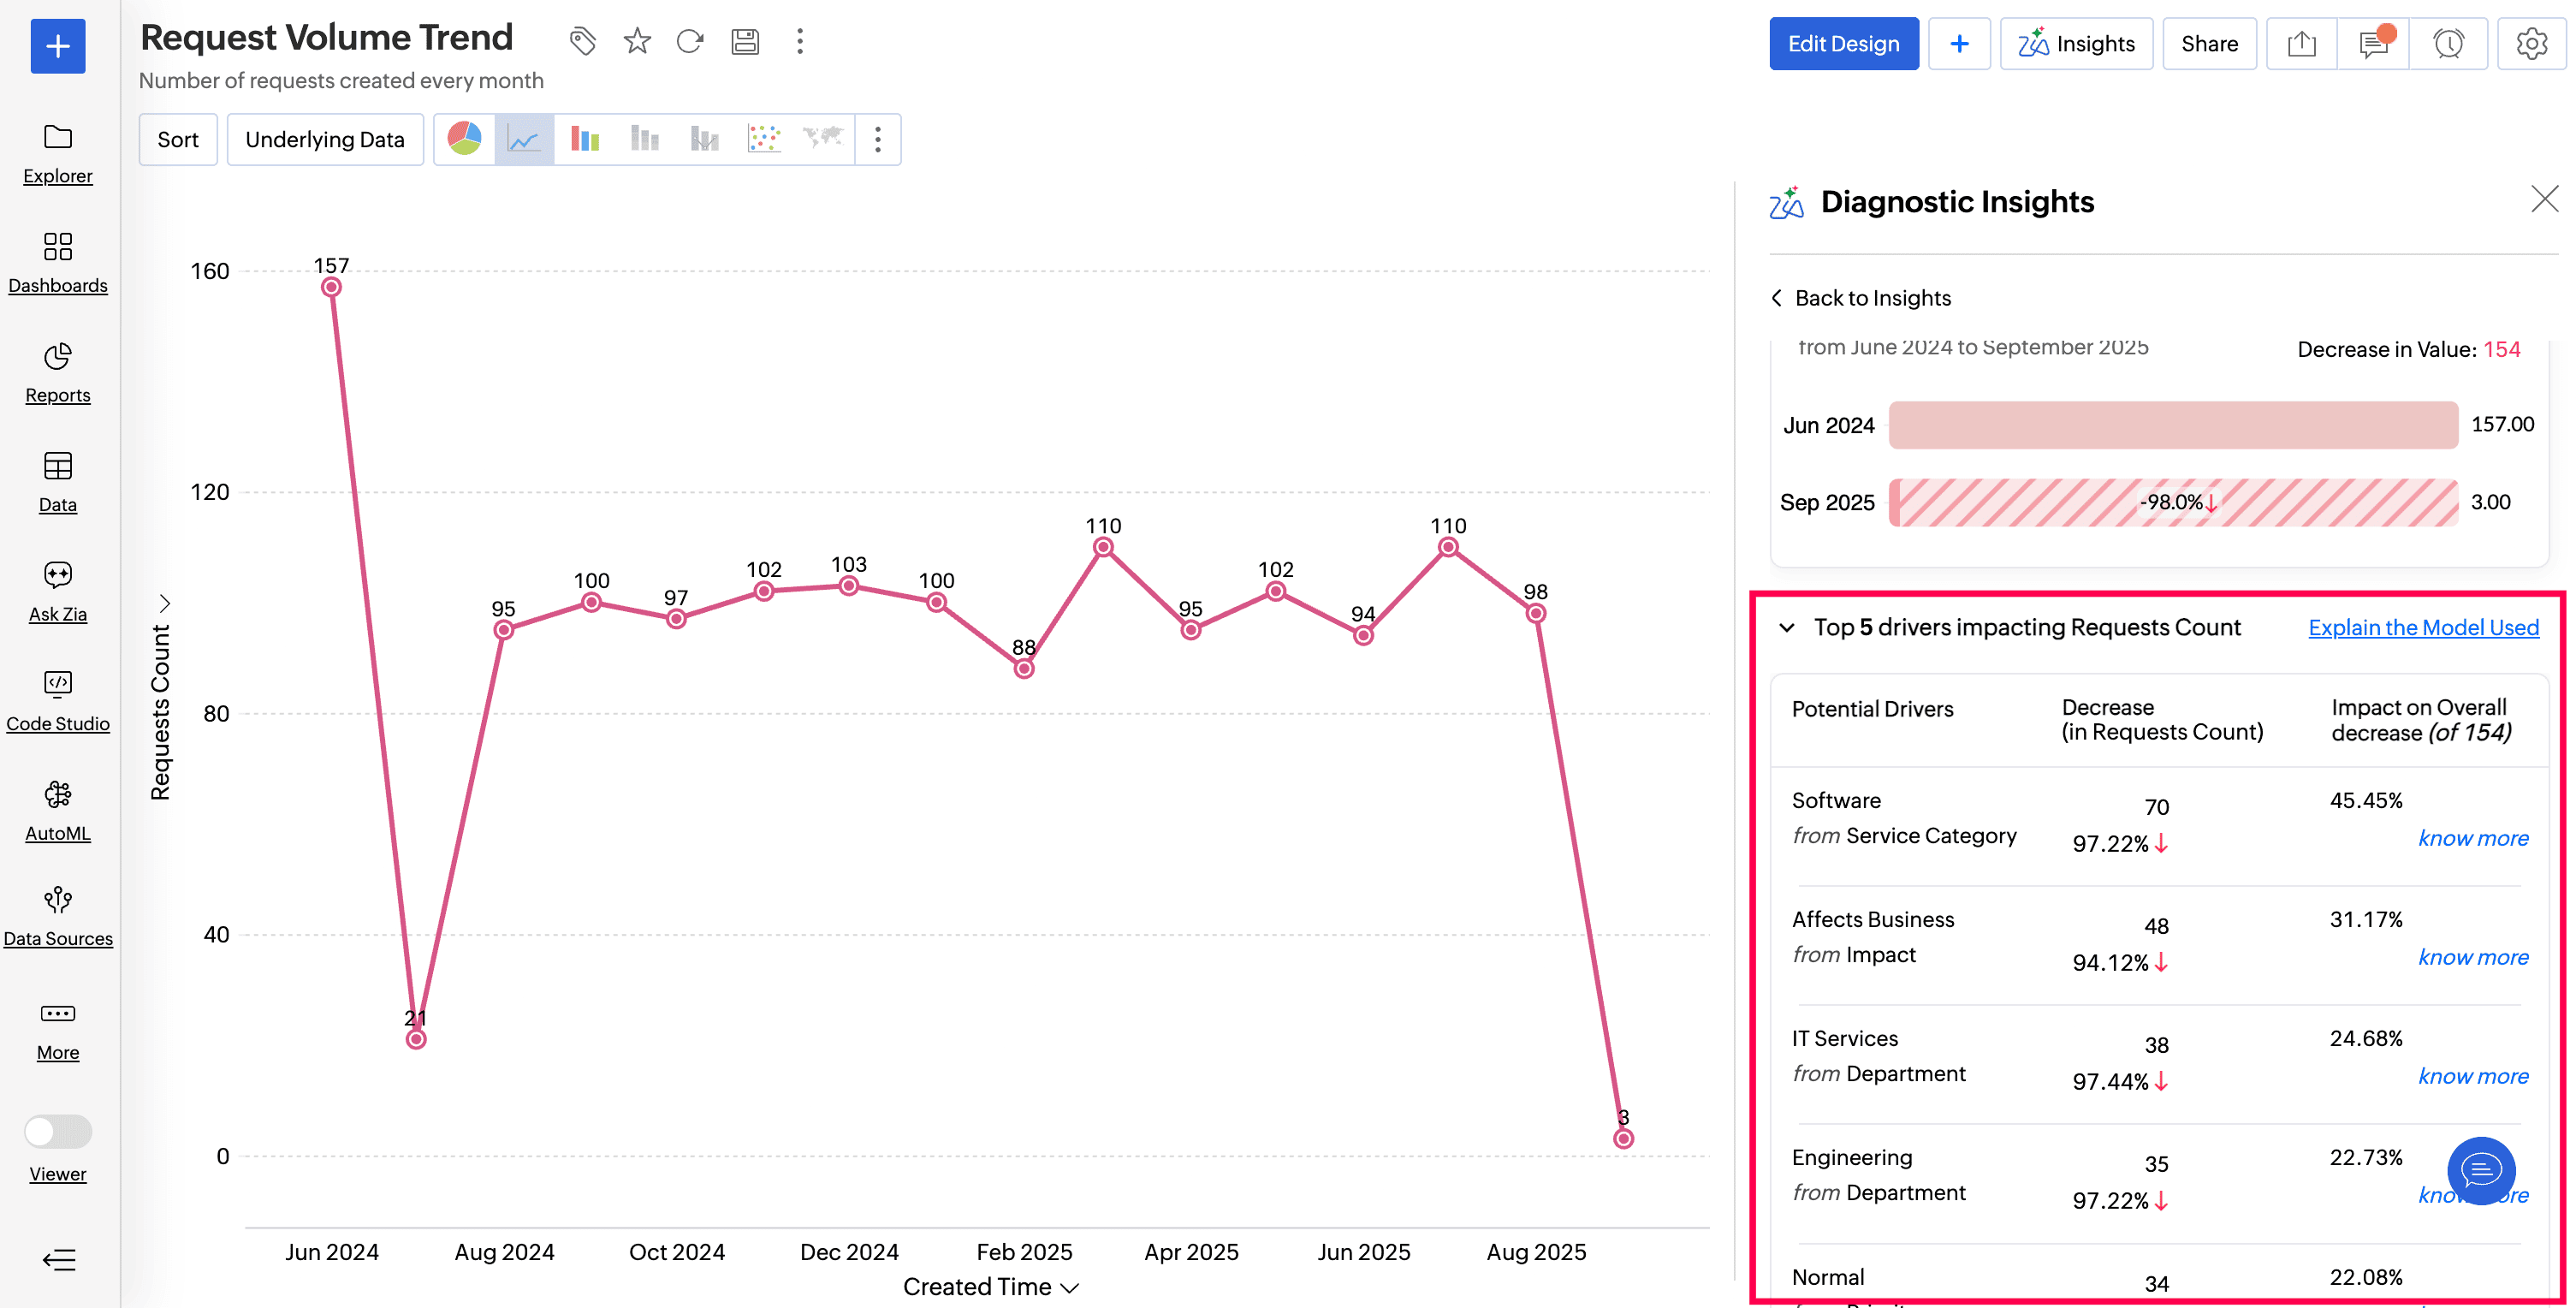
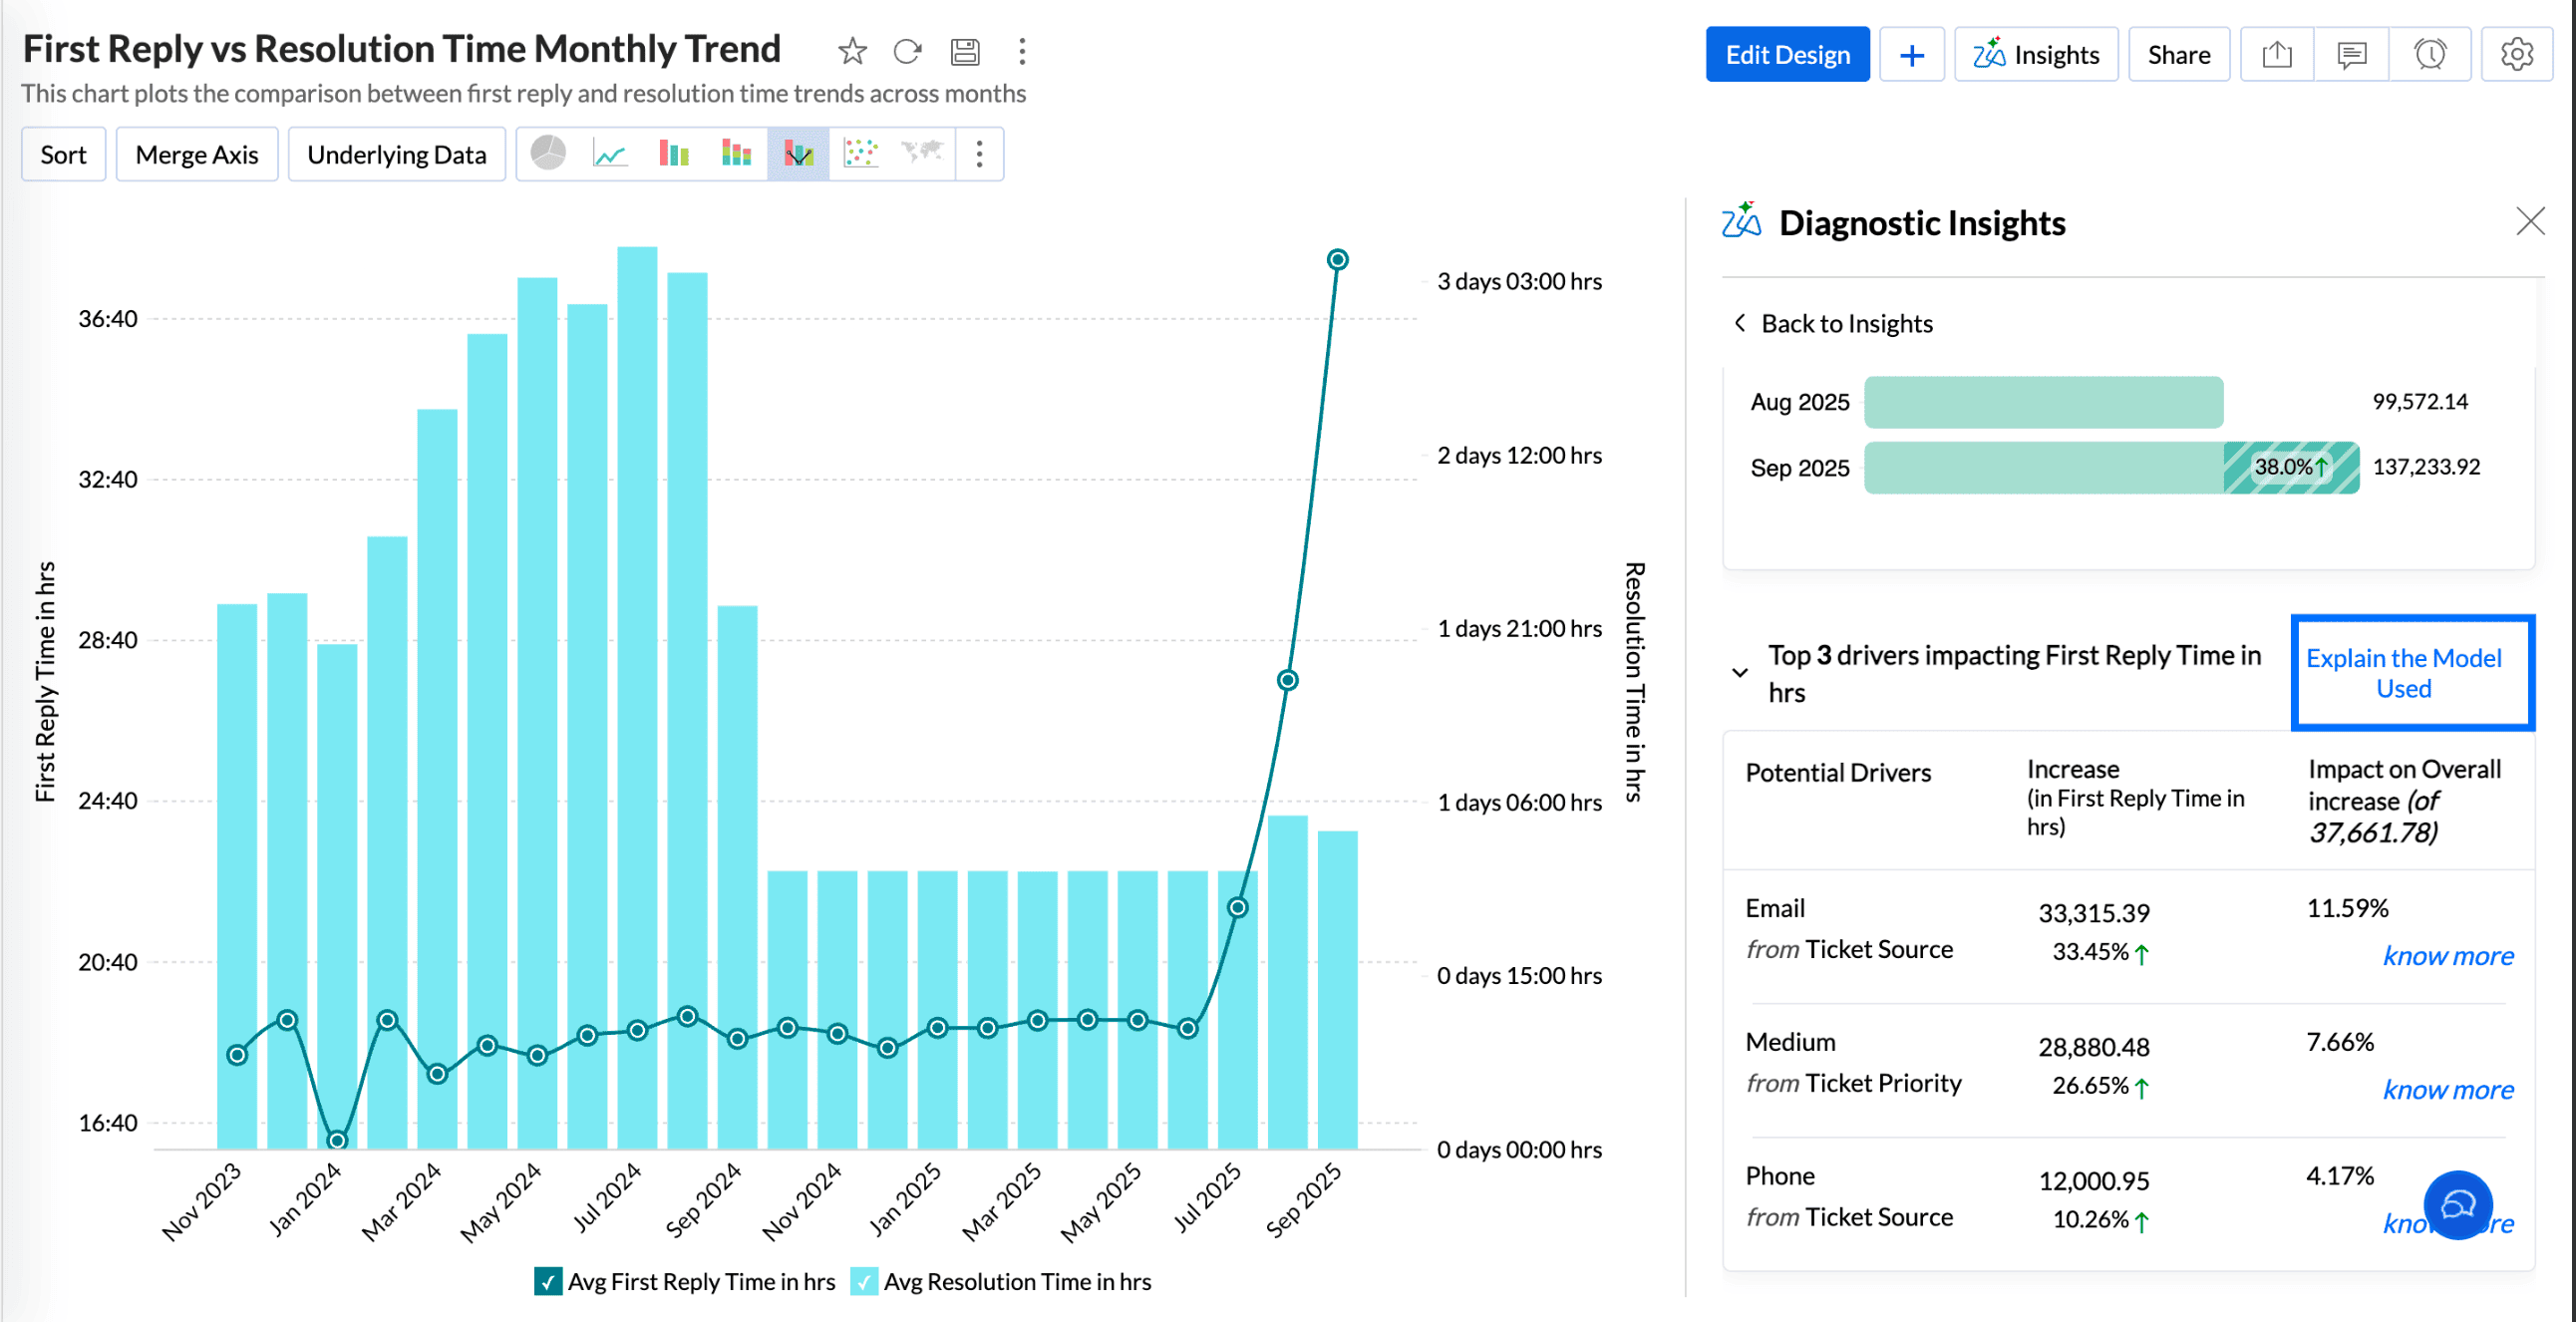
Top N drivers
The Top N drivers section provides the potential reasons behind the observed trend, along with an assessment of the impact of various factors contributing to the outcome.
Impact Details
The Impact Details section indicates the influence or contribution of a specific factor (driver) on the target measure. It quantifies the extent to which the factor affects the outcome being analysed.
Missing Drivers with Possible Impact
The Missing Drivers with Possible Impact section highlights potential factors or variables that may significantly influence the target measure but are not included in the analysis. Zia Insights evaluates these drivers and assesses their potential impact on the target measure.
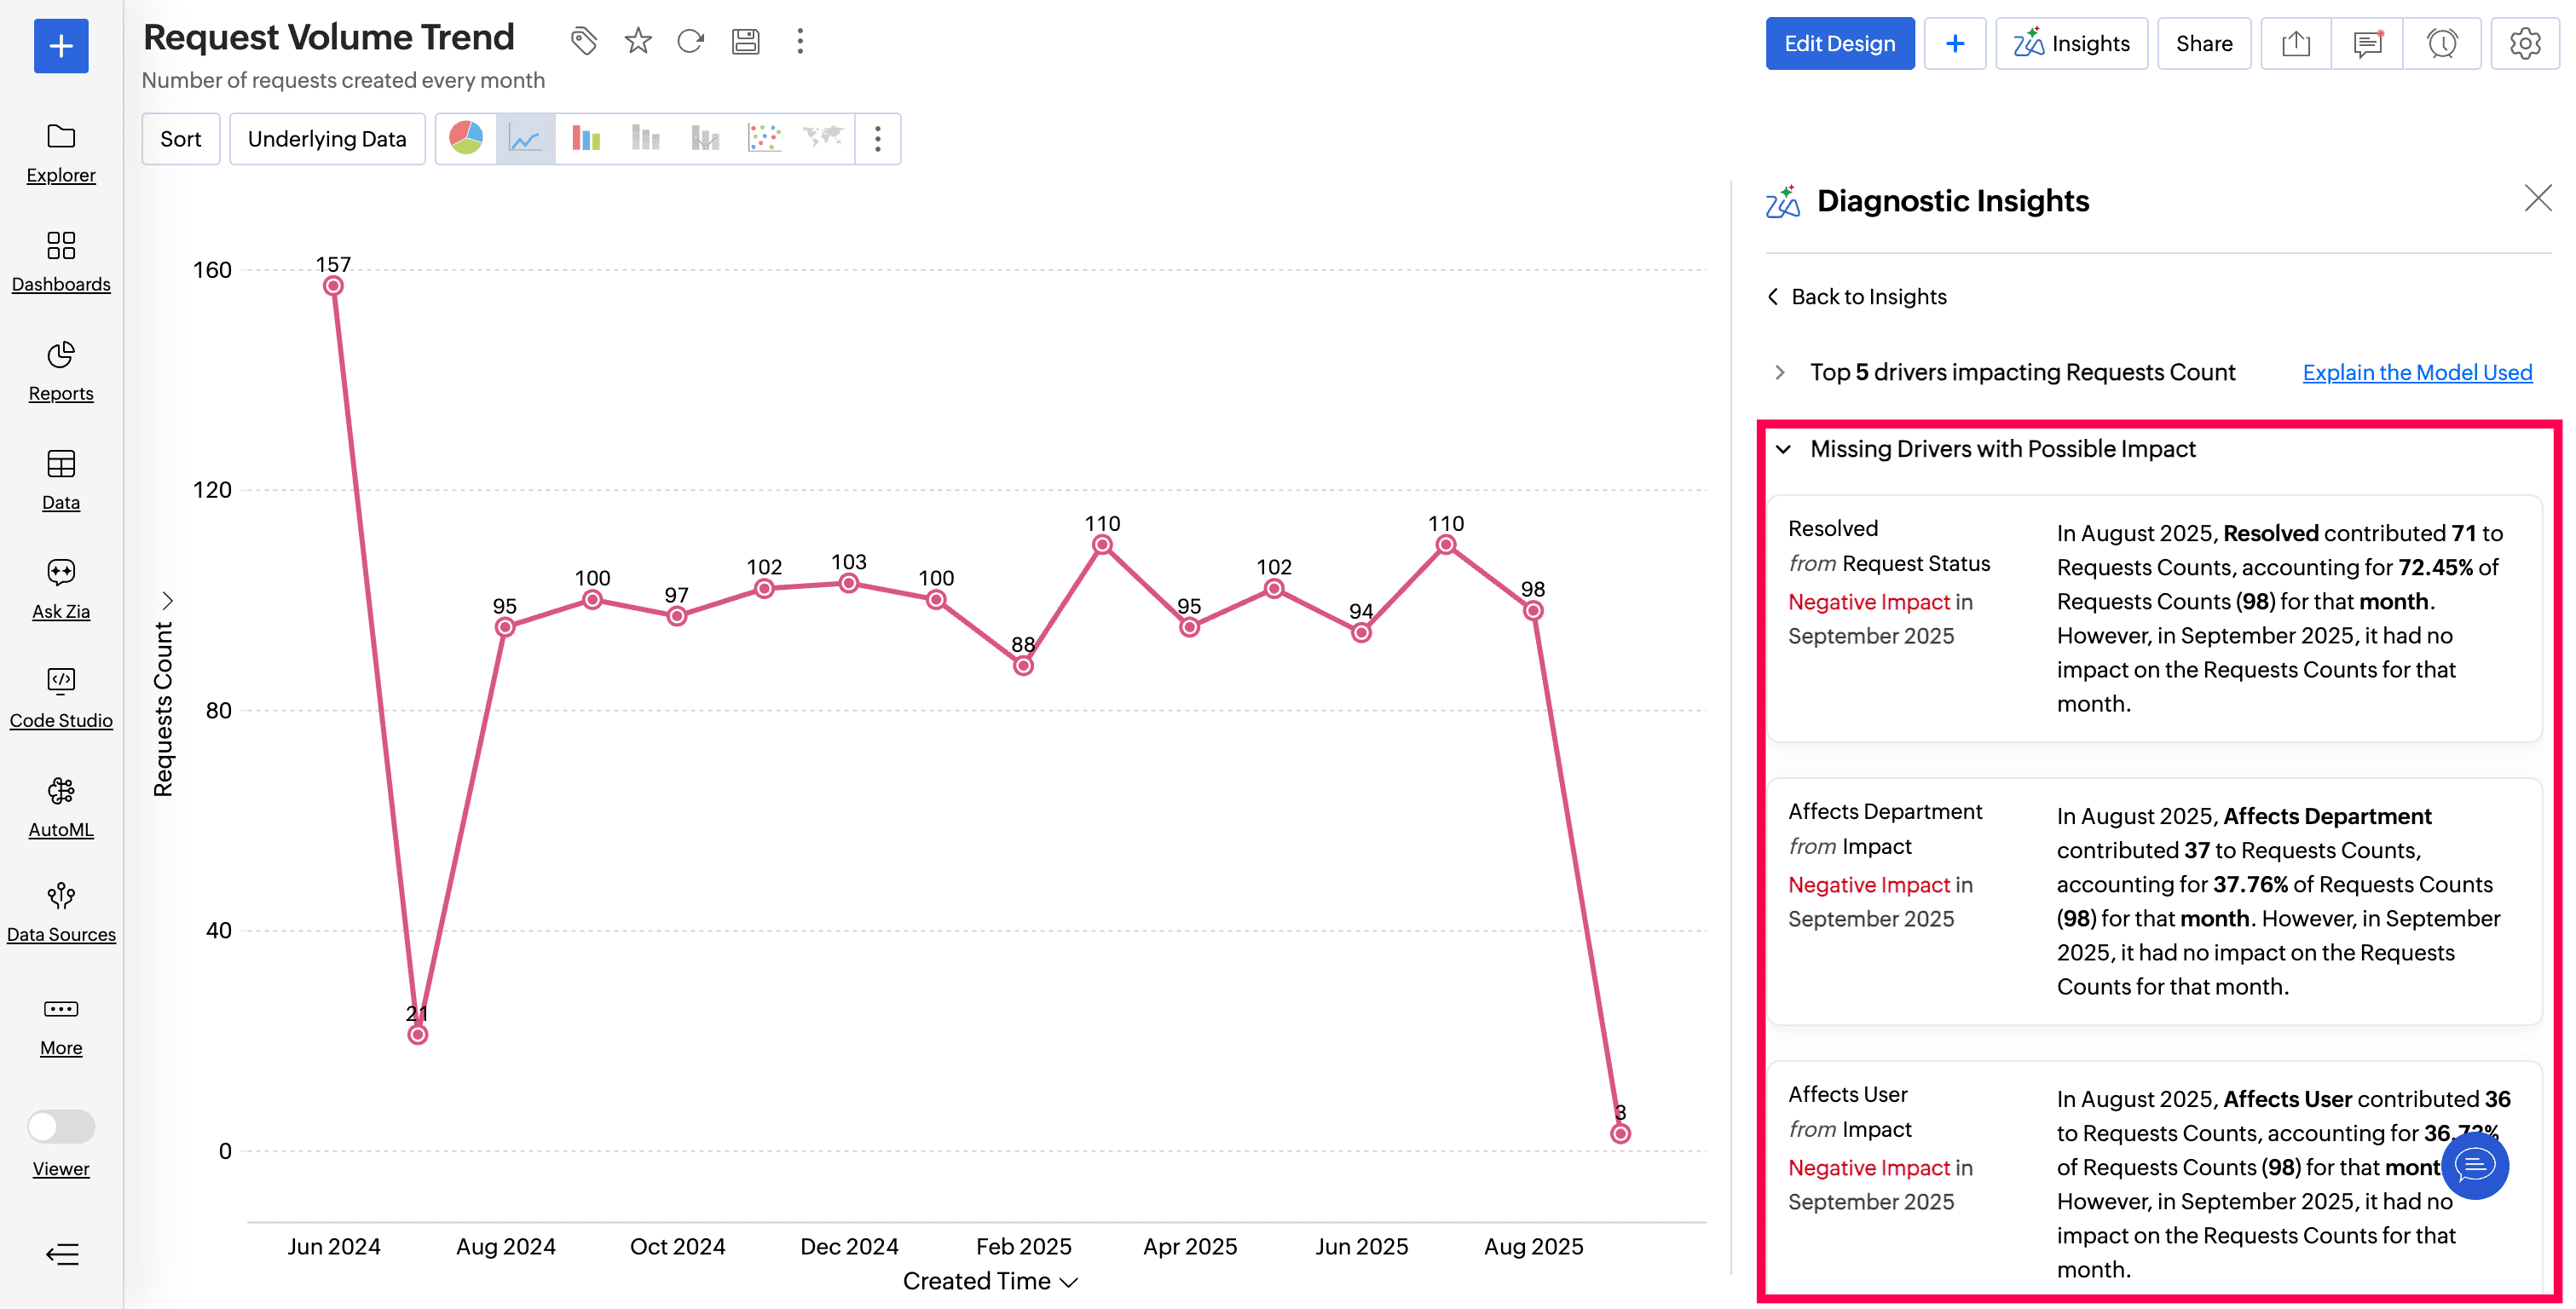
- A factor positively impacts the target measure when an increase in that variable results in an increase in the target measure.
- A factor negatively impacts the target measure when a decrease in that variable results in a decline in the target measure.
Evaluating the Key Driver Analysis
This section details the model used for identifying the key drivers and to evaluate the quality of the analysis.
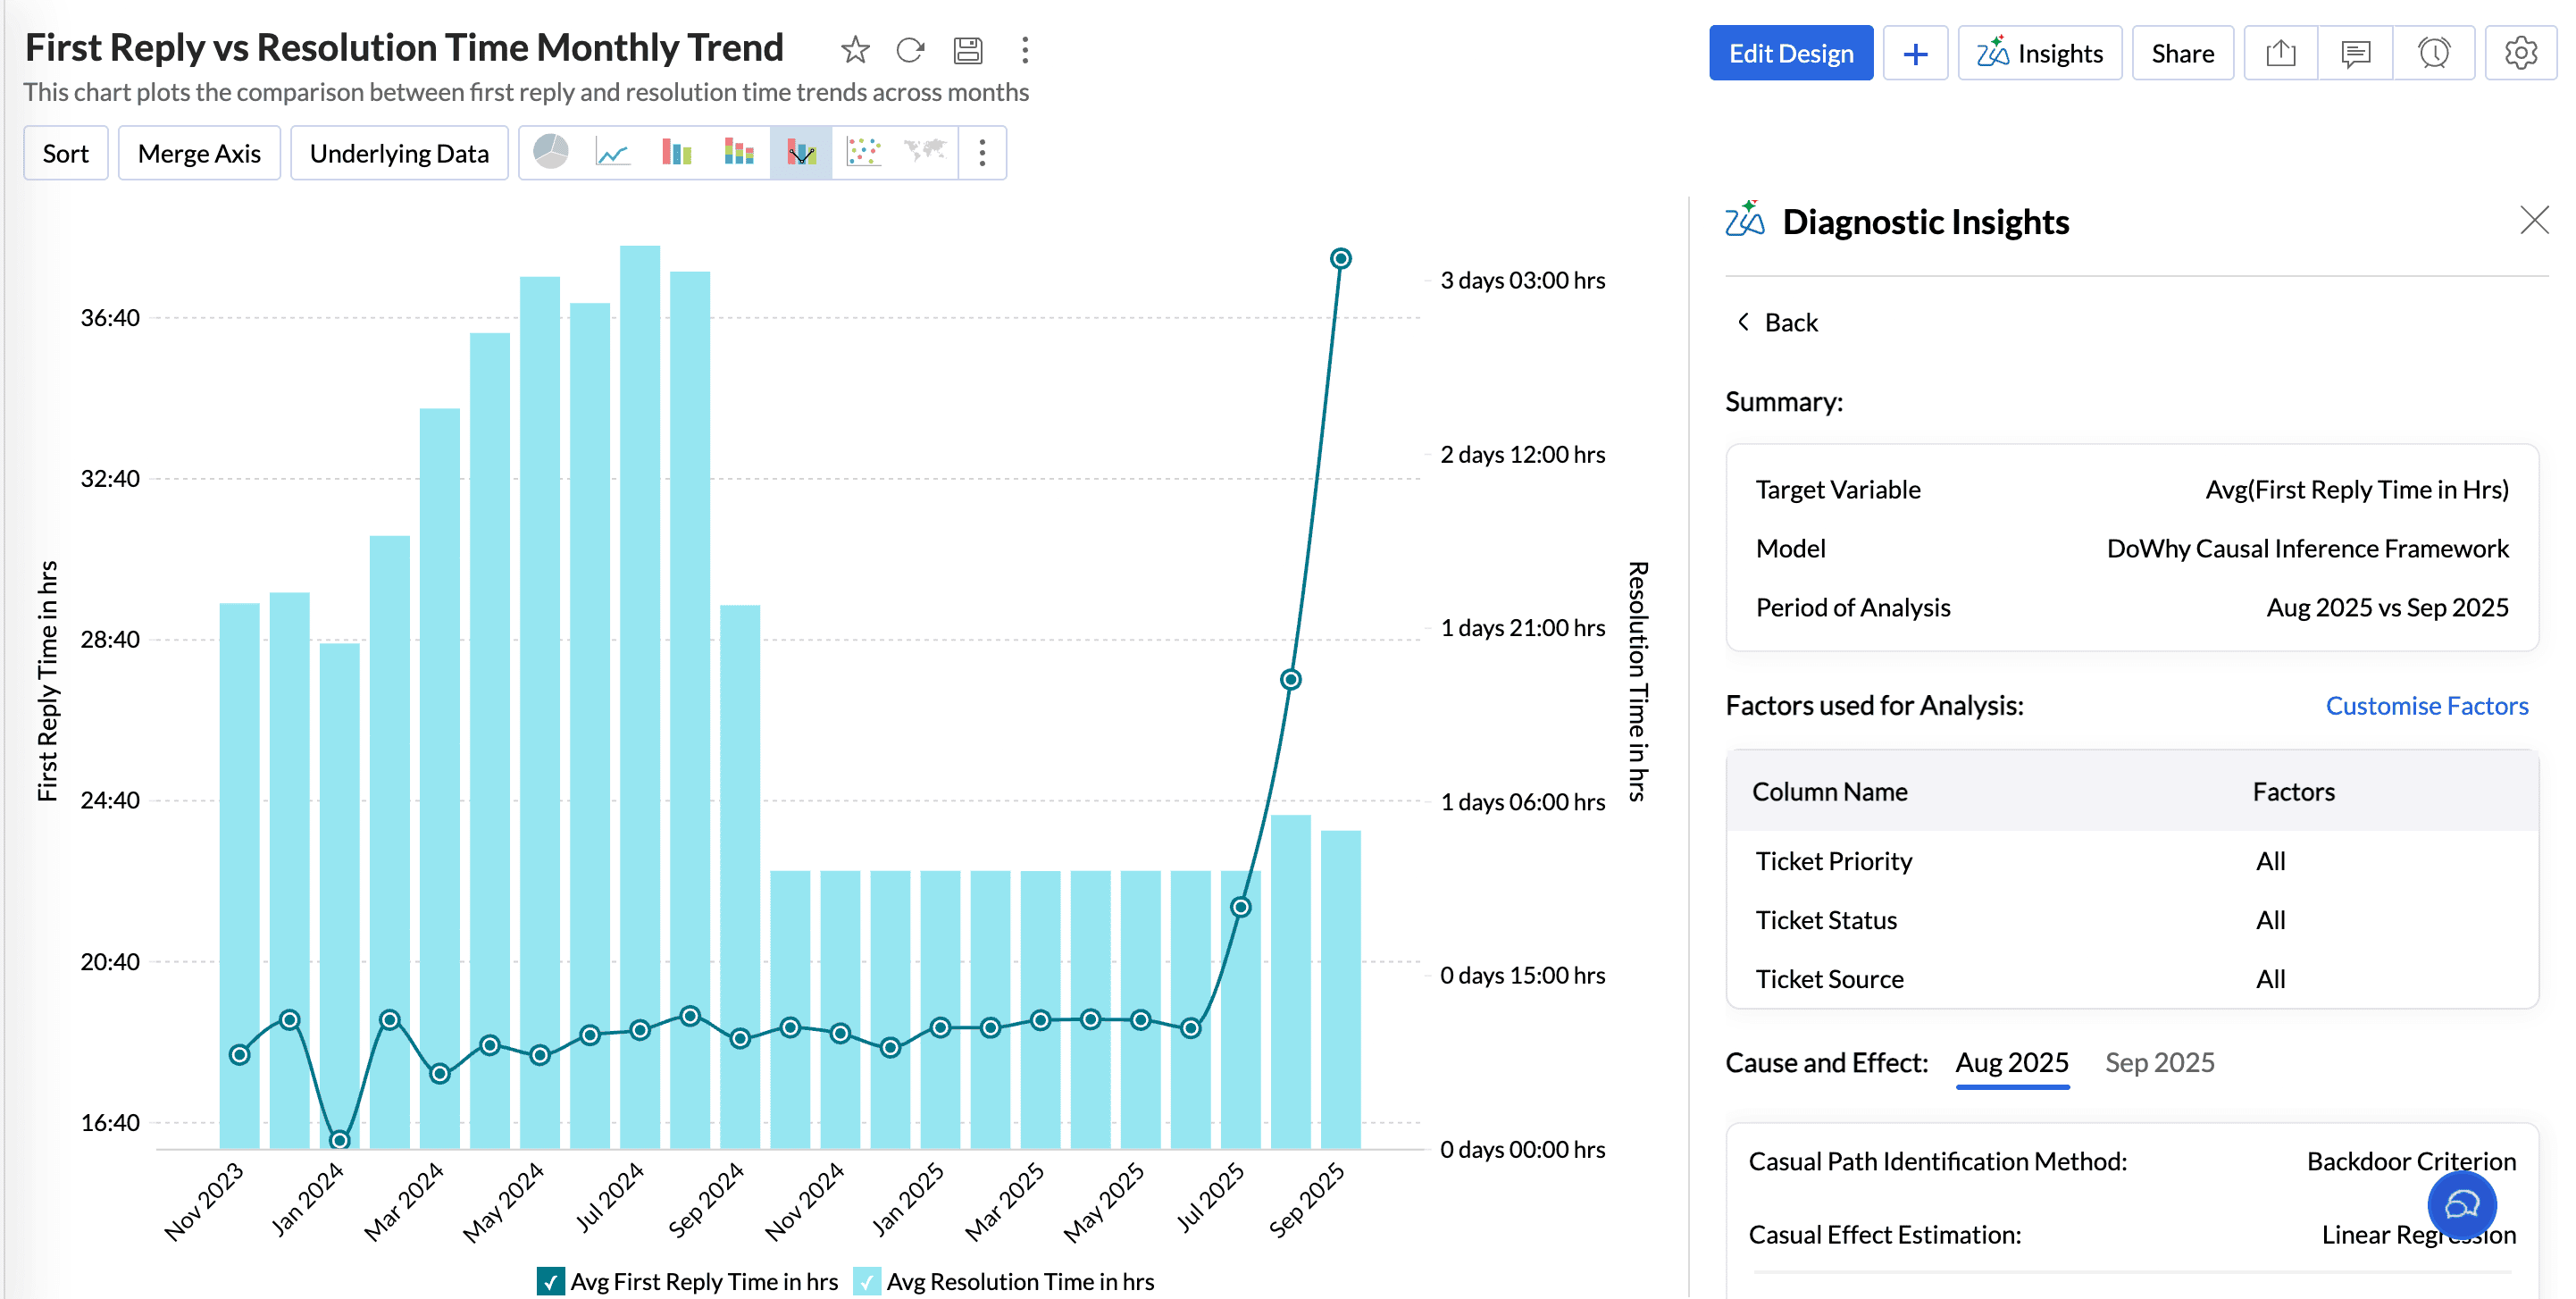
Summary
The Summary section gives an overview about the Target Variable, Model used for analysis, and the Period of analysis.
Factors Used for Analysis
This section lists all the factors used for conducting the key driver analysis.
Cause and Effect
The Cause and Effect value in key driver analysis gives the strength of the relationship between the potential drivers and the target variable, indicating how much influence the factors have on the target metric. Analytics Plus uses the Backdoor Criterion for causal path identification and Linear regression for causal effect estimation.
Evaluation Metrics
Evaluation metrics help assess the performance and the accuracy of the causal inference models.
Metric | Explanation |
Average Treatment Effect( ATE) | ATE is a statistical measure that calculates the impact of key drivers on an outcome It quantifies how much the outcome would change, on average, if a specific driver were altered. |
Edge Weight | Edge Weight measures the correlation, the strength, and direction between the target metric and key drivers. |
P-value | P-value is a statistical value used to validate a hypothesis against observed data. It measures the probability of obtaining the observed results, assuming that the null hypothesis is true. The lower the p-value, the greater the statistical significance of the observed difference. |
Confidence Interval | A confidence interval, in statistics, refers to the probability that a population parameter will fall between a set of values for a certain proportion of times |
R-squared | R-squared is a statistical measure that indicates how much of the variation of a dependent variable is explained by an independent variable in a regression model. |
Adjusted R- Squared | Adjusted R-squared measures how well a regression model explains the variability in the data, adjusting for the number of predictors. It prevents overestimation of model performance by penalizing unnecessary variables. |
F-Statistic | The F-statistic tests whether the overall model is statistically significant. A higher F-statistic indicates that the model performs significantly better than a model that predicts the mean outcome. |
Bayesian Information Criterion (BIC) | Bayesian Information Criterion (BIC) is a statistical metric used to evaluate the goodness of fit of a model while penalizing for model complexity to avoid overfitting. |
Akaike Information Criterion | The Akaike Information Criterion (AIC) is a metric used to compare different statistical models and determine which one best balances goodness of fit and complexity. |