Bandwidth Monitoring
Get visibility into every application, interface, and usage trend before problems surface
- Identify which applications and users are consuming bandwidth before saturation affects your users
- Detect congestion hotspots across WAN links, interfaces, and wireless infrastructure in real time
- Forecast bandwidth growth and make evidence-based capacity decisions without unnecessary spend
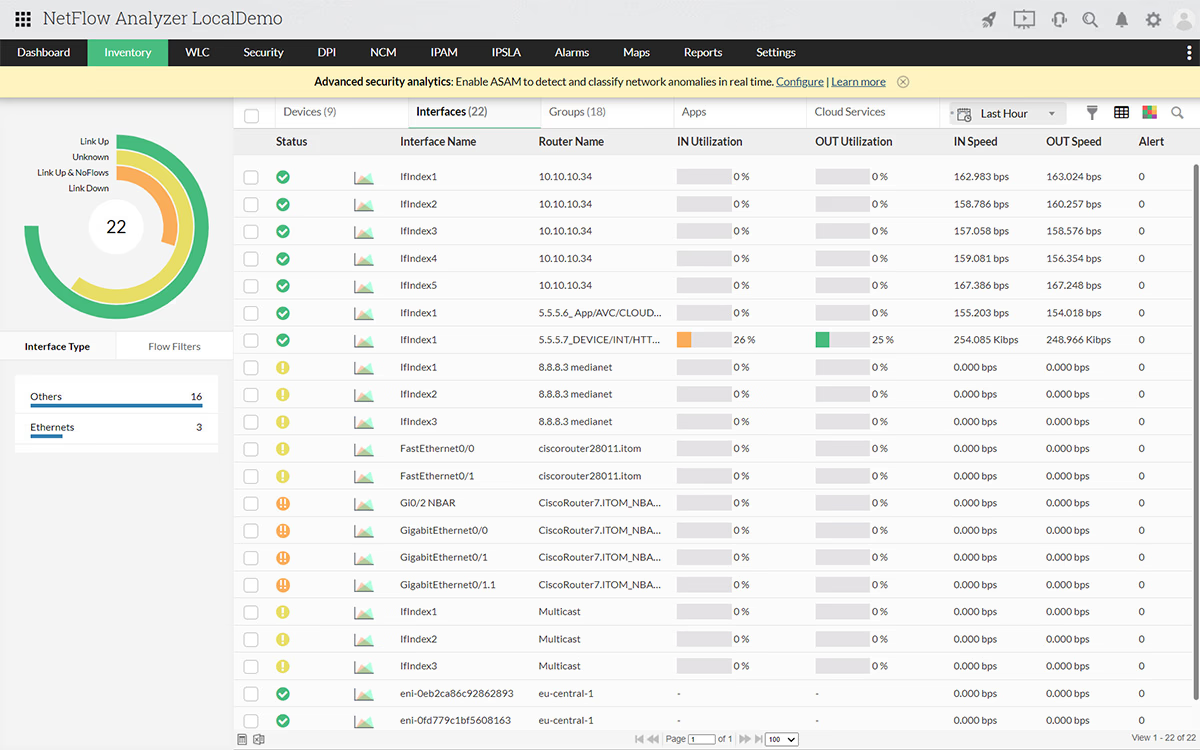
What is bandwidth monitoring?
Bandwidth monitoring measures data moving across your network, tracks which users, applications, and devices are responsible, and flags unusual behavior before it becomes an outage. The core problem for most network admins is not a lack of data but a lack of context. SNMP confirms a link is saturated, whereas bandwidth monitoring tells you why, so you can act immediately.
How bandwidth monitoring works in NetFlow Analyzer?
Application Visibility
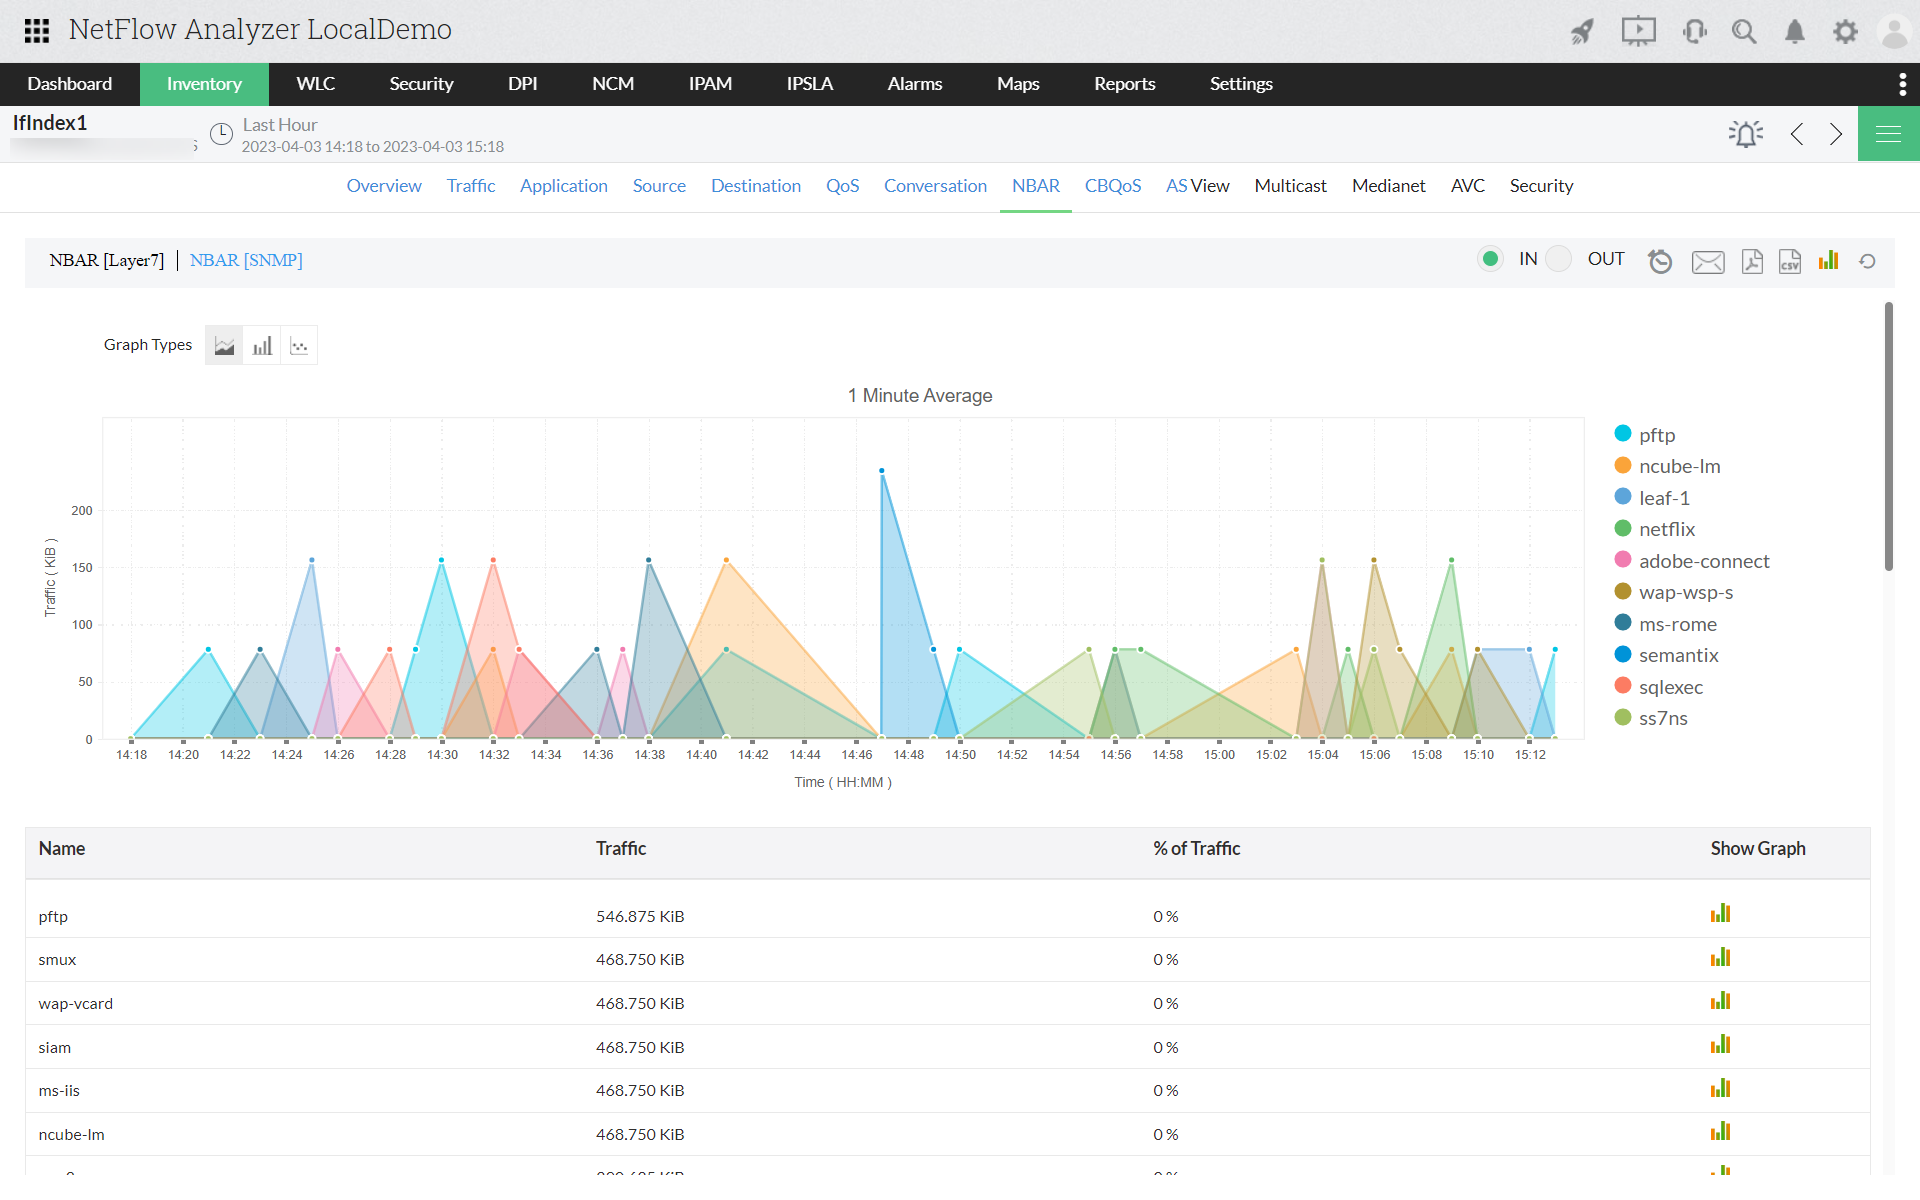
Application-level visibility is where bandwidth understanding begins. Interface utilization tells you congestion exists and application data tells you what caused it and which traffic to prioritize.
- Use Cisco NBAR2 to classify Layer 7 traffic, including applications tunneling inside standard protocols to avoid port-based filters
- Identify which applications consume the most bandwidth per interface and time window, including unscheduled or shadow IT traffic
- Apply targeted shaping policies to protect business-critical applications without disrupting other traffic on the same link
Traffic Attribution
Identifying responsible users, hosts, and conversation pairs reduces troubleshooting time from hours to minutes and eliminates the guesswork that SNMP-only monitoring forces on every incident.
- Surface top bandwidth consumers across all monitored interfaces in a continuously updated real-time view
- Drill into current, average, and peak utilization by host, application, and protocol from any interface
- Trace traffic to specific hosts and resolve incidents before users finish describing the problem to the helpdesk
Congestion Mapping
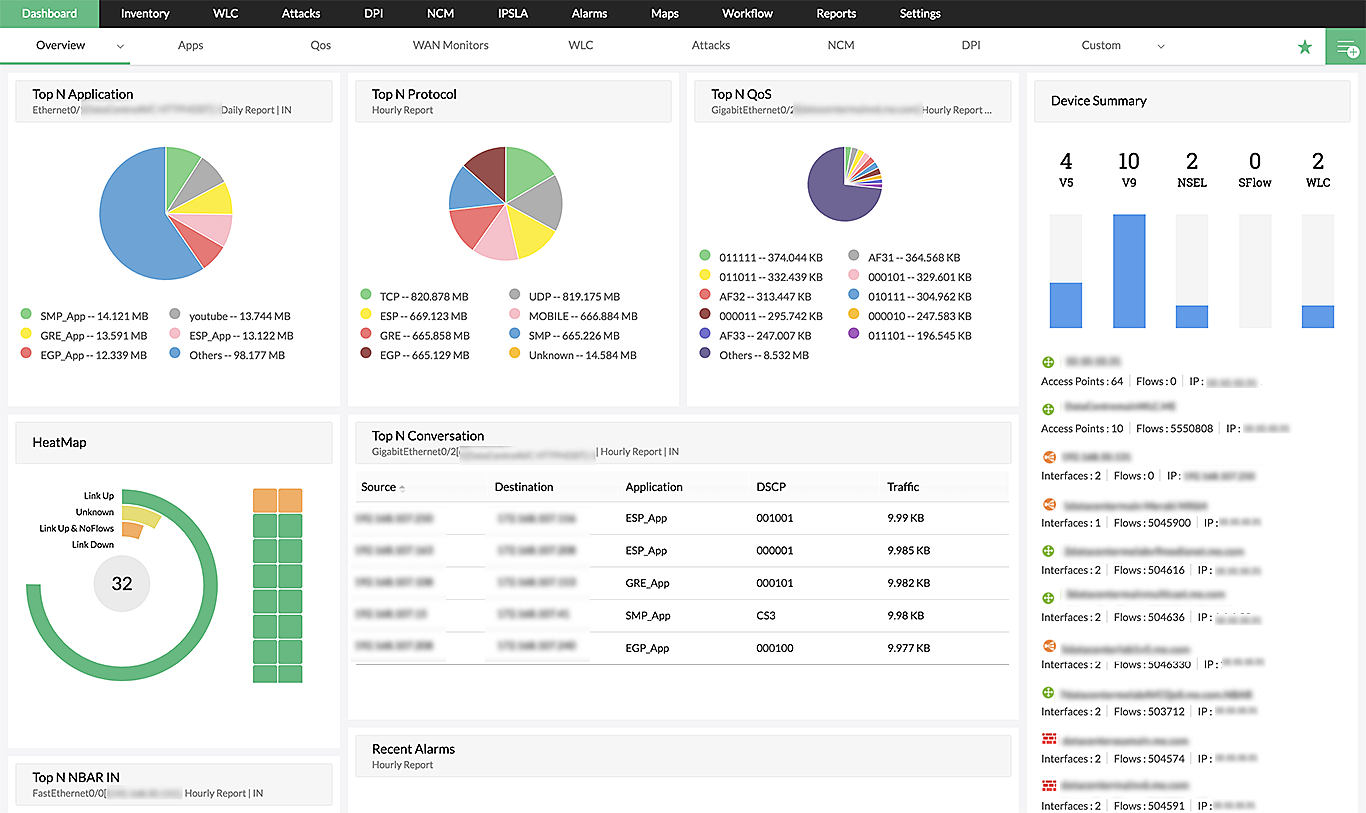
Locating congestion precisely determines the remediation path. An overloaded WAN link, a saturated aggregation switch, and a misconfigured traffic path each require a different response.
- Map bandwidth consumption to specific interfaces, WAN links, and traffic paths across the full network topology
- Distinguish recurring congestion hotspots from isolated traffic spikes to address root causes, not symptoms
- Identify persistent bottlenecks that affect SLA compliance and separate them from predictable peak-hour patterns
Wireless Monitoring
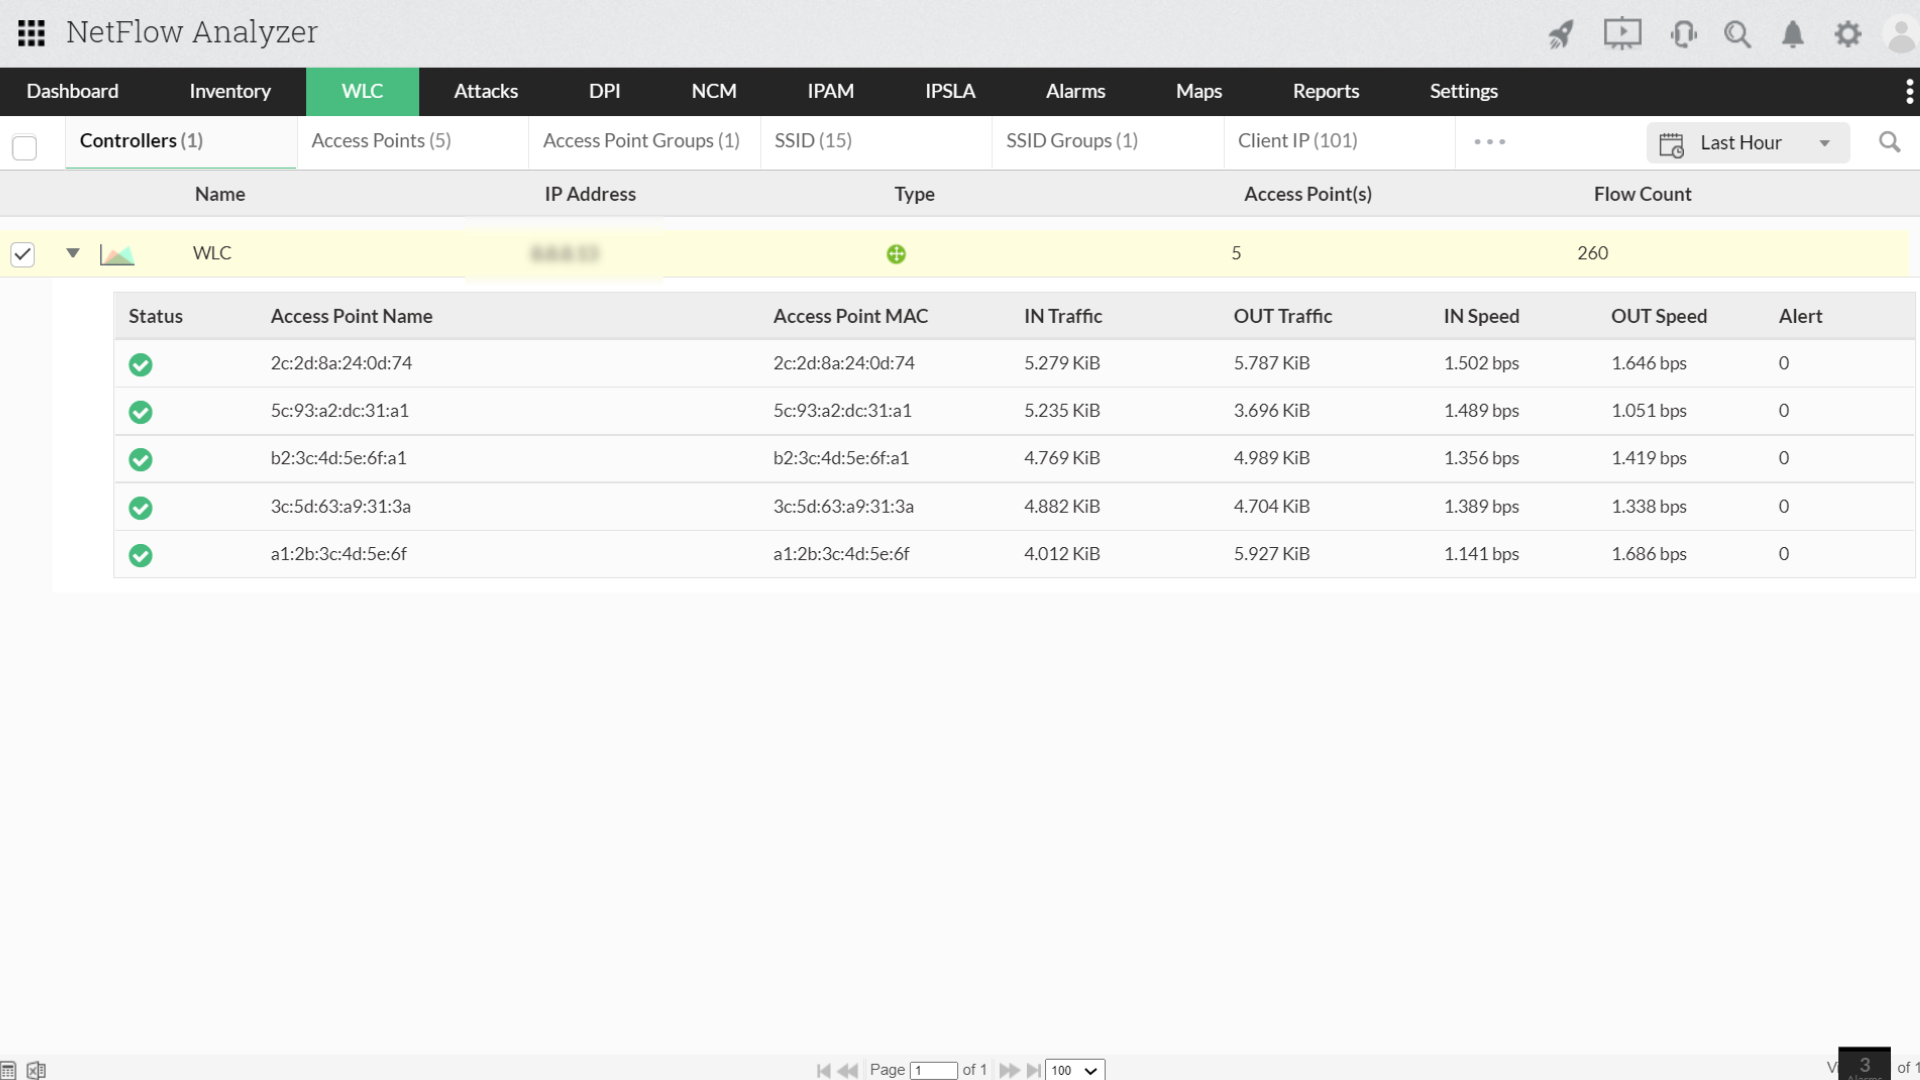
Wired monitoring leaves the wireless layer invisible. Guest SSIDs, rogue devices, and high-consumption wireless clients saturate shared uplinks without appearing in wired interface data.
- Monitor per-SSID and per-client bandwidth consumption in the same dashboards as wired interface data
- Track client IP and MAC addresses to identify specific wireless users generating disproportionate traffic
- Detect rogue access points operating outside managed infrastructure before they affect wired network performance
Proactive Alerting
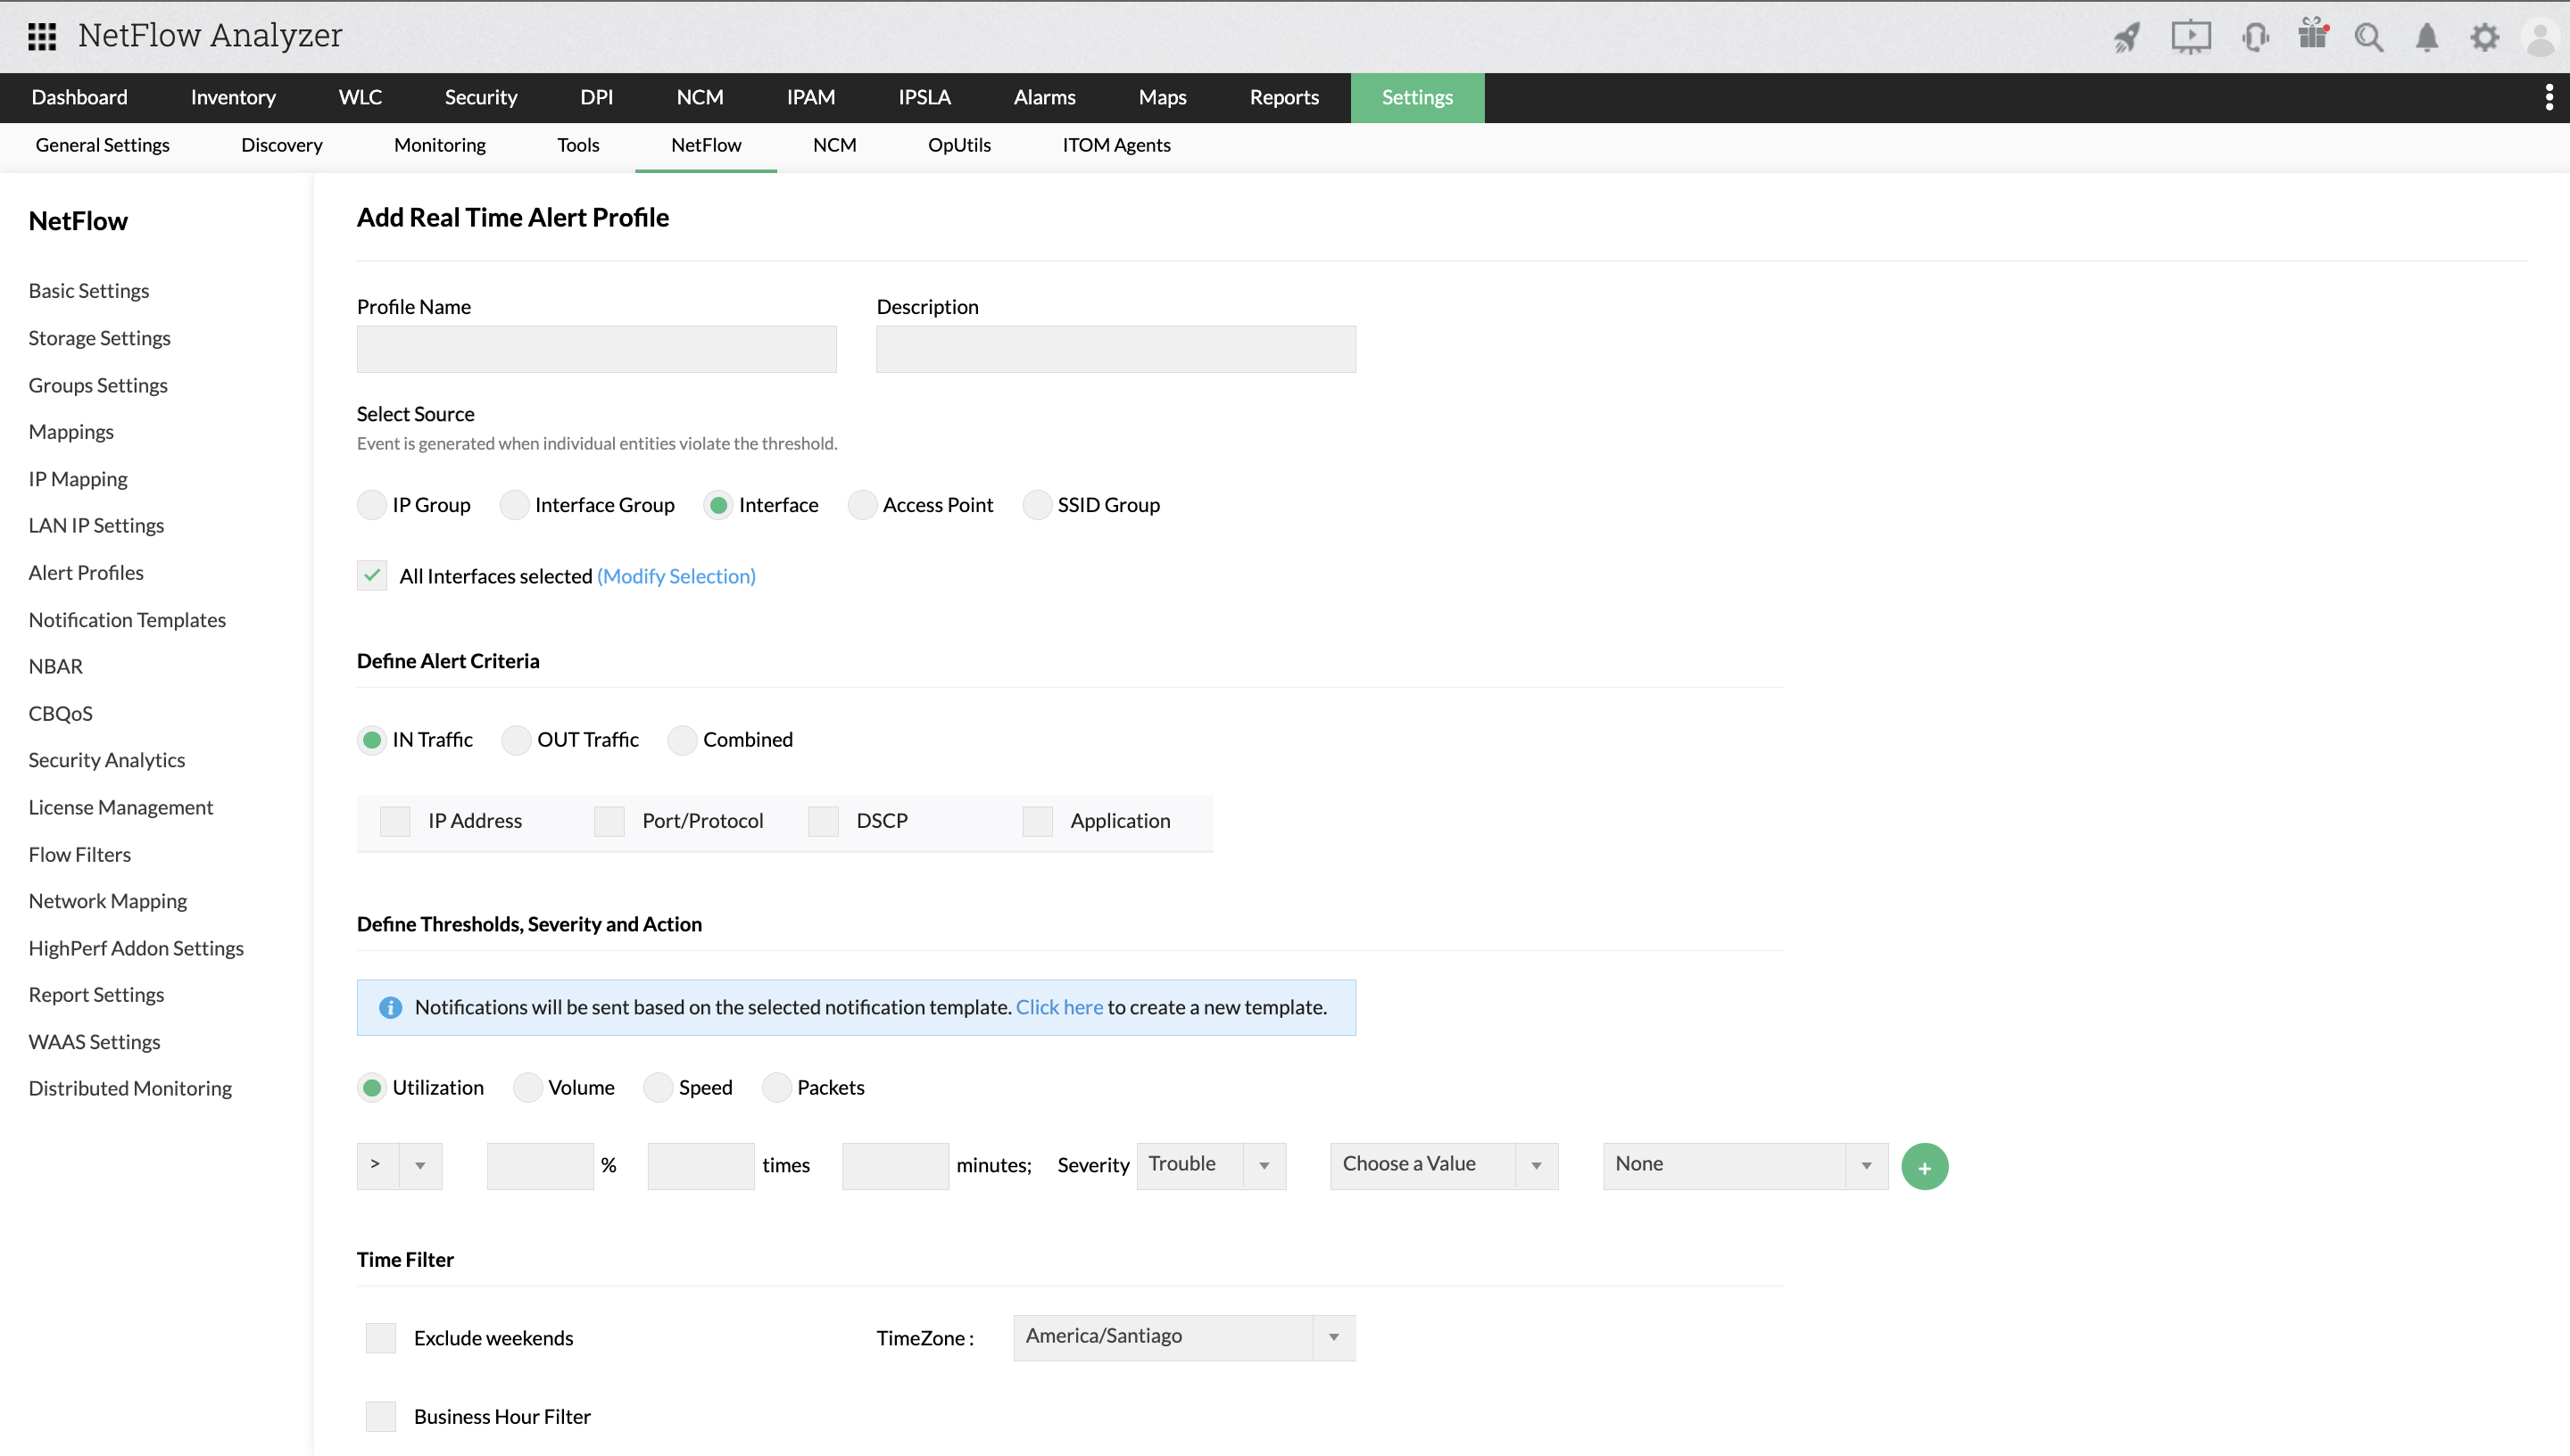
Proactive alerting requires thresholds calibrated to each link's traffic profile, not generic limits applied uniformly across infrastructure with different utilization baselines.
- Configure instantaneous thresholds for critical links where any utilization spike represents an immediate operational risk
- Apply sustained thresholds that filter burst noise while catching persistent saturation requiring intervention
- Route high-severity alerts to email, SMS, Slack, or ITSM platforms and auto-create tickets in ServiceNow on breach
Capacity Planning
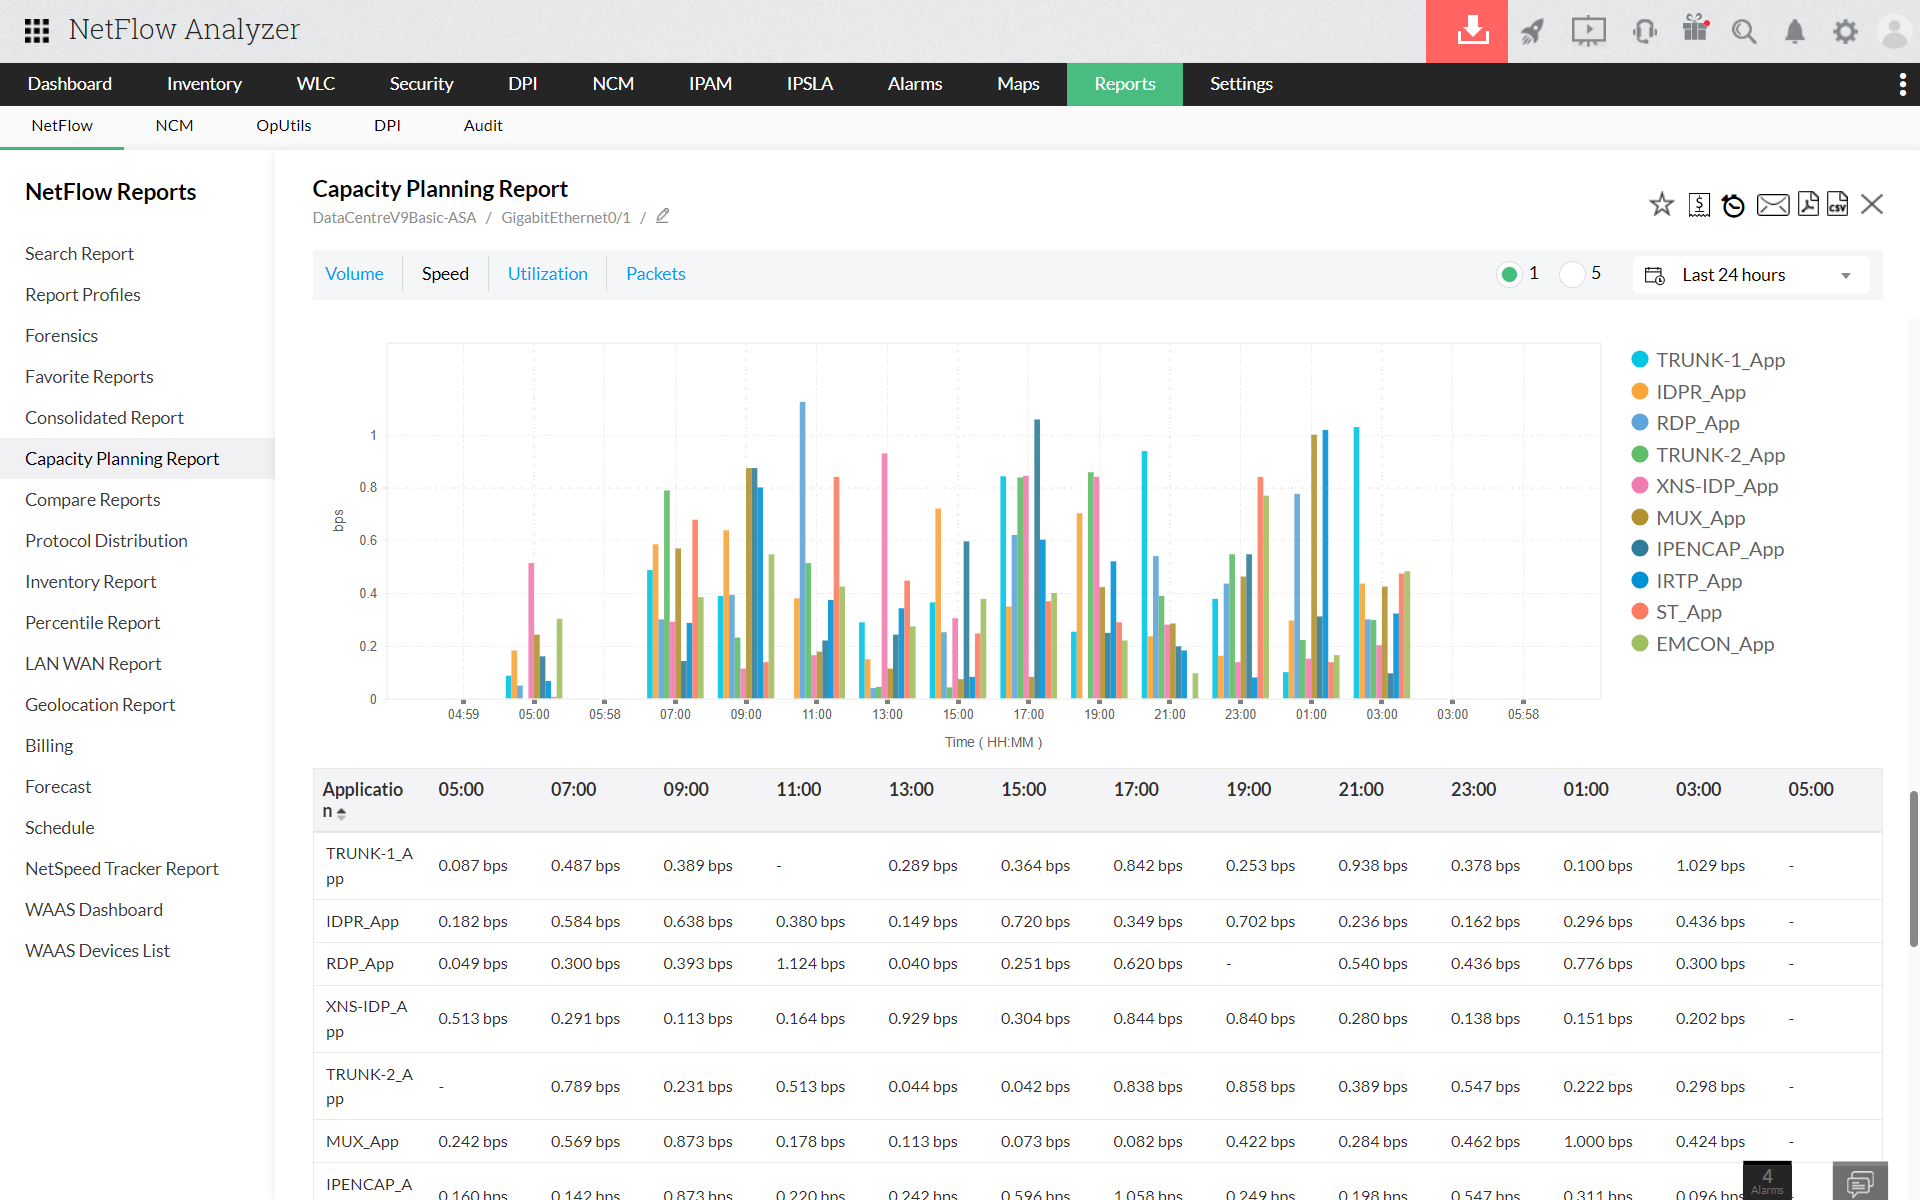
Capacity planning answered with measured data prevents both premature upgrades and avoidable saturation. The same flow records that support real-time monitoring also support long-term forecasting.
- Retain flow records across configurable time windows and analyze utilization trends over days, weeks, or months
- Apply statistical trend-based forecasting to project when links will reach saturation based on actual usage trajectories, not estimates
- Identify whether rescheduling backup jobs or adjusting traffic policies resolves
capacity pressure without additional bandwidth spend
Frequently Asked Questions
Find answers to common questions about our platform and services.