You’ve always been able to resolve issues before they reached your end users. But solving issues quickly is only half the story. The real challenge is uncovering the exact reason behind a spike or performance drop. Imagine you notice sudden traffic growth that threatens application performance, leading to outages and revenue loss. Visibility tools help you see who and what is consuming bandwidth. With NetFlow Analyzer, you can instantly identify top users, applications, and protocols and fix the immediate fault. But understanding the true cause requires more than viewing current traffic. Effective monitoring also means going back in time to examine the traffic patterns that triggered the spike. This is where advanced Forensics Report take over.
Deeper insights with Forensics Report
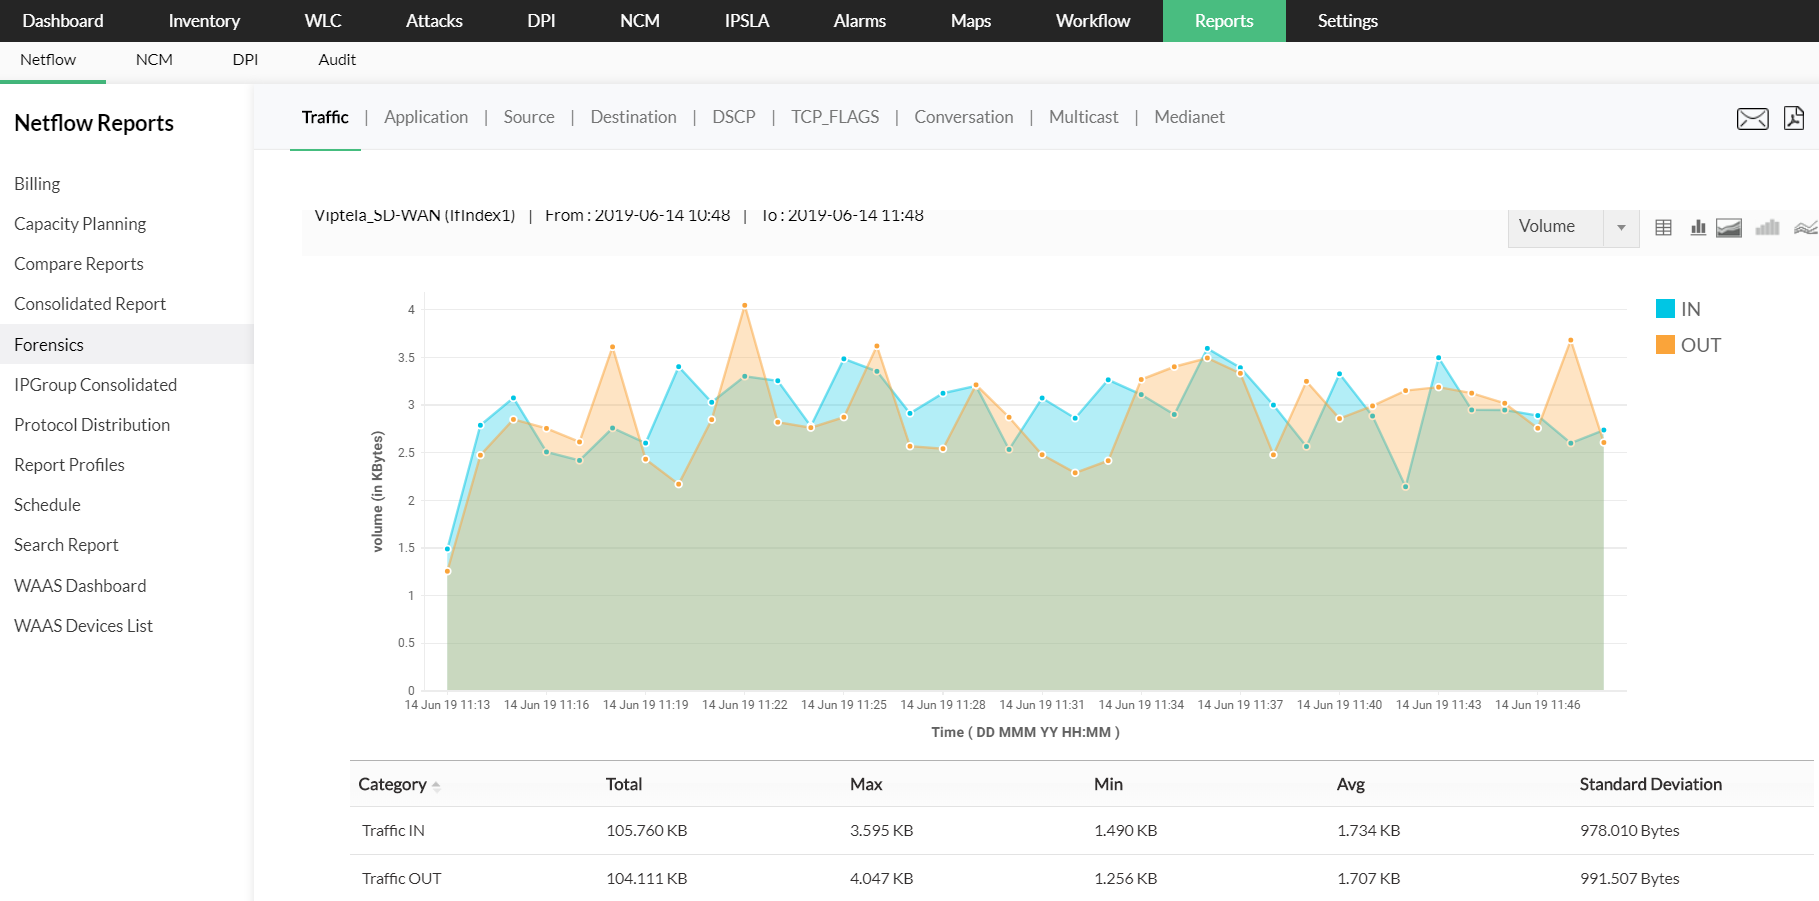
NetFlow Analyzer's Forensics Report let you look as far back as needed and retrieve actionable insights that reveal how and why network anomalies occurred. This transforms the way you troubleshoot, giving you the ability to dissect raw traffic data and investigate issues at a granular level. You can generate report based on multiple criteria and choose whether the data should match one or all selected conditions. The flexibility to specify exact time ranges ensures that every analysis aligns with the moment the anomaly occurred.
The hidden details network forensics brings to light
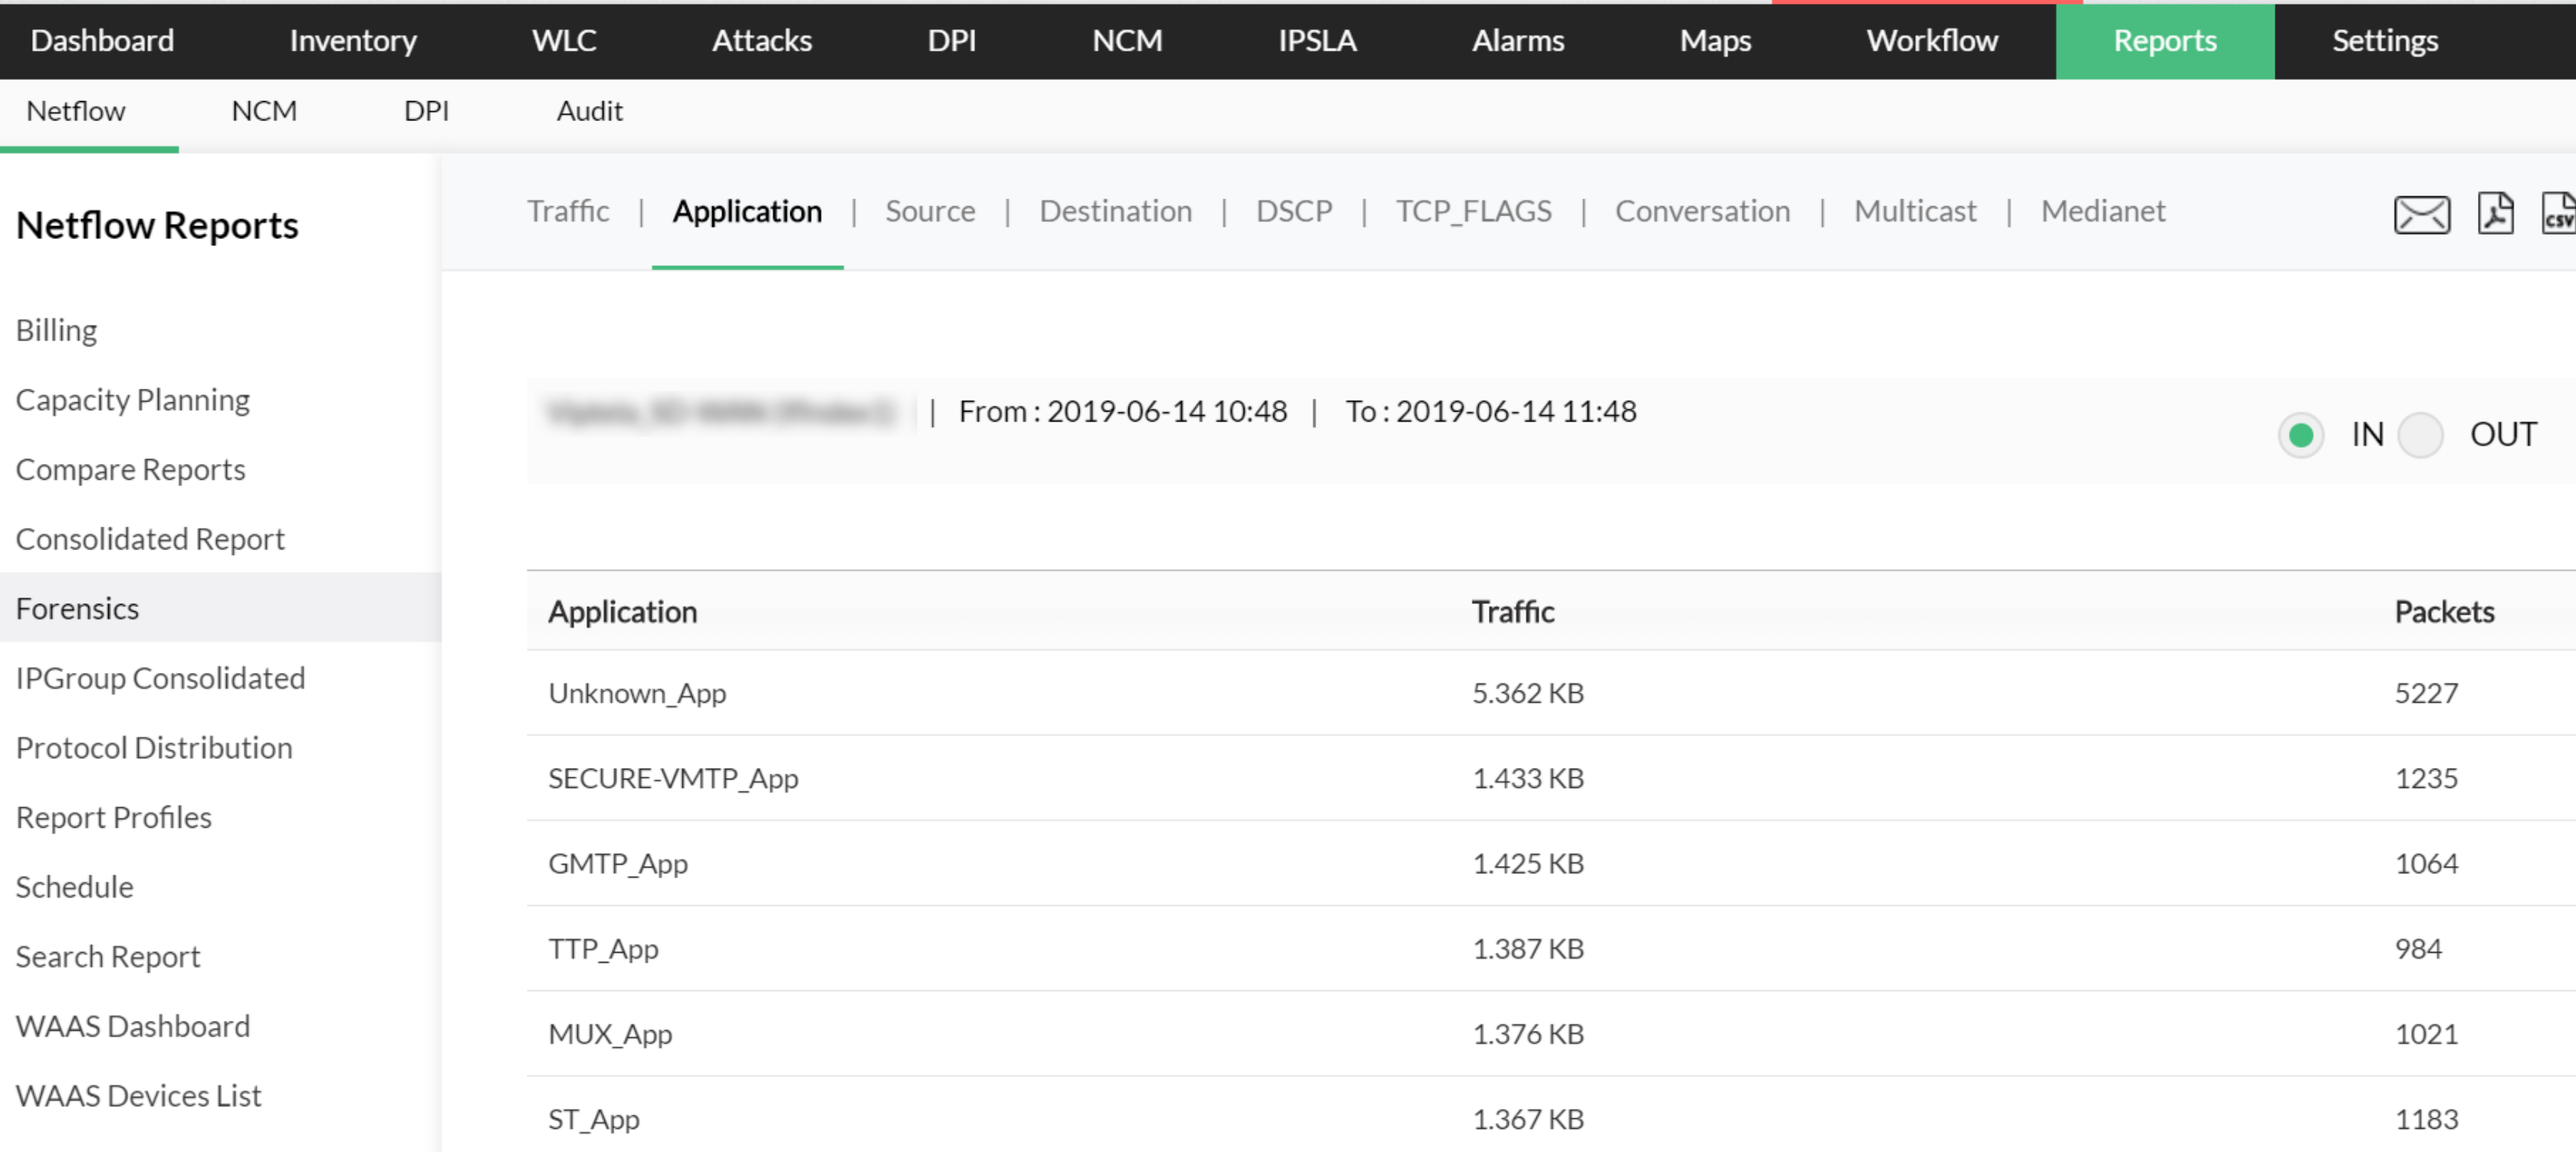
Network forensics provides visibility into parameters such as traffic, applications, source address, destination address, DSCP, and more for any chosen point in time. This depth of information helps you pinpoint the root cause behind unusual network behavior and resolve issues faster with complete clarity. To get the most value out of Forensics, the HighPerf add-on is recommended, as it stores large volumes of raw data for faster and more comprehensive report generation.
In a nutshell
Network troubleshooting becomes easier when you know exactly where to look. NetFlow Analyzer gives you precise visibility into traffic patterns, performance deviations, and the behavior of critical applications. By combining real-time analytics with deep historical context, it helps you validate issues, uncover hidden anomalies, and take targeted action without guesswork. The result is reduced downtime and a consistently stable user experience.