getReportsList
This API is to list all the reports
HTTP Method
GETAPI URL
https://localhost:8060/api/json/reports/getReportsList?apiKey=***************&isFavouriteNeeded=true&hideintegratedReports=true&hideHardwareReport=true
Parameters
| Param Name | Description | Data Type | Additional Information | Is Mandatory |
|---|
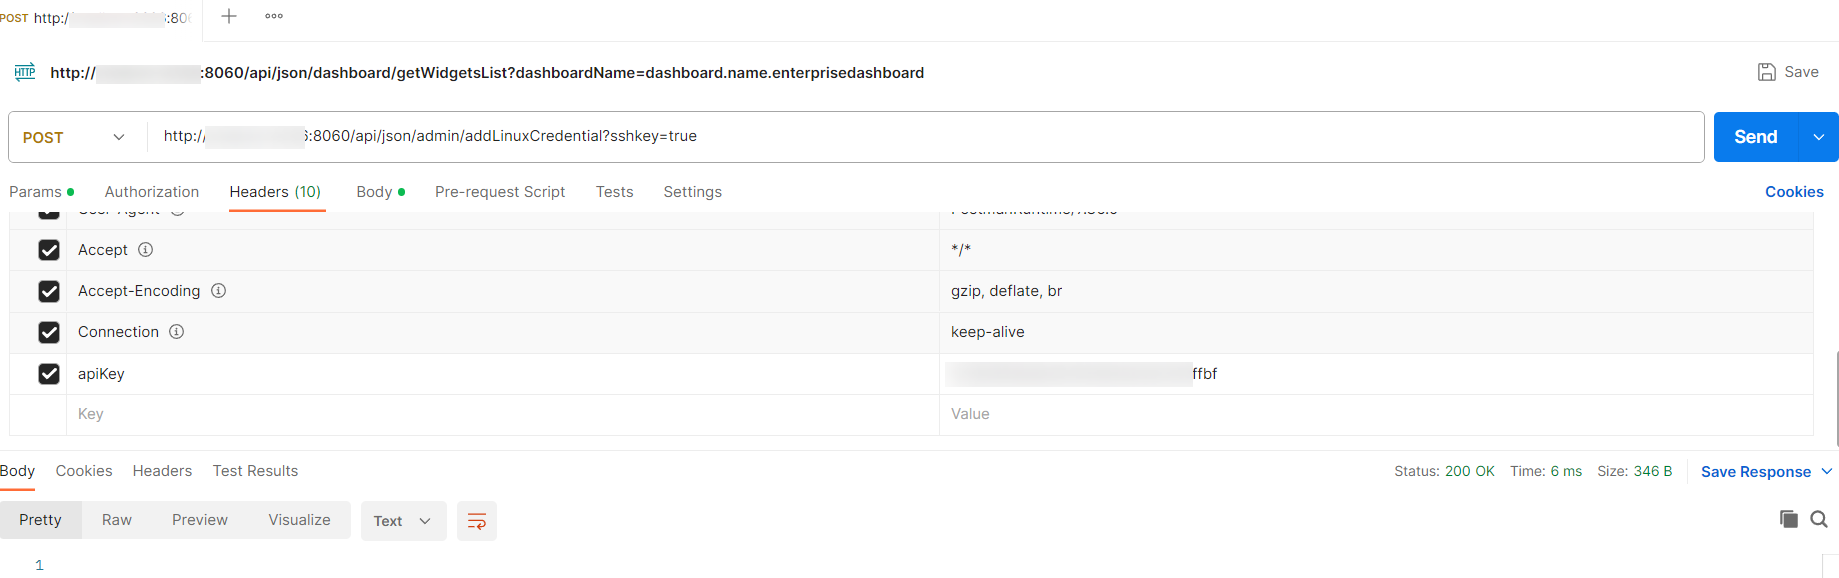
| apiKey | API Key to access your OpManager server. | String | apiKey | Yes |
| isFavouriteNeeded | Boolean value to show favourites reports or not. | boolean | - | No |
| hideintegratedReports | Boolean value to show integrated reports or not. | boolean | - | No |
| hideHardwareReport | Boolean value to show hardware report or not. | boolean | - | No |
| isSchedule | Boolean value to show Schedule report or not. | boolean | - | No |
Sample Response
HTTP Code: 200
"list": [{"customStatus": "False","displayName": "Notification Profiles Triggered","isCustom": "false","id": 6,"url": "/reports/GenerateReports.do?firstTime=true&reportID=6","Name": "Notification Profiles Triggered","desc": "Get report of notification profiles triggered"},{"customStatus": "False","displayName": "Downtime Scheduler Log","isCustom": "false","id": 7,"url": "/reports/GenerateReports.do?firstTime=true&reportID=7","Name": "Downtime Scheduler Log","desc": "Get report of downtime scheduler log"},{"customStatus": "False","displayName": "Schedule Reports Log","isCustom": "false","id": 8,"url": "/reports/GenerateReports.do?firstTime=true&reportID=8","Name": "Schedule Reports Log","desc": "Get report of schedule reports log"},{"customStatus": "False","displayName": "All Down Events","isCustom": "false","id": 2,"url": "/reports/GenerateReports.do?firstTime=true&reportID=2","Name": "All Down Events","desc": "Get report for all down events"},{"customStatus": "False","displayName": "All Alerts","isCustom": "false","id": 84,"isFavourite": "True","url": "/reports/GenerateReports.do?firstTime=true&reportID=84","Name": "All Alerts","desc": "Get report for all alerts"},{"customStatus": "False","displayName": "All Events","isCustom": "false","id": 1,"isFavourite": "True","url": "/reports/GenerateReports.do?firstTime=true&reportID=1","Name": "All Events","desc": "Get report for all events"},{"customStatus": "False","displayName": "All Down Alerts","isCustom": "false","id": 85,"url": "/reports/GenerateReports.do?firstTime=true&reportID=85","Name": "All Down Alerts","desc": "Get report for all down alerts"},{"customStatus": "False","displayName": "SNMP Trap Log","isCustom": "false","id": 3,"url": "/reports/GenerateReports.do?firstTime=true&reportID=3","Name": "SNMP Trap Log","desc": "Get SNMP trap log report"},{"customStatus": "False","displayName": "Windows Event Log","isCustom": "false","id": 4,"url": "/reports/GenerateReports.do?firstTime=true&reportID=4","Name": "Windows Event Log","desc": "Get windows event log report"},{"customStatus": "False","displayName": "Performance Monitor Error Log","isCustom": "false","id": 5,"url": "/reports/GenerateReports.do?firstTime=true&reportID=5","Name": "Performance Monitor Error Log","desc": "Get performance monitor error log report"},{"customStatus": "False","displayName": "All Alerts with Notes","isCustom": "false","id": 721,"url": "/reports/GenerateReports.do?firstTime=true&reportID=721","Name": "All Alerts with Notes","desc": "Get report for all alerts with Notes"},{"customStatus": "False","displayName": "Top SysLog Count by Source","isCustom": "false","id": 95,"url": "/reports/GenerateReports.do?firstTime=true&reportID=95","Name": "webclient.top.syslog.reports","desc": "Top N devices with most number of SysLogs"},{"customStatus": "False","displayName": "Top EventLog Count by Source","isCustom": "false","id": 94,"url": "/reports/GenerateReports.do?firstTime=true&reportID=94","Name": "webclient.top.eventlog.reports","desc": "Top N devices with most number of EventLogs"},{"customStatus": "False","displayName": "Top Trap Count by Source","isCustom": "false","id": 93,"url": "/reports/GenerateReports.do?firstTime=true&reportID=93","Name": "webclient.top.trap.reports","desc": "Top N devices with most number of Traps"},{"customStatus": "False","displayName": "Suppressed Devices","isCustom": "false","id": 92,"url": "/reports/GenerateReports.do?firstTime=true&reportID=92","Name": "webclient.suppress.devices.reports","desc": "Get report for suppressed devices"},{"customStatus": "False","displayName": "DataCollection Error Logs","isCustom": "false","id": 151,"url": "/reports/GenerateReports.do?firstTime=true&reportID=151","Name": "widget.name.dataCollectionLog","desc": "Get datacollection failure details"},{"customStatus": "False","displayName": "Active Alerts","isCustom": "false","id": 149,"url": "/reports/GenerateReports.do?firstTime=true&reportID=149","Name": "webclient.report.name.activealarms","desc": "Get report for active alerts"},{"customStatus": "False","displayName": "Workflow Logs","isCustom": "false","id": 90,"url": "/reports/GenerateReports.do?firstTime=true&reportID=90","Name": "Workflow Logs","desc": "Workflow logs report"},{"customStatus": "False","displayName": "Syslog Events","isCustom": "false","id": 88,"url": "/reports/GenerateReports.do?firstTime=true&reportID=88","Name": "Syslog Events","desc": "Get Syslog events report "},{"displayName": "DataCollection Error Logs for N Consecutive Time(s)","id": "ServerHealthReport","desc": "Get datacollection failure details for N consecutive times"},{"displayName": "Audit Report","id": "Audit","url": "/reports/AuditReport.do","desc": "Audit Report"}],"title": ""}],"Name": "System"},{"displayName": "Health and Performance","list": [{"list": [{"customStatus": "True","displayName": "Servers by Rx Utilization","isCustom": "true","id": 28,"url": "/reports/GenerateReports.do?firstTime=true&reportID=28","Name": "Servers by Rx Utilization","desc": "Identify servers with heavy incoming traffic utilization"},{"customStatus": "True","displayName": "Servers by Tx Utilization","isCustom": "true","id": 29,"url": "/reports/GenerateReports.do?firstTime=true&reportID=29","Name": "Servers by Tx Utilization","desc": "Identify servers with heavy outgoing traffic utilization"},{"customStatus": "True","displayName": "Volumes with Least Free Space","isCustom": "true","id": 30,"url": "/reports/GenerateReports.do?firstTime=true&reportID=30","Name": "Volumes with Least Free Space","desc": "Identify disk partitions with least free space"},{"customStatus": "True","displayName": "Volumes with Most Free Space","isCustom": "true","id": 31,"url": "/reports/GenerateReports.do?firstTime=true&reportID=31","Name": "Volumes with Most Free Space","desc": "Identify disk partitions with most free space"},{"customStatus": "True","displayName": "All Servers Disk Usage Report","isCustom": "true","id": 32,"url": "/reports/GenerateReports.do?firstTime=true&reportID=32","Name": "All Servers Disk Usage Report","desc": "Get partition wise disk usage report for all servers"},{"customStatus": "True","displayName": "Routers Health Report","isCustom": "true","id": 33,"url": "/reports/GenerateReports.do?firstTime=true&reportID=33","Name": "Routers Health Report","desc": "Get health report of routers"},{"customStatus": "True","displayName": "Routers by CPU Utilization","isCustom": "true","id": 34,"url": "/reports/GenerateReports.do?firstTime=true&reportID=34","Name": "Routers by CPU Utilization","desc": "Identify busy routers with high CPU Utilization"},{"customStatus": "True","displayName": "Routers by Memory Utilization","isCustom": "true","id": 35,"url": "/reports/GenerateReports.do?firstTime=true&reportID=35","Name": "Routers by Memory Utilization","desc": "Identify overloaded routers with high Memory Utilization"},{"customStatus": "True","displayName": "Router Interfaces by Rx Traffic","isCustom": "true","id": 36,"url": "/reports/GenerateReports.do?firstTime=true&reportID=36","Name": "Router Interfaces by Rx Traffic","desc": "Identify interfaces with heavy incoming traffic"},{"customStatus": "True","displayName": "Router Interfaces by Tx Traffic","isCustom": "true","id": 37,"url": "/reports/GenerateReports.do?firstTime=true&reportID=37","Name": "Router Interfaces by Tx Traffic","desc": "Identify interfaces with heavy outgoing traffic"},{"customStatus": "True","displayName": "Router Interfaces by Rx Errors","isCustom": "true","id": 38,"url": "/reports/GenerateReports.do?firstTime=true&reportID=38","Name": "Router Interfaces by Rx Errors","desc": "Identify interfaces with high incoming errors"},{"customStatus": "True","displayName": "Router Interfaces by Tx Errors","isCustom": "true","id": 39,"url": "/reports/GenerateReports.do?firstTime=true&reportID=39","Name": "Router Interfaces by Tx Errors","desc": "Identify interfaces with high incoming errors"},{"customStatus": "True","displayName": "Router Interfaces by Rx Utilization","isCustom": "true","id": 40,"url": "/reports/GenerateReports.do?firstTime=true&reportID=40","Name": "Router Interfaces by Rx Utilization","desc": "Identify interfaces with high % Receive utilization"},{"customStatus": "True","displayName": "Router Interfaces by Tx Utilization","isCustom": "true","id": 41,"url": "/reports/GenerateReports.do?firstTime=true&reportID=41","Name": "Router Interfaces by Tx Utilization","desc": "Identify interfaces with high % Transmit utilization"},{"customStatus": "True","displayName": "Switches Health Report","isCustom": "true","id": 42,"url": "/reports/GenerateReports.do?firstTime=true&reportID=42","Name": "Switches Health Report","desc": "Get health report of switches"},{"customStatus": "True","displayName": "Ports by Rx Traffic","isCustom": "true","id": 43,"url": "/reports/GenerateReports.do?firstTime=true&reportID=43","Name": "Ports by Rx Traffic","desc": "Identify ports with heavy incoming traffic"},{"customStatus": "True","displayName": "Ports by Tx Traffic","isCustom": "true","id": 44,"url": "/reports/GenerateReports.do?firstTime=true&reportID=44","Name": "Ports by Tx Traffic","desc": "Identify ports with heavy outgoing traffic"},{"customStatus": "True","displayName": "Ports by Rx Errors","isCustom": "true","id": 45,"url": "/reports/GenerateReports.do?firstTime=true&reportID=45","Name": "Ports by Rx Errors","desc": "Identify ports with most Receive errors"},{"customStatus": "True","displayName": "Ports by Tx Errors","isCustom": "true","id": 46,"url": "/reports/GenerateReports.do?firstTime=true&reportID=46","Name": "Ports by Tx Errors","desc": "Identify ports with most Transmit errors"},{"customStatus": "True","displayName": "Ports by Tx Utilization","isCustom": "true","id": 48,"url": "/reports/GenerateReports.do?firstTime=true&reportID=48","Name": "Ports by Tx Utilization","desc": "Identify ports with high % Transmit utilization"},{"customStatus": "True","displayName": "DCs by CPU Utilization","isCustom": "true","id": 49,"url": "/reports/GenerateReports.do?firstTime=true&reportID=49","Name": "DCs by CPU Utilization","desc": "Identify busy DCs with high CPU Utilization"},{"customStatus": "True","displayName": "DCs by Memory Utilization","isCustom": "true","id": 50,"url": "/reports/GenerateReports.do?firstTime=true&reportID=50","Name": "DCs by Memory Utilization","desc": "Identify overloaded DCs with high Memory Utilization"},{"customStatus": "True","displayName": "DCs by Disk Utilization","isCustom": "true","id": 51,"url": "/reports/GenerateReports.do?firstTime=true&reportID=51","Name": "DCs by Disk Utilization","desc": "Identify overloaded DCs with high Disk Utilization"},{"customStatus": "True","displayName": "Ports by Rx Utilization","isCustom": "true","id": 47,"url": "/reports/GenerateReports.do?firstTime=true&reportID=47","Name": "Ports by Rx Utilization","desc": "Identify ports with high % Receive utilization"},{"customStatus": "False","displayName": "Health Report","isCustom": "false","id": 9,"url": "/reports/GenerateReports.do?firstTime=true&reportID=9","Name": "Health Report","desc": "Get health report of all devices"},{"customStatus": "False","displayName": "Devices by CPU Utilization","isCustom": "false","id": 10,"url": "/reports/GenerateReports.do?firstTime=true&reportID=10","Name": "Devices by CPU Utilization","desc": "Identify overloaded devices with high CPU Utilization"},{"customStatus": "False","displayName": "Devices by Memory Utilization","isCustom": "false","id": 11,"url": "/reports/GenerateReports.do?firstTime=true&reportID=11","Name": "Devices by Memory Utilization","desc": "Identify overloaded devices with high Memory Utilization"},{"customStatus": "False","displayName": "Devices by Disk Utilization","isCustom": "false","id": 12,"url": "/reports/GenerateReports.do?firstTime=true&reportID=12","Name": "Devices by Disk Utilization","desc": "Identify overloaded devices with high Disk Utilization"},{"customStatus": "False","displayName": "Disk Usage by Drives","isCustom": "false","id": 13,"url": "/reports/GenerateReports.do?firstTime=true&reportID=13","Name": "Disk Usage by Drives","desc": "Identify overloaded devices with high Disk Utilization by drives"},{"customStatus": "False","displayName": "All Interfaces by Utilization","isCustom": "false","id": 14,"url": "/reports/GenerateReports.do?firstTime=true&reportID=14","Name": "All Interfaces by Utilization","desc": "Identify devices with heavy traffic utilization"},{"customStatus": "False","displayName": "WAN Links by Utilization","isCustom": "false","id": 15,"isFavourite": "True","url": "/reports/GenerateReports.do?firstTime=true&reportID=15","Name": "WAN Links by Utilization","desc": "Identify WAN links with heavy traffic utilization"},{"customStatus": "False","displayName": "Interfaces by Rx Traffic","isCustom": "false","id": 16,"url": "/reports/GenerateReports.do?firstTime=true&reportID=16","Name": "Interfaces by Rx Traffic","desc": "Identify devices with heavy incoming traffic"},{"customStatus": "False","displayName": "Interfaces by Tx Traffic","isCustom": "false","id": 17,"url": "/reports/GenerateReports.do?firstTime=true&reportID=17","Name": "Interfaces by Tx Traffic","desc": "Identify devices with heavy outgoing traffic"},{"customStatus": "False","displayName": "Interfaces by Rx Utilization","isCustom": "false","id": 18,"url": "/reports/GenerateReports.do?firstTime=true&reportID=18","Name": "Interfaces by Rx Utilization","desc": "Identify devices with heavy incoming traffic utilization"},{"customStatus": "False","displayName": "Interfaces by Tx Utilization","isCustom": "false","id": 19,"url": "/reports/GenerateReports.do?firstTime=true&reportID=19","Name": "Interfaces by Tx Utilization","desc": "Identify devices with heavy outgoing traffic utilization"},{"customStatus": "False","displayName": "Interfaces by Rx Errors","isCustom": "false","id": 20,"url": "/reports/GenerateReports.do?firstTime=true&reportID=20","Name": "Interfaces by Rx Errors","desc": "Identify interfaces with high incoming errors"},{"customStatus": "False","displayName": "Interfaces by Tx Errors","isCustom": "false","id": 21,"url": "/reports/GenerateReports.do?firstTime=true&reportID=21","Name": "Interfaces by Tx Errors","desc": "Identify interfaces with high outgoing errors"},{"customStatus": "True","displayName": "Servers Health Report","isCustom": "true","id": 22,"isFavourite": "True","url": "/reports/GenerateReports.do?firstTime=true&reportID=22","Name": "Servers Health Report","desc": "Get health report of servers"},{"customStatus": "True","displayName": "Servers by CPU Utilization","isCustom": "true","id": 23,"url": "/reports/GenerateReports.do?firstTime=true&reportID=23","Name": "Servers by CPU Utilization","desc": "Identify busy servers with high CPU Utilization"},{"customStatus": "True","displayName": "Servers by Memory Utilization","isCustom": "true","id": 24,"url": "/reports/GenerateReports.do?firstTime=true&reportID=24","Name": "Servers by Memory Utilization","desc": "Identify overloaded servers with high Memory Utilization"},{"customStatus": "True","displayName": "Servers by Disk Utilization","isCustom": "true","id": 25,"url": "/reports/GenerateReports.do?firstTime=true&reportID=25","Name": "Servers by Disk Utilization","desc": "Identify overloaded servers with high Disk Utilization"},{"customStatus": "True","displayName": "Servers by Rx Traffic","isCustom": "true","id": 26,"url": "/reports/GenerateReports.do?firstTime=true&reportID=26","Name": "Servers by Rx Traffic","desc": "Identify servers with heavy incoming traffic"},{"customStatus": "True","displayName": "Servers by Tx Traffic","isCustom": "true","id": 27,"url": "/reports/GenerateReports.do?firstTime=true&reportID=27","Name": "Servers by Tx Traffic","desc": "Identify servers with heavy outgoing traffic"},{"customStatus": "True","displayName": "All Interfaces By Traffic","isCustom": "true","id": 81,"url": "/reports/GenerateReports.do?firstTime=true&reportID=81","Name": "All Interfaces By Traffic","desc": "Get traffic report of all interfaces"},{"customStatus": "True","displayName": "Volumes With Low Disk Utilization","isCustom": "true","id": 82,"url": "/reports/GenerateReports.do?firstTime=true&reportID=82","Name": "Volumes With Low Disk Utilization","desc": "Identify volumes with low disk utilization"},{"customStatus": "True","displayName": "Volumes With High Disk Utilization","isCustom": "true","id": 83,"url": "/reports/GenerateReports.do?firstTime=true&reportID=83","Name": "Volumes With High Disk Utilization","desc": "Identify volumes with high disk utilization"},{"customStatus": "False","displayName": "Top N Errors And Discards","isCustom": "false","id": 86,"url": "/reports/GenerateReports.do?firstTime=true&reportID=86","Name": "Top N Errors And Discards","desc": "Identify interfaces with high errors and discards"},{"customStatus": "False","displayName": "Interfaces By TotalBytes Transfered","isCustom": "false","id": 89,"url": "/reports/GenerateReports.do?firstTime=true&reportID=89","Name": "Interfaces By TotalBytes Transfered","desc": "Identify interfaces with high total bytes transfered"},{"customStatus": "False","displayName": "Hardware Health Report","isCustom": "false","id": 142,"url": "/reports/GenerateReports.do?firstTime=true&reportID=142","Name": "webclient.reports.hardware.title","desc": "Get Hardware Health Report"},{"customStatus": "True","displayName": "Processes by CPU Utilization","isCustom": "true","id": 144,"url": "/reports/GenerateReports.do?firstTime=true&reportID=144","Name": "Processes by CPU Utilization","desc": "Identify processes with high CPU Utilization"},{"customStatus": "True","displayName": "Processes by Memory Utilization","isCustom": "true","id": 145,"url": "/reports/GenerateReports.do?firstTime=true&reportID=145","Name": "Processes by Memory Utilization","desc": "Identify processes with high Memory Utilization"},{"customStatus": "True","displayName": "Processes by Absolute Memory","isCustom": "true","id": 148,"url": "/reports/GenerateReports.do?firstTime=true&reportID=148","Name": "Processes by Absolute Memory","desc": "Identify absolute memory value of the Process"},{"customStatus": "False","displayName": "Flap Count Summary","isCustom": "false","id": 768,"url": "/reports/GenerateReports.do?firstTime=true&reportID=768","Name": "webclient.bgp.title.flapCount","desc": "Get Flap Count Summary for BGP Peers"},{"customStatus": "False","displayName": "Flap Summary","isCustom": "false","id": 769,"url": "/reports/GenerateReports.do?firstTime=true&reportID=769","Name": "webclient.bgp.title.flapSummary","desc": "Flap Summary for each BGP Peers"},{"customStatus": "False","displayName": "Devices with Performance Monitors","isCustom": "false","id": 772,"url": "/reports/GenerateReports.do?firstTime=true&reportID=772","Name": "webclient.perf.monitors.report","desc": "Get report for devices with Perforamance monitors"},{"customStatus": "False","displayName": "Devices with File Monitors","isCustom": "false","id": 773,"url": "/reports/GenerateReports.do?firstTime=true&reportID=773","Name": "webclient.file.monitors.report","desc": "Get report for devices with File monitors"},{"customStatus": "False","displayName": "Devices with Folder Monitors","isCustom": "false","id": 774,"url": "/reports/GenerateReports.do?firstTime=true&reportID=774","Name": "webclient.folder.monitors.report","desc": "Get report for devices with Folder monitors"},{"customStatus": "False","displayName": "Devices with Process Monitors","isCustom": "false","id": 775,"url": "/reports/GenerateReports.do?firstTime=true&reportID=775","Name": "webclient.process.monitors.report","desc": "Get report for devices with Process monitors"},{"customStatus": "False","displayName": "Devices with AD Monitors","isCustom": "false","id": 776,"url": "/reports/GenerateReports.do?firstTime=true&reportID=776","Name": "webclient.AD.monitors.report","desc": "Get report for devices with AD monitors"},{"customStatus": "False","displayName": "Devices with Exchange Monitors","isCustom": "false","id": 777,"url": "/reports/GenerateReports.do?firstTime=true&reportID=777","Name": "webclient.exchange.monitors.report","desc": "Get report for devices with Exchange monitors"},{"customStatus": "False","displayName": "Devices with MSSQL Monitors","isCustom": "false","id": 778,"url": "/reports/GenerateReports.do?firstTime=true&reportID=778","Name": "webclient.mssql.monitors.report","desc": "Get report for devices with MSSQL monitors"},{"customStatus": "False","displayName": "Devices with AD Service Monitors","isCustom": "false","id": 779,"url": "/reports/GenerateReports.do?firstTime=true&reportID=779","Name": "webclient.ADService.monitors.report","desc": "Get report for devices with AD Service monitors"},{"customStatus": "False","displayName": "Devices with MSSQL Service Monitors","isCustom": "false","id": 780,"url": "/reports/GenerateReports.do?firstTime=true&reportID=780","Name": "webclient.mssqlservice.monitors.report","desc": "Get report for devices with MSSQL Service monitors"},{"customStatus": "False","displayName": "Devices with Exchange Service Monitors","isCustom": "false","id": 781,"url": "/reports/GenerateReports.do?firstTime=true&reportID=781","Name": "webclient.exchangeservice.monitors.report","desc": "Get report for devices with Exchange Service monitors"},{"customStatus": "False","displayName": "Devices with NT Service Monitors","isCustom": "false","id": 782,"url": "/reports/GenerateReports.do?firstTime=true&reportID=782","Name": "webclient.ntservice.monitors.report","desc": "Get report for devices with NT Service monitors"},{"customStatus": "False","displayName": "Devices with URL Monitors","isCustom": "false","id": 783,"url": "/reports/GenerateReports.do?firstTime=true&reportID=783","Name": "webclient.url.monitors.report","desc": "Get report for devices with URL monitors"},{"customStatus": "False","displayName": "Devices with Service Monitors","isCustom": "false","id": 784,"url": "/reports/GenerateReports.do?firstTime=true&reportID=784","Name": "webclient.service.monitors.report","desc": "Get report for devices with Service monitors"},{"customStatus": "False","displayName": "VPN Summary","isCustom": "false","id": 895,"url": "/reports/GenerateReports.do?firstTime=true&reportID=895","Name": "webclient.opm.reports.vpnSummary","desc": "Get summary report for Site-to-Site VPN devices."}],"title": ""}],"Name": "Health and Performance"},{"displayName": "Availability and Response","list": [{"list": [{"customStatus": "True","displayName": "SMTP Servers by Response Time","isCustom": "true","id": 65,"url": "/reports/GenerateReports.do?firstTime=true&reportID=65","Name": "SMTP Servers by Response Time","desc": "Identify SMTP servers with high Response Time"},{"customStatus": "True","displayName": "Process Monitors Availability","isCustom": "true","id": 146,"url": "/reports/GenerateReports.do?firstTime=true&reportID=146","Name": "Process Monitors Availability","desc": "Get availability report for all process monitors"},{"customStatus": "True","displayName": "Windows Service Monitors Availability","isCustom": "true","id": 147,"url": "/reports/GenerateReports.do?firstTime=true&reportID=147","Name": "Windows Service Monitors Availability","desc": "Get availability report for all windows service monitors"},{"customStatus": "True","displayName": "HTTP Servers by Response Time","isCustom": "true","id": 64,"url": "/reports/GenerateReports.do?firstTime=true&reportID=64","Name": "HTTP Servers by Response Time","desc": "Identify Web servers with high Response Time"},{"customStatus": "False","displayName": "Devices by Packet Loss","isCustom": "false","id": 58,"url": "/reports/GenerateReports.do?firstTime=true&reportID=58","Name": "Devices by Packet Loss","desc": "Identify devices with high packet loss"},{"customStatus": "False","displayName": "Devices by Response Time","isCustom": "false","id": 57,"url": "/reports/GenerateReports.do?firstTime=true&reportID=57","Name": "Devices by Response Time","desc": "Identify devices with high response time"},{"customStatus": "True","displayName": "Web Servers Availability","isCustom": "true","id": 63,"url": "/reports/GenerateReports.do?firstTime=true&reportID=63","Name": "Web Servers Availability","desc": "Get availability report for all web servers"},{"customStatus": "False","displayName": "WAN Links Availability","isCustom": "false","id": 54,"isFavourite": "True","url": "/reports/GenerateReports.do?firstTime=true&reportID=54","Name": "WAN Links Availability","desc": "Get availability report for all interfaces"},{"customStatus": "False","displayName": "All Interfaces Availability","isCustom": "false","id": 87,"isFavourite": "True","url": "/reports/GenerateReports.do?firstTime=true&reportID=87","Name": "All Interfaces Availability","desc": "Get availability report for all interfaces"},{"customStatus": "False","displayName": "URLs Availability","isCustom": "false","id": 55,"url": "/reports/GenerateReports.do?firstTime=true&reportID=55","Name": "URLs Availability","desc": "Get availability report for all URLs"},{"customStatus": "False","displayName": "Service Monitors Availability","isCustom": "false","id": 56,"isFavourite": "True","url": "/reports/GenerateReports.do?firstTime=true&reportID=56","Name": "Service Monitors Availability","desc": "Get availability report for all service monitors"},{"customStatus": "True","displayName": "DCs Availability Report","isCustom": "true","id": 62,"url": "/reports/GenerateReports.do?firstTime=true&reportID=62","Name": "DCs Availability Report","desc": "Get availability report for all DCs"},{"customStatus": "True","displayName": "Servers Availability Report","isCustom": "true","id": 61,"url": "/reports/GenerateReports.do?firstTime=true&reportID=61","Name": "Servers Availability Report","desc": "Get availability report for all services"},{"customStatus": "False","displayName": "Devices Availability","isCustom": "false","id": 52,"url": "/reports/GenerateReports.do?firstTime=true&reportID=52","Name": "Devices Availability","desc": "Get availability report for all devices"},{"customStatus": "False","displayName": "Devices Availability Dashboard","isCustom": "false","id": 53,"url": "/reports/GenerateReports.do?firstTime=true&reportID=53","Name": "Devices Availability Dashboard","desc": "Get availability report for all devices"},{"customStatus": "False","displayName": "DownTime Report For Interfaces","isCustom": "false","id": 724,"url": "/reports/GenerateReports.do?firstTime=true&reportID=724","Name": "DownTime Report For Interfaces","desc": "DownTime history for all interfaces"},{"customStatus": "False","displayName": "Services by Response Time","isCustom": "false","id": 60,"url": "/reports/GenerateReports.do?firstTime=true&reportID=60","Name": "Services by Response Time","desc": "Identify services with high response time"},{"customStatus": "False","displayName": "URLs by Response Time","isCustom": "false","id": 59,"url": "/reports/GenerateReports.do?firstTime=true&reportID=59","Name": "URLs by Response Time","desc": "Identify URLs with high response time"},{"customStatus": "True","displayName": "Telnet Servers by Response Time","isCustom": "true","id": 68,"url": "/reports/GenerateReports.do?firstTime=true&reportID=68","Name": "Telnet Servers by Response Time","desc": "Identify Telnet servers with high Response Time"},{"customStatus": "False","displayName": "DownTime Report","isCustom": "false","id": 91,"url": "/reports/GenerateReports.do?firstTime=true&reportID=91","Name": "DownTime Report","desc": "DownTime history for all devices"},{"customStatus": "True","displayName": "FTP Servers by Response Time","isCustom": "true","id": 67,"url": "/reports/GenerateReports.do?firstTime=true&reportID=67","Name": "FTP Servers by Response Time","desc": "Identify FTP servers with high Response Time"},{"customStatus": "True","displayName": "MySQL Servers by Response Time","isCustom": "true","id": 66,"url": "/reports/GenerateReports.do?firstTime=true&reportID=66","Name": "MySQL Servers by Response Time","desc": "Identify MySQL servers with high Response Time"}],"title": ""}],"Name": "Availability and Response"},{"displayName": "Inventory","list": [{"list": [{"customStatus": "True","displayName": "Devices Down","isCustom": "true","id": 722,"url": "/reports/GenerateReports.do?firstTime=true&reportID=722","Name": "widget.name.devicesdown","desc": "Get report for all devices down"},{"customStatus": "False","displayName": "Notification Profiles Applied by Type","isCustom": "false","id": 72,"url": "/reports/GenerateReports.do?firstTime=true&reportID=72","Name": "Notification Profiles Applied by Type","desc": "Get report of all notification profiles applied by profile type"},{"customStatus": "False","displayName": "Notification Profiles Applied","isCustom": "false","id": 71,"url": "/reports/GenerateReports.do?firstTime=true&reportID=71","Name": "Notification Profiles Applied","desc": "Get report of all notification profiles applied"},{"customStatus": "False","displayName": "Devices by Category","isCustom": "false","id": 70,"isFavourite": "True","url": "/reports/GenerateReports.do?firstTime=true&reportID=70","Name": "Devices by Category","desc": "Get inventory report of devices by device category"},{"customStatus": "False","displayName": "Devices by Device Type","isCustom": "false","id": 69,"url": "/reports/GenerateReports.do?firstTime=true&reportID=69","Name": "Devices by Device Type","desc": "Get inventory report of devices by device type"},{"customStatus": "False","displayName": "Hardware Information","isCustom": "false","id": 155,"url": "/reports/GenerateReports.do?firstTime=true&reportID=155","Name": "webclient.reports.hardwareinfo.title","desc": "Get report of Hardware Information"},{"customStatus": "True","displayName": "Non SNMP Devices","isCustom": "true","id": 80,"url": "/reports/GenerateReports.do?firstTime=true&reportID=80","Name": "Non SNMP Devices","desc": "Get inventory report of all SNMP not enabled devices"},{"customStatus": "True","displayName": "SNMP Enabled Devices","isCustom": "true","id": 79,"url": "/reports/GenerateReports.do?firstTime=true&reportID=79","Name": "SNMP Enabled Devices","desc": "Get inventory report of all SNMP enabled devices"},{"customStatus": "True","displayName": "Desktop","isCustom": "true","id": 78,"url": "/reports/GenerateReports.do?firstTime=true&reportID=78","Name": "Desktops","desc": "Get inventory report of desktops"},{"customStatus": "True","displayName": "Server","isCustom": "true","id": 77,"url": "/reports/GenerateReports.do?firstTime=true&reportID=77","Name": "Servers","desc": "Get inventory report of servers"},{"customStatus": "False","displayName": "Threshold Details of Devices","isCustom": "false","id": 150,"url": "/reports/GenerateReports.do?firstTime=true&reportID=150","Name": "webclient.report.name.thresholdreports","desc": "Get report of all thresholds configured"},{"customStatus": "True","displayName": "All Devices","isCustom": "true","id": 76,"url": "/reports/GenerateReports.do?firstTime=true&reportID=76","Name": "All Devices","desc": "Get inventory report of all devices"},{"customStatus": "False","displayName": "Interfaces by Type","isCustom": "false","id": 75,"url": "/reports/GenerateReports.do?firstTime=true&reportID=75","Name": "Interfaces by Type","desc": "Get report of all interfaces by type"},{"customStatus": "False","displayName": "Interface Speed Report","isCustom": "false","id": 74,"url": "/reports/GenerateReports.do?firstTime=true&reportID=74","Name": "Interface Speed Report","desc": "Get report of interface bandwidth"},{"customStatus": "False","displayName": "Notification Profiles Applied by Device","isCustom": "false","id": 73,"url": "/reports/GenerateReports.do?firstTime=true&reportID=73","Name": "Notification Profiles Applied by Device","desc": "Get report of all notification profiles applied by device"},{"customStatus": "False","displayName": "Devices by Added Time","isCustom": "false","id": 725,"url": "/reports/GenerateReports.do?firstTime=true&reportID=725","Name": "Devices by Added Time","desc": "Get Devices with its Added Time"},{"customStatus": "False","displayName": "Uplink Dependency Devices","isCustom": "false","id": 727,"url": "/reports/GenerateReports.do?firstTime=true&reportID=727","Name": "Up Link Dependency Devices","desc": "Get inventory report of all dependent devices"},{"customStatus": "False","displayName": "Credentials Associated Devices","isCustom": "false","id": 761,"url": "/reports/GenerateReports.do?firstTime=true&reportID=761","Name": "webclient.credential.devices.report","desc": "Get report of credentials associated to devices"},{"customStatus": "False","displayName": "Agent-monitored devices","isCustom": "false","id": 862,"url": "/reports/GenerateReports.do?firstTime=true&reportID=862","Name": "Agent Devices","desc": "Get an Inventory report of all agent-monitored devices"},{"customStatus": "False","displayName": "IPMI Information","isCustom": "false","id": 723,"url": "/reports/GenerateReports.do?firstTime=true&reportID=723","Name": "webclient.reports.ipmi.info.title","desc": "Get a report of your IPMI devices and related hardware"}],"title": ""}],"Name": "Inventory"},{"displayName": "WAN RTT Monitors","list": [{"list": [{"customStatus": "False","displayName": "Top N Paths with Maximum RTT","isCustom": "false","id": 101,"url": "/reports/GenerateReports.do?firstTime=true&reportID=101","Name": "Top N Paths with Maximum RTT","desc": "Top paths with maximum Round Trip Time"},{"customStatus": "False","displayName": "Round Trip Time History Report","isCustom": "false","id": 97,"url": "/reports/GenerateReports.do?firstTime=true&reportID=97","Name": "Round Trip Time Trend Report","desc": "Show RTT of icmp packets between source and destination host"},{"customStatus": "False","displayName": "Availability History","isCustom": "false","id": 98,"url": "/reports/GenerateReports.do?firstTime=true&reportID=98","Name": "Link Availability and Error Statistics","desc": "Show availability of destination also show type of errors in case of failed operation"},{"customStatus": "False","displayName": "RTT Threshold Violation Report","isCustom": "false","id": 96,"url": "/reports/GenerateReports.do?firstTime=true&reportID=96","Name": "RTT Threshold Violation Report","desc": "Shows threshold violation of icmp packets between source and destination host"},{"customStatus": "False","displayName": "Top N Least Available Paths","isCustom": "false","id": 99,"url": "/reports/GenerateReports.do?firstTime=true&reportID=99","Name": "Top N Least Available Paths","desc": "Top paths with least availability"},{"customStatus": "False","displayName": "Top N Paths with Maximum Threshold Violation","isCustom": "false","id": 100,"url": "/reports/GenerateReports.do?firstTime=true&reportID=100","Name": "Top N Paths with Maximum Threshold Violation","desc": "Top paths with maximum threshold violation"}],"title": ""}],"Name": "WAN RTT Monitors"},{"displayName": "VoIP Monitors","list": [{"list": [{"customStatus": "False","displayName": "Round Trip Time History Report","isCustom": "false","id": 107,"url": "/reports/GenerateReports.do?firstTime=true&reportID=107","Name": "Round Trip Time History Report","desc": "Shows RTT (Round Trip Time) of VoIP packets in both directions"},{"customStatus": "False","displayName": "Top N Call Paths by Jitter","isCustom": "false","id": 110,"url": "/reports/GenerateReports.do?firstTime=true&reportID=110","Name": "Top N Call Paths by Jitter","desc": "Top call paths with maximum Jitter"},{"customStatus": "False","displayName": "Top N Call Paths by Packet Loss","isCustom": "false","id": 109,"url": "/reports/GenerateReports.do?firstTime=true&reportID=109","Name": "Top N Call Paths by Packet Loss","desc": "Top call paths with maximum Packet Loss"},{"customStatus": "False","displayName": "Top N Call Paths by MOS","isCustom": "false","id": 108,"url": "/reports/GenerateReports.do?firstTime=true&reportID=108","Name": "Top N Call Paths by MOS","desc": "Top call paths with minimum MOS"},{"customStatus": "False","displayName": "Top N Call Paths by Latency","isCustom": "false","id": 111,"url": "/reports/GenerateReports.do?firstTime=true&reportID=111","Name": "Top N Call Paths by Latency","desc": "Top call paths with maximum Latency"},{"customStatus": "False","displayName": "Latency History Report","isCustom": "false","id": 102,"url": "/reports/GenerateReports.do?firstTime=true&reportID=102","Name": "Latency History Report","desc": "Shows latency of VoIP packets in both directions"},{"customStatus": "False","displayName": "Jitter History Report","isCustom": "false","id": 103,"url": "/reports/GenerateReports.do?firstTime=true&reportID=103","Name": "Jitter History Report","desc": "Shows jitter (inter packet delay) of VoIP packets in bonfa.overview.Qos=QoS"},{"customStatus": "False","displayName": "Packet Loss History Report","isCustom": "false","id": 104,"url": "/reports/GenerateReports.do?firstTime=true&reportID=104","Name": "Packet Loss History Report","desc": "Shows packetloss of VoIP packets in both directions"},{"customStatus": "False","displayName": "VoIP Errors History Report","isCustom": "false","id": 105,"url": "/reports/GenerateReports.do?firstTime=true&reportID=105","Name": "VoIP Errors History Report","desc": "Shows various errors (timeout, tail drop,MIA etc.,) generated in the VoIP traffic"},{"customStatus": "False","displayName": "MOS History Report","isCustom": "false","id": 106,"url": "/reports/GenerateReports.do?firstTime=true&reportID=106","Name": "MOS History Report","desc": "Report shows MOS (Mean Opinion Score) of VoIP traffic. MOS is the key quality indicator of VoIP traffic"}],"title": ""}],"Name": "VoIP Monitors"},{"displayName": "Virtual Servers Report","list": [{"list": [{"customStatus": "False","displayName": "HyperV-Host vs Disk Mapping","isCustom": "false","id": 154,"url": "/reports/GenerateReports.do?firstTime=true&reportID=154","Name": "webclient.virtual.hyperv.hostdisk.report","desc": "Get report for all Monitored HyperV-Host Vs Disk Mappings"},{"customStatus": "False","displayName": "Datastore vs VMware-Host Mapping","isCustom": "false","id": 153,"url": "/reports/GenerateReports.do?firstTime=true&reportID=153","Name": "webclient.virtual.vmware.datastorehost.report","desc": "Get report for all Datastore Vs Monitored VMware-Host Mappings"},{"customStatus": "False","displayName": "Datastore vs VMware-VM Mapping","isCustom": "false","id": 152,"url": "/reports/GenerateReports.do?firstTime=true&reportID=152","Name": "webclient.virtual.vmware.datastorevm.report","desc": "Get report for all Datastore Vs Monitored VMware-VM Mappings"},{"customStatus": "False","displayName": "VMware Idle VMs","isCustom": "false","id": 156,"url": "/reports/GenerateReports.do?firstTime=true&reportID=156","Name": "widget.name.vmware.idleVms","desc": "List of Idle VMs"},{"customStatus": "False","displayName": "Top VMware VMs by CPU Under Allocated","isCustom": "false","id": 157,"url": "/reports/GenerateReports.do?firstTime=true&reportID=157","Name": "widget.name.vmware.vmUnderAllocatedCPU","desc": "vms with under allocated CPU"},{"customStatus": "False","displayName": "Top VMware VMs by CPU Over Allocated","isCustom": "false","id": 158,"url": "/reports/GenerateReports.do?firstTime=true&reportID=158","Name": "widget.name.vmware.vmOverAllocatedCPU","desc": "VMs with CPU over allocated"},{"customStatus": "False","displayName": "Top VMware VMs by Memory Under Allocated","isCustom": "false","id": 159,"url": "/reports/GenerateReports.do?firstTime=true&reportID=159","Name": "widget.name.vmware.vmUnderAllocatedMemory","desc": "VMs with memory under allocated"},{"customStatus": "False","displayName": "Top VMware VMs by Memory Over Allocated","isCustom": "false","id": 160,"url": "/reports/GenerateReports.do?firstTime=true&reportID=160","Name": "widget.name.vmware.vmOverAllocatedMemory","desc": "VMs with memory over allocated"},{"customStatus": "False","displayName": "All Virtual Machines","isCustom": "false","id": 726,"url": "/reports/GenerateReports.do?firstTime=true&reportID=726","Name": "widget.name.vmware.vmsList","desc": "List of virtual machines based on virtual type"}],"title": ""}],"Name": "Virtual Servers Report"},{"displayName": "Storage Reports","list": [{"list": [{"customStatus": "False","displayName": "Growth Trend","isCustom": "false","id": 174,"url": "/reports/GenerateReports.do?firstTime=true&reportID=174","Name": "webclient.reports.growthtrend.title","desc": "Growth Trend"},{"customStatus": "False","displayName": "Storage Summary","isCustom": "false","id": 161,"url": "/reports/GenerateReports.do?firstTime=true&reportID=161","Name": "webclient.reports.storagesummary.title","desc": "Storage Summary"},{"customStatus": "False","displayName": "RAID Capacity Utilization","isCustom": "false","id": 162,"url": "/reports/GenerateReports.do?firstTime=true&reportID=162","Name": "webclient.reports.topncapacity","desc": "RAID Capacity Utilization"},{"customStatus": "False","displayName": "RAID IOPS ","isCustom": "false","id": 163,"url": "/reports/GenerateReports.do?firstTime=true&reportID=163","Name": "webclient.reports.topnraidiops","desc": "RAID IOPS "},{"customStatus": "False","displayName": "RAID Reads/Sec","isCustom": "false","id": 164,"url": "/reports/GenerateReports.do?firstTime=true&reportID=164","Name": "webclient.reports.topnraidreads","desc": "RAID Reads/Sec"},{"customStatus": "False","displayName": "RAID Writes/Sec","isCustom": "false","id": 165,"url": "/reports/GenerateReports.do?firstTime=true&reportID=165","Name": "webclient.reports.topnraidwrites","desc": "RAID Writes/Sec"},{"customStatus": "False","displayName": "RAID Latency","isCustom": "false","id": 166,"url": "/reports/GenerateReports.do?firstTime=true&reportID=166","Name": "webclient.reports.topnraidlatency","desc": "RAID Latency"},{"customStatus": "False","displayName": "RAID Controller IOPS","isCustom": "false","id": 167,"url": "/reports/GenerateReports.do?firstTime=true&reportID=167","Name": "webclient.reports.topnraidcontrolleriops","desc": "RAID Controller IOPS"},{"customStatus": "False","displayName": "RAID Controller Reads/Sec","isCustom": "false","id": 168,"url": "/reports/GenerateReports.do?firstTime=true&reportID=168","Name": "webclient.reports.topnraidcontrollerreads","desc": "RAID Controller Reads/Sec"},{"customStatus": "False","displayName": "RAID Controller Writes/Sec","isCustom": "false","id": 169,"url": "/reports/GenerateReports.do?firstTime=true&reportID=169","Name": "webclient.reports.topnraidcontrollerwrites","desc": "RAID Controller Writes/Sec"},{"customStatus": "False","displayName": "Disk IOPS","isCustom": "false","id": 170,"url": "/reports/GenerateReports.do?firstTime=true&reportID=170","Name": "webclient.reports.topndiskiops","desc": "Disk IOPS"},{"customStatus": "False","displayName": "Disk Reads/Sec","isCustom": "false","id": 171,"url": "/reports/GenerateReports.do?firstTime=true&reportID=171","Name": "webclient.reports.topndiskreads","desc": "Disk Reads/Sec"},{"customStatus": "False","displayName": "Disk Writes/Sec","isCustom": "false","id": 172,"url": "/reports/GenerateReports.do?firstTime=true&reportID=172","Name": "webclient.reports.topndiskwrites","desc": "Disk Writes/Sec"},{"customStatus": "False","displayName": "RAID Forecast By Utilization","isCustom": "false","id": 173,"url": "/reports/GenerateReports.do?firstTime=true&reportID=173","Name": "webclient.reports.forecast.title","desc": "RAID Forecast By Utilization"}],"title": ""}],"Name": "Storage Reports"},{"displayName": "Forecast Reports","list": [{"list": [{"customStatus": "False","displayName": "Memory Forecast","isCustom": "false","id": 177,"url": "/reports/GenerateReports.do?firstTime=true&reportID=177","Name": "Memory Forecast","desc": "Forecasts the Memory Utilization"},{"customStatus": "False","displayName": "Disk Forecast By Usage","isCustom": "false","id": 175,"url": "/reports/GenerateReports.do?firstTime=true&reportID=175","Name": "Disk Forecast By Usage","desc": "Disk Forecast By Usage"},{"customStatus": "False","displayName": "CPU Forecast","isCustom": "false","id": 178,"url": "/reports/GenerateReports.do?firstTime=true&reportID=178","Name": "CPU Forecast","desc": "Forecasts the CPU utilization"}],"title": ""}],"Name": "Forecast Reports"},{"displayName": "Nutanix Reports","list": [{"list": [{"customStatus": "False","displayName": "Top N Hosts by IOPS","isCustom": "false","id": 740,"url": "/reports/GenerateReports.do?firstTime=true&reportID=740","Name": "webclient.nutanix.hostsUnderIOPS.report","desc": "Get report for Top Hosts with IOPS rate"},{"customStatus": "False","displayName": "Disk Inventory","isCustom": "false","id": 739,"url": "/reports/GenerateReports.do?firstTime=true&reportID=739","Name": "webclient.nutanix.disk.report","desc": "Get report for all Disk Inventory Details"},{"customStatus": "False","displayName": "Storage Containers","isCustom": "false","id": 738,"url": "/reports/GenerateReports.do?firstTime=true&reportID=738","Name": "webclient.nutanix.storagecontainers","desc": "Get report for all Storage Container Details"},{"customStatus": "False","displayName": "Cluster Latency","isCustom": "false","id": 736,"url": "/reports/GenerateReports.do?firstTime=true&reportID=736","Name": "webclient.nutanix.cluster.latency.report","desc": "Get report for all Cluster Latency Data"},{"customStatus": "False","displayName": "Cluster IOPS","isCustom": "false","id": 735,"url": "/reports/GenerateReports.do?firstTime=true&reportID=735","Name": "webclient.nutanix.cluster.iops.report","desc": "Get report for all Cluster IOPS Data"},{"customStatus": "False","displayName": "Cluster Inventory","isCustom": "false","id": 734,"url": "/reports/GenerateReports.do?firstTime=true&reportID=734","Name": "webclient.nutanix.cluster.report","desc": "Get report for all Cluster details"},{"customStatus": "False","displayName": "VM Summary by Host","isCustom": "false","id": 733,"url": "/reports/GenerateReports.do?firstTime=true&reportID=733","Name": "webclient.nutanix.hostToVmMap.report","desc": "Get report for VMs Details based on its Host"},{"customStatus": "False","displayName": "VM Summary by Cluster","isCustom": "false","id": 732,"url": "/reports/GenerateReports.do?firstTime=true&reportID=732","Name": "webclient.nutanix.clusterToVMMap.report","desc": "Get report for VM Details based on its Cluster"},{"customStatus": "False","displayName": "Host Summary","isCustom": "false","id": 737,"url": "/reports/GenerateReports.do?firstTime=true&reportID=737","Name": "webclient.nutanix.clusterToHostMap.report","desc": "Get report for all Host Details based on its Cluster"},{"customStatus": "False","displayName": "Top N Hosts by IO Bandwidth","isCustom": "false","id": 743,"url": "/reports/GenerateReports.do?firstTime=true&reportID=743","Name": "webclient.nutanix.hostUnderBandwidth.report","desc": "Get report for Top Disks with IO Bandwidth rate"},{"customStatus": "False","displayName": "Top N Hosts by Latency","isCustom": "false","id": 742,"url": "/reports/GenerateReports.do?firstTime=true&reportID=742","Name": "webclient.nutanix.hostUnderLatency.report","desc": "Get report for Top Hosts with Latency"},{"customStatus": "False","displayName": "Top N Disks by free space","isCustom": "false","id": 741,"url": "/reports/GenerateReports.do?firstTime=true&reportID=741","Name": "webclient.nutanix.diskUnderFreespace.report","desc": "Get report for Top Disks with Free space"}],"title": ""}],"Name": "Nutanix Reports"},{"displayName": "WLC Reports","list": [{"list": [{"customStatus": "False","displayName": "AP Availability","isCustom": "false","id": 837,"url": "/reports/GenerateReports.do?firstTime=true&reportID=837","Name": "webclient.availability.accessPoints.report","desc": "Get availability report for Access points"},{"customStatus": "False","displayName": "Rogue SSID Details","isCustom": "false","id": 839,"url": "/reports/GenerateReports.do?firstTime=true&reportID=839","Name": "webclient.inventory.RougeAP.report","desc": "Get inventory report of Rogue SSIDs"},{"customStatus": "False","displayName": "AP Details","isCustom": "false","id": 838,"url": "/reports/GenerateReports.do?firstTime=true&reportID=838","Name": "webclient.inventory.accessPoints.report","desc": "Get inventory report of Access points"}],"title": ""}],"Name": "WLC Reports"},{"displayName": "Meraki Reports","list": [{"list": [{"customStatus": "False","displayName": "Meraki MS Details","isCustom": "false","id": 855,"url": "/reports/GenerateReports.do?firstTime=true&reportID=855","Name": "webclient.opm.reports.meraki.msdetails","desc": "Get summary reports of Meraki Switch devices."},{"customStatus": "False","displayName": "Meraki AP Details","isCustom": "false","id": 860,"url": "/reports/GenerateReports.do?firstTime=true&reportID=860","Name": "webclient.opm.reports.meraki.apDetails","desc": "Get inventory reports of Meraki Access Points."},{"customStatus": "False","displayName": "Meraki Rogue SSID Details","isCustom": "false","id": 859,"url": "/reports/GenerateReports.do?firstTime=true&reportID=859","Name": "webclient.opm.reports.meraki.rogue","desc": "Get inventory reports of Meraki Rogue SSIDs."},{"customStatus": "False","displayName": "Meraki Cellular Gateway Details","isCustom": "false","id": 858,"url": "/reports/GenerateReports.do?firstTime=true&reportID=858","Name": "webclient.opm.reports.meraki.mgdetails","desc": "Get summary reports of Meraki Gateway devices."},{"customStatus": "False","displayName": "Meraki MV Details","isCustom": "false","id": 857,"url": "/reports/GenerateReports.do?firstTime=true&reportID=857","Name": "webclient.opm.reports.meraki.mvdetails","desc": "Get summary reports of Meraki Vision devices."},{"customStatus": "False","displayName": "Meraki MR Details","isCustom": "false","id": 856,"url": "/reports/GenerateReports.do?firstTime=true&reportID=856","Name": "webclient.opm.reports.meraki.mrdetails","desc": "Get summary reports of Meraki Radio devices."},{"customStatus": "False","displayName": "Meraki Organization Summary","isCustom": "false","id": 853,"url": "/reports/GenerateReports.do?firstTime=true&reportID=853","Name": "webclient.opm.reports.meraki.orgSummary","desc": "Get inventory reports of devices in each organization"},{"customStatus": "False","displayName": "Meraki MX Details","isCustom": "false","id": 854,"url": "/reports/GenerateReports.do?firstTime=true&reportID=854","Name": "webclient.opm.reports.meraki.mxdetails","desc": "Get summary reports of Meraki Security appliances."},{"customStatus": "False","displayName": "Down Meraki Devices","isCustom": "false","id": 861,"url": "/reports/GenerateReports.do?firstTime=true&reportID=861","Name": "webclient.opm.reports.meraki.down","desc": "Get reports for all Meraki devices that are down."}],"title": ""}],"Name": "Meraki Reports"},{"displayName": "My Favorites","list": [{"list": [{"customStatus": "False","displayName": "All Alerts","isCustom": "false","id": 84,"isFavourite": "True","url": "/reports/GenerateReports.do?firstTime=true&reportID=84","Name": "All Alerts","desc": "Get report for all alerts"},{"customStatus": "False","displayName": "All Events","isCustom": "false","id": 1,"isFavourite": "True","url": "/reports/GenerateReports.do?firstTime=true&reportID=1","Name": "All Events","desc": "Get report for all events"},{"customStatus": "False","displayName": "WAN Links by Utilization","isCustom": "false","id": 15,"isFavourite": "True","url": "/reports/GenerateReports.do?firstTime=true&reportID=15","Name": "WAN Links by Utilization","desc": "Identify WAN links with heavy traffic utilization"},{"customStatus": "True","displayName": "Servers Health Report","isCustom": "true","id": 22,"isFavourite": "True","url": "/reports/GenerateReports.do?firstTime=true&reportID=22","Name": "Servers Health Report","desc": "Get health report of servers"},{"customStatus": "False","displayName": "WAN Links Availability","isCustom": "false","id": 54,"isFavourite": "True","url": "/reports/GenerateReports.do?firstTime=true&reportID=54","Name": "WAN Links Availability","desc": "Get availability report for all interfaces"},{"customStatus": "False","displayName": "All Interfaces Availability","isCustom": "false","id": 87,"isFavourite": "True","url": "/reports/GenerateReports.do?firstTime=true&reportID=87","Name": "All Interfaces Availability","desc": "Get availability report for all interfaces"},{"customStatus": "False","displayName": "Service Monitors Availability","isCustom": "false","id": 56,"isFavourite": "True","url": "/reports/GenerateReports.do?firstTime=true&reportID=56","Name": "Service Monitors Availability","desc": "Get availability report for all service monitors"},{"customStatus": "False","displayName": "Devices by Category","isCustom": "false","id": 70,"isFavourite": "True","url": "/reports/GenerateReports.do?firstTime=true&reportID=70","Name": "Devices by Category","desc": "Get inventory report of devices by device category"}],"title": ""}],"Name": "My Favorites"},{"ScheduleReports": true,"FavoriteReports": false,"CustomReports": true}]
Rate limit: 100 requests per minute. Exceeding this limit will block requests for 1 minute
 ", "displayName": "10.5.5.1", "operStatusImg": "